Vol 448 | 2 August 2007 | doi:10.1038/nature06008
ARTICLES Genome-wide maps of chromatin state in pluripotent and lineage-committed cells Tarjei S. Mikkelsen1,2, Manching Ku1,4, David B. Jaffe1, Biju Issac1,4, Erez Lieberman1,2, Georgia Giannoukos1, Pablo Alvarez1, William Brockman1, Tae-Kyung Kim5, Richard P. Koche1,2,4, William Lee1, Eric Mendenhall1,4, Aisling O’Donovan4, Aviva Presser1, Carsten Russ1, Xiaohui Xie1, Alexander Meissner3, Marius Wernig3, Rudolf Jaenisch3, Chad Nusbaum1, Eric S. Lander1,3* & Bradley E. Bernstein1,4,6* We report the application of single-molecule-based sequencing technology for high-throughput profiling of histone modifications in mammalian cells. By obtaining over four billion bases of sequence from chromatin immunoprecipitated DNA, we generated genome-wide chromatin-state maps of mouse embryonic stem cells, neural progenitor cells and embryonic fibroblasts. We find that lysine 4 and lysine 27 trimethylation effectively discriminates genes that are expressed, poised for expression, or stably repressed, and therefore reflect cell state and lineage potential. Lysine 36 trimethylation marks primary coding and non-coding transcripts, facilitating gene annotation. Trimethylation of lysine 9 and lysine 20 is detected at satellite, telomeric and active long-terminal repeats, and can spread into proximal unique sequences. Lysine 4 and lysine 9 trimethylation marks imprinting control regions. Finally, we show that chromatin state can be read in an allele-specific manner by using single nucleotide polymorphisms. This study provides a framework for the application of comprehensive chromatin profiling towards characterization of diverse mammalian cell populations. One of the fundamental mysteries of biology is the basis of cellular state. Although they have essentially identical genomes, the different cell types in a multicellular organism maintain markedly different behaviours that persist over extended periods. The most extreme case is lineage commitment during development, where cells progress from totipotency to pluripotency to terminal differentiation; each step involves establishment of a stable state encoding specific developmental commitments that can be faithfully transmitted to daughter cells. Considerable evidence suggests that cellular state may be closely related to ‘chromatin state’—that is, modifications to histones and other proteins that package the genome1–3. Accordingly, it would be desirable to construct ‘chromatin-state maps’ for a wide variety of cell types, showing the genome-wide distribution of important chromatin modifications. Chromatin state can be studied by chromatin immunoprecipitation (ChIP), in which an antibody is used to enrich DNA from genomic regions carrying a specific epitope. The major challenge to generating genome-wide chromatin-state maps lies in characterizing these enriched regions in a scalable manner. Enrichment at individual loci is commonly assayed by polymerase chain reaction (PCR), but this method does not scale efficiently. A more recent approach has been ChIP-chip, in which enriched DNA is hybridized to a microarray4,5. This technique has been successfully used to study large genomic regions. However, ChIP-chip suffers from inherent technical limitations: (1) it requires large amounts (several micrograms) of DNA and thus involves extensive amplification, which introduces bias; (2) it is subject to cross-hybridization, which hinders the study of repeated sequences and allelic variants; and (3) it is currently expensive to study entire mammalian genomes. Given these issues, only a handful of whole-genome ChIP-chip studies in mammals have been reported.
In principle, chromatin could be readily mapped across the genome by sequencing ChIP DNA and identifying regions that are over-represented among these sequences. Notably, sequence-based mapping could require relatively small quantities of DNA and provide nucleotide-level discrimination of similar sequences, thereby maximizing genome coverage. The major limitation has been that high-resolution mapping requires millions of sequences (Supplementary Note 1). This is cost-prohibitive with traditional technology, even with concatenation of multiple sequence tags6. However, recent advances in single-molecule-based sequencing (SMS) technology promise to increase throughput and decrease costs markedly7. In the approach developed by Illumina/Solexa, DNA molecules are arrayed across a surface, locally amplified, subjected to successive cycles of primer-mediated single-base extension (using fluorescently labelled reversible terminators) and imaged after each cycle to determine the inserted base. The ‘read length’ is short (25–50 bases), but tens of millions of DNA fragments may be read simultaneously. Here, we report the development of a method for mapping ChIP enrichment by sequencing (ChIP-Seq) and describe its application to create chromatin-state maps for pluripotent and lineage-committed mouse cells. The resulting data define three broad categories of promoters based on their chromatin state in embryonic stem (ES) cells, including a larger than anticipated set of ‘bivalent’ promoters; reveal that lineage commitment is accompanied by characteristic chromatin changes at bivalent promoters that parallel changes in gene expression and transcriptional competence; and demonstrate the potential for using ChIP for genome-wide annotation of novel promoters and primary transcripts, active transposable elements, imprinting control regions and allele-specific transcription. This study provides a technological framework for comprehensive characterization of chromatin state across diverse mammalian cell populations.
1
Broad Institute of Harvard and MIT, 2Division of Health Sciences and Technology, MIT, and 3Whitehead Institute for Biomedical Research, Cambridge, Massachusetts 02142, USA. Molecular Pathology Unit and Center for Cancer Research, Massachusetts General Hospital, Charlestown, Massachusetts 02129, USA. 5Department of Neurology, Children’s Hospital, and 6Department of Pathology, Harvard Medical School, Boston, Massachusetts 02115, USA. *These authors contributed equally to this work. 4
553 ©2007 Nature Publishing Group
ARTICLES
NATURE | Vol 448 | 2 August 2007
20 kb
H3K4me3 ChIP-Seq
ChIP-chip
H3K27me3 ChIP-Seq
ChIP-chip c3 Ao c2 Ao 3 me Ps
1 cn Be
td Cndc56 Cc
h1
3ip mc
k4 Wn 5 s2 V p p2 m Ra
Ez
p1 tna 4 Cn 9004 0 25 AK 00 02 BC 2 bg Tu
ik 3R 1 bg M0 T u 00 1 0 0 13
Ps
0a
x Ml a sy Co 17b1 d Hs glu Na
6v Atp
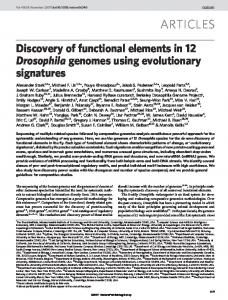
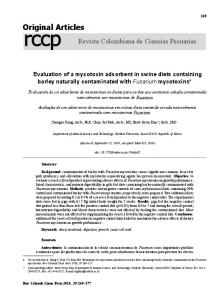
Figure 1 | Comparison of ChIP-Seq and ChIP-chip data. Direct comparison of H3K4me3 (green) and H3K27me3 (red) ChIP data across a 300-kb region in mouse ES cells from independent experiments assayed by SMS (absolute
fragment counts) or tiling arrays (log P-values for enrichment relative to whole-cell extracts15).
Genome-wide chromatin-state maps We created genome-wide chromatin-state maps for three mouse cell types: ES cells, neural progenitor cells (NPCs)8 and embryonic fibroblasts (MEFs). For each cell type, we prepared and sequenced ChIP DNA samples for some or all of the following features: panH3, trimethylated histone H3 lysine 4 (H3K4me3), H3K9me3, H3K27me3, H3K36me3, H4K20me3 and RNA polymerase II (Supplementary Table 1). In each case, we sequenced nanogram quantities of DNA fragments (,300 base pairs (bp)) on an Illumina/Solexa sequencer. We obtained an average of 10 million successful reads, consisting of the terminal 27–36 bases of each fragment. The reads were mapped to the genome and used to determine the number of ChIP fragments
overlapping any given position (Fig. 1). Enriched intervals were defined as regions where this number exceeded a threshold defined by randomization (see Methods). The full data set consists of 18 chromatin-state maps, containing ,140 million uniquely aligned reads, representing over 4 billion bases of sequence. We validated the chromatin-state maps by computational analysis and by comparison to previous methods. ChIP-Seq maps of specific histone modifications show marked enrichment at specific locations in the genome, whereas the pan-H3 and unenriched samples show relatively uniform distributions (Supplementary Figs 1 and 2). The maps show close agreement with our previously reported ChIP-chip data from ,2.5% of the mouse genome9 (Fig. 1). Also, ChIP-PCR assays of 50 sites chosen to represent a range of ChIP-Seq fragment
NPC states
K4
0.6
K4/K27 K27 None
2, 78 3
n= 19 7
n=
5
5 76 n=
0.2 0
None
K4 K4/K27
e
3.0 2.5 2.0 1.5 1.0
*
ES cell
NPC
3.5 3.0 2.5 2.0 1.5 1.0
*
NPC
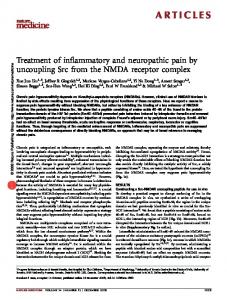
Figure 2 | Histone trimethylation state predicts expression of HCPs and LCPs. a, Mammalian promoters can be readily classified into sets with high (HCPs), intermediate (ICPs) or low (LCPs) CpG-content. In ES cells, virtually all HCPs are marked by H3K4me3, either alone (green) or in combination with H3K27me3 (yellow). In contrast, most LCPs have neither mark (grey). Few promoters are only enriched for H3K27me3 (red). b, Trimethylation states of HCPs and LCPs in NPCs (indicated by colours), conditional on their ES cell state (indicated below each bar). HCPs marked by H3K4me3 only in ES cells tend to retain this mark. HCPs marked by H3K4me3 and H3K27me3 tend to lose one or both marks, although some
K4 /K 27 K2 7 N on e
*
K4
K4 /K 27 K2 7 N on e
ES cell
K4
K2 7
0.5 K4 /
K K4 4 /K 27 K2 7 N on e
K4
0.5
LCP
ES cell
NPC
*
ES cell
*
7 K2 7 N on e
3.5
None
/K 2
Expression level (log10)
HCP
K4
d
K4
ES cell (HCPs) ES cell (LCPs)
K4
K4
ES cell (HCPs) ES cell (LCPs)
on e K4
K4 K4/K27
HCPs ICPs LCPs
Expression level (log10)
n= 2, 52
8,
,7 83
7 19 n=
5 76
,5 n= 2
n=
8,
11 ,4 10 n= 3, 33 8 n= 3, 01 4
n=
n= 2
2.6%
1.5%
0.8
0.4
MEF states
c
N
Fraction of promoters
1.0
b
25
ES cell states
a
NPC
remain bivalent. Small, partially overlapping subsets of LCPs are marked by H3K4me3. c, Trimethylation states of HCPs and LCPs in MEFs. d, Changes in expression levels of HCP genes with H3K4me3 alone (left) or also with H3K27me3 (right) upon differentiation to NPCs. Resolution of bivalent promoters to H3K4me3 is associated with increased expression. e, Changes in expression levels of LCP genes with H3K4me3 (left) or no mark (right) upon differentiation to NPCs. Gain of H3K4me3 is associated with increased expression. For d and e, boxplots show median (red bar), 25th and 75th percentile expression levels in ES cells. Whiskers show 2.5th and 97.5th percentiles. Asterisks indicate classes with less than 15 genes.
554 ©2007 Nature Publishing Group
ARTICLES
NATURE | Vol 448 | 2 August 2007
counts showed 98% concordance and a strong, quantitative correlation (Supplementary Fig. 3 and Supplementary Table 2). Promoter state in ES and lineage-committed cells We began our analysis by studying H3K4me3 and H3K27me3 patterns at known promoters. H3K4me3 is catalysed by trithorax-group (trxG) proteins and associated with activation, whereas H3K27me3 is catalysed by polycomb-group (PcG) proteins and associated with silencing10,11. Recently, we and others observed that some promoters in ES cells carry both H3K4me3 and H3K27me39,12. We termed this novel combination a ‘bivalent’ chromatin mark and proposed that it serves to poise key developmental genes for lineage-specific activation or repression. We studied 17,762 promoters inferred from full-length transcripts (Supplementary Table 3). Mammalian RNA polymerase II promoters are known to occur in at least two major forms13,14 (Supplementary Fig. 4). CpG-rich promoters are associated with both ubiquitously expressed ‘housekeeping’ genes, and genes with more complex expression patterns, particularly those expressed during embryonic development. CpG-poor promoters are generally associated with highly tissue-specific genes. Accordingly, we divided our analysis to focus on ‘high’ CpG promoters (HCP; n 5 11,410) and ‘low’ CpG promoters (LCP; n 5 3,014) separately. To ensure a clean separation, we defined a set of intermediate CpG content promoters (ICP; n 5 3,338); this class shows properties consistent with being a mixture of the two major classes. High CpG promoters in ES cells. Virtually all HCPs (99%) are associated with intervals of significant H3K4me3 enrichment in ES cells (Fig. 2a). The modified histones are typically confined to a punctate interval of 1–2 kilobases (kb) (Supplementary Fig. 5). As observed previously15,16, there is a strong correlation between the intensity of H3K4me3 and the expression level of the associated genes (Spearman’s r 5 0.67). However, not all promoters associated with H3K4me3 are active. a
b
The chromatin-state maps reveal that ,22% of HCPs (n 5 2,525) are actually bivalent, exhibiting both H3K4me3 and H3K27me3 (Fig. 2a). A minority of these (n 5 564) are ‘wide’ bivalent sites in which H3K27me3 extends over a region of at least 5 kb and resemble those described previously9. The majority (n 5 1,961) are ‘narrow’ bivalent sites, with more punctate H3K27me3, that correspond to many additional PcG target promoters17–19. Bivalent promoters show low activity despite the presence of H3K4me3, suggesting that the repressive effect of PcG activity is generally dominant over the ubiquitous trxG activity (Supplementary Fig. 6 and Supplementary Table 4). The different types of chromatin marks at HCPs are closely related to the nature of the associated genes (Supplementary Table 5). Monovalent promoters (H3K4me3) generally regulate genes with ‘housekeeping’ functions including replication and basic metabolism. By contrast, bivalent promoters are associated with genes with more complex expression patterns, including key developmental transcription factors, morphogens and cell surface molecules. In addition, several bivalent promoters appear to regulate transcripts for lineage-specific microRNAs. High CpG promoters in NPCs and MEFs. Most HCPs marked with H3K4me3 alone in ES cells retain this mark both in NPCs and MEFs (92% in each; Figs 2b, c and 3a). This is consistent with the tendency for this sub-class of promoters to regulate ubiquitous housekeeping genes. A small proportion (,4%) of these promoters have H3K27me3 in MEFs, and are thus bivalent or marked by H3K27me3 alone. This correlates with lower expression levels and may reflect active recruitment of PcG proteins to new genes during differentiation20. An example is the transcription factor gene Sox2, where the promoter is marked by H3K4me3 alone in ES cells and NPCs, but H3K27me3 alone in MEFs. Notably, this locus is flanked by CpG islands with bivalent markings in ES cells (see below), suggesting that the locus may be poised for repression upon differentiation. d
c
e
g
f
5 kb
H3K4me3 ES cells
H3K27me3
NPCs
MEFs
Fa 7
bp
arg Pp
g1
g uro Ne
Oli
lm Po
2 xp Fo P LC
2 xp Fo P HC
1
10 kb
h
*
ES cells
c5 c4
c3
a12 b8
a11 b7 a10
b6 a9
b5
a8
b4
a7
a6
a5 b2
a4 b1
a3
a2
a1
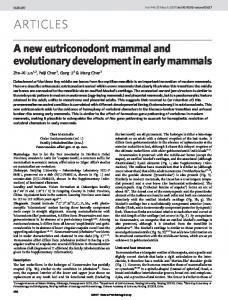
Figure 3 | Cell-type-specific chromatin marks at promoters. a, Multiple ‘housekeeping genes’, such as DNA polymerase m (Polm), are associated with HCPs marked by H3K4me3 in all cell types. b, The neural transcription factor gene Olig1 (HCP) is bivalent in ES cells, but resolves to H3K4me3 in NPCs and H3K27me3 in MEFs. c, The neurogenesis transcription factor gene Neurog1 (HCP) remains bivalent upon differentiation to NPCs, but resolves to H3K27me3 in MEFs. d, The adipogenesis transcription factor gene Pparg (HCP) remains bivalent in MEFs, but loses both marks in NPCs.
Constant region
e, The neural progenitor marker gene Fabp7 (LCP) is marked by H3K4me3 in NPCs only. f, The brain and lung expressed transcription factor gene Foxp2 is associated with an HCP that is bivalent in ES cells, but resolves to H3K4me3 in NPCs and remains bivalent in MEFs. g, Foxp2 also has an LCP marked by H3K4me3 in MEFs only. h, Multiple, distinct bivalent chromatin marks at the variable region promoters of Pcdhg. A promoter proximal to the constant region exons (asterisk) is marked by H3K4me3 only. 555
©2007 Nature Publishing Group
ARTICLES
NATURE | Vol 448 | 2 August 2007
The majority of HCPs with bivalent marks in ES cells resolve to a monovalent status in the committed cells. In NPCs, 46% resolve to H3K4me3 only and these genes show increased expression (Figs 2b, d and 3b). Of the remaining promoters, 14% resolve to H3K27me3 alone and 32% lose both marks, with both outcomes being associated with low levels of expression. Notably, 8% remain bivalent and these genes also continue to be repressed (Figs 2b, d and 3c). A less resolved pattern is seen in MEFs, with 32% marked by H3K4me3 alone, 22% marked by H3K27me3 alone, 3% without both marks, and the remaining (43%) still bivalent (Fig. 2c). The relatively high number of bivalent promoters in MEFs may reflect a less differentiated state and/or heterogeneity in the population. Distinct regulation of low CpG promoters. The LCPs show a very different pattern than the HCPs. Only a small minority (6.5%, n 5 207) of LCPs have significant H3K4me3 in ES cells and virtually none have H3K27me3 (Fig. 2a). Most of these promoters have lost H3K4me3 in NPCs and MEFs, whereas a small number of other LCPs (1.5% and 2.6%, respectively) have gained the mark (Figs 2b, c and 3e). In all three cell types, the expression levels of the associated genes strongly correlate with the presence or absence of H3K4me3 (Fig. 2e and Supplementary Fig. 6). The genes with LCPs marked by H3K4me3 are closely related to tissue-specific functions. In NPCs, they include genes encoding several known markers of neural progenitors in vivo (such as Fabp7, Cp, Gpr56). In MEFs, they include genes encoding extracellular matrix components and growth factors (such as Col3a1, Col6a1, Postn, Aspn, Hgf, Figf), consistent with the mesenchymal origin of these cells (see below). We conclude that HCPs and LCPs are subject to distinct modes of regulation. In ES cells, all HCPs seem to be targets of trxG activity, and may therefore drive transcription unless actively repressed by PcG proteins. In committed cell types, a subset of HCPs appears to lose the capacity to recruit trxG activity (possibly due to other epigenetic modifications, such as DNA methylation21). In contrast, CpG-poor promoters seem to be inactive by default, independent of repression by PcG proteins, and may instead be selectively activated by cell-type- or tissue-specific factors. Alternative promoter use. We note that genes with alternative promoters may have multiple, distinct chromatin states. An ‘active’ state at any one of these promoters may be sufficient to drive expression. A common situation involves genes with one major HCP and one or more alternative LCPs. An example is the transcription factor Foxp2, which is expressed at moderate levels in both NPCs and MEFs (Fig. 3f, g). The Foxp2 HCP is marked by H3K4me3 in NPCs, but is bivalent in MEFs. However, an alternative LCP is marked by H3K4me3 exclusively in MEFs. The protocadherin-c (Pcdhg) locus is a more extreme case: the amino-terminal variable regions of this gene are transcribed from at least 20 different HCPs in neurons22, all of which carry bivalent chromatin marks in ES cells. Pcdhg expression is nevertheless detected by microarrays, possibly owing to a single promoter in front of the carboxy-terminal constant region marked by H3K4me3 alone (Fig. 3h). Although only ,10% of the genes analysed here have more than one known promoter, recent ‘cap-trapping’ studies suggest that alternative promoter use may be substantially more common23. The ability of ChIP-Seq to assess chromatin state at known promoters, as well as to identify novel promoters (see below), should prove valuable in analysis of transcriptional networks. Promoter state reflects lineage commitment and potential Given their association with epigenetic memory, we next examined whether the patterns of H3K4me3 and H3K27me3 can reflect developmental potential. Both of the committed cell types studied here have been shown to be multipotent ex vivo. NPCs can be differentiated to glial and neuronal lineages8, whereas primary MEFs have been differentiated into adipocytes24, chondrocytes25 and osteoblastlike cells26.
Lineage-specific resolution and retention of bivalent marks. We first examined a set of genes involved in in vivo differentiation pathways known to be, at least partially, recapitulated by MEFs, NPCs, or neither. These genes all have bivalent promoters in ES cells. We found that their resolution in lineage-committed cells is closely related to their demonstrated developmental potential (Supplementary Table 6): (1) genes restricted to regulation or specialized functions in unrelated lineages, such as haematopoietic (Cdx4, PU.1 (also called Sfpi1)), epithelial (Cnfn, Krt2-4), endoderm (Gata6, Pdx1) or germ line (Tenr (Adad1), Ctcfl), generally resolved to monovalent H3K27me3 or carry neither mark in both NPCs and MEFs. (2) Genes related to adipogenesis and chondro/osteogenesis often remain bivalent in MEFs, but not in NPCs. Examples include Pparg, which is a key regulator of adipogenesis, and Sp7, which promotes chondro/osteogenic pathways. Early mesenchymal markers, such as Runx1 and Sox9, resolved to H3K4me3 alone in MEFs. (3) Genes related to gliogenesis and neurogenesis often resolved to H3K4me3 alone or remain bivalent in NPCs, whereas they resolved to H3K27me3 alone in the MEFs. Gliogenesis and neurogenesis are thought to be mutually opposing pathways27, and we find that genes promoting gliogenesis are more likely to resolve to H3K4me3 in NPCs. Examples include Bmp2 and the microRNA mir-9-3, which promotes glial but inhibits neuronal differentiation28. Several genes known to promote neuronal differentiation, such as Neurog1 and Neurog2, remain bivalent whereas others, such as Bmp6, appear to resolve to H3K27me3 alone. In our hands, the NPCs differentiate to astrocytes with significantly higher efficiency than to neurons (M.W., unpublished data). The observed chromatin patterns may reflect this gliogenic bias. Correlation with expression in adult tissues. We next analysed gene expression in adult tissues with major contributions from neuroectodermal or mesenchymal lineages. We reasoned that if H3K4me3 is generally not restored once lost, then differential loss of H3K4me3 at promoters early in these lineages (as represented by NPCs and MEFs, respectively) might be reflected in differential gene expression patterns in related adult tissues. Notably, we observed a clear bias in relative expression levels between relevant adult tissues for genes that retain H3K4me3 in NPCs only versus genes that retain H3K4me3 in MEFs only. The former are strongly biased towards higher expression in various brain sections, whereas the latter are biased towards higher expression in bone, adipose and other mesenchyme-rich tissues (Fig. 4). These analyses are limited by alternative promoter usage, the cell models used, and the heterogeneity of the adult tissues. Nonetheless, the data show clear trends that support an important role for retention and resolution of bivalent chromatin in the regulation of hierarchical lineage commitment. Genome-wide annotation of promoters and primary transcripts We next considered genome-wide maps of H3K36me3. This mark has been linked to transcriptional elongation and may serve to prevent aberrant initiation within gene bodies29–33. Our chromatin maps reveal a global pattern of H3K36me3 in mammals similar to that previously observed in yeast29. In all three cell types, H3K36me3 is strongly enriched across the transcribed regions of active genes (Fig. 5a), beginning immediately after the promoter H3K4me3 signal. The level of H3K36me3 is strongly correlated with the level of gene expression (Spearman’s r 5 0.77), although the dynamic range is compressed (1–2 orders of magnitude for H3K36me3 versus 3–4 for expression levels; Supplementary Fig. 7). Genes with bivalent promoters rarely show H3K36me3, consistent with their low expression. Notably, there is essentially no overlap between intervals significantly enriched for H3K36me3 and for H3K27me3, consistent with a role for PcG complexes in the exclusion of polymerases11. The vast majority of intervals significantly enriched for H3K36me3 is associated with known genes (,92% in ES cells), but there are
556 ©2007 Nature Publishing Group
ARTICLES
NATURE | Vol 448 | 2 August 2007
at least ,500 additional regions across the genome (median size ,2 kb), with most being adjacent to sites of H3K4me3. Inspection revealed a number of interesting cases, falling into three categories. The first category corresponds to H3K36me3 that extends significantly upstream from the annotated start of a known gene, often until an H3K4me3 site. These seem to reflect the presence of unannotated alternative promoters. A notable example is the Foxp1 locus. In ES cells, one annotated Foxp1 promoter is marked by H3K4me3 and another CpG-rich region located ,500 kb upstream carries a bivalent mark. In MEFs, this CpG island is marked by H3K4me3 only, and H3K36me3 extends from this site to the 39 end of Foxp1 (Fig. 5a). Although no transcript extending across this entire region has been reported in mouse, the orthologous position in human has been shown to act as a promoter for the orthologous gene. The ChIPSeq data contain many other examples where the combination of H3K36me3 and H3K4me3 seems to reveal novel promoters. The second category corresponds to H3K36me3 that extends significantly downstream of a known gene. An example is the Sox2 locus, which encodes a pluripotency-associated transcription factor that also functions during neural development. In ES cells, Sox2 has an unusually large region of H3K4me3 (.20 kb) accompanied by H3K36me3 extending far beyond the annotated 39 end (.15 kb); non-coding transcription throughout the locus has been noted previously34 and may serve a regulatory role (Fig. 5b). Mesenchymerich tissues
NPC: H3K4me3+ MEF: H3K4me3–
Brain sections
The third category seems to reflect transcription of non-coding RNA genes. For example, two regions with H3K36me3 and adjacent H3K4me3 correspond to recently discovered nuclear transcripts with possible functions in messenger RNA processing35 (Fig. 5c). In addition, a number of these presumptive transcriptional units overlap microRNAs (Fig. 5d). A striking example is a .200-kb interval within the Dlk1–Dio3 imprinted locus (Fig. 6a). This region harbours over 40 non-coding RNAs, including clusters of microRNAs and small nucleolar RNAs36. The ChIP-Seq data suggest that the entire region is transcribed as a single unit that initiates at a H3K4me3marked HCP. These findings suggest that genome-wide maps of H3K4me3 and H3K36me3 may provide a general tool for defining novel transcription units. The capacity to define the origins and extents of primary transcripts will be of particular value for characterizing the regulation of microRNAs and other non-coding RNAs that are rapidly processed from long precursors37. Finally, the relatively narrow dynamic range of H3K36me3 may offer advantages over RNA-based approaches in assessing gene expression and defining cellular states. H3K9 and H4K20 trimethylation mark specific repetitive elements We next studied H3K9me3 and H4K20me3, both of which have been associated with silencing of centromeres, transposons and tandem repeats38–40. We sought first to assess the relative enrichments of H3K9me3 and H4K20me3 across different types of repetitive elements by aligning ChIP-Seq reads directly to consensus sequences for various repeat families (,40 million reads could be aligned this way). H3K9me3 and H4K20me3 show nearly identical patterns of enrichment in ES cells. The strongest enrichments are observed for telomeric, satellite and long terminal repeats (LTRs). The LTR signal
50 kb
a H3K4me3 ES cells
H3K27me3 H3K36me3
MEFs CpG 1 xP Fo CP L
NPC: H3K4me3– MEF: H3K4me3+
1 xP Fo CP H
b
10 kb
c
d
ES cells CpG
a
34
irm
t1
ea N
t2 ea N
2
x So
Figure 4 | Correlation between chromatin-state changes and lineage expression. Relative expression levels across adult mouse brain (frontal and cerebral cortex, substantia nigra, cerebellum, amygdale, hypothalamus, hippocampus) and relatively mesenchyme-rich tissues (bone, white fat, brown fat, trachea, digits, lung, bladder, uterus, umbilical cord) are shown for genes with bivalent chromatin marks in ES cells that retain H3K4me3 in NPCs but lose this mark in MEFs (n 5 62) or vice versa (n 5 160). Red, white and blue indicate higher, equal and lower relative expression, respectively.
Figure 5 | H3K4me3 and H3K36me3 annotate genes and non-coding RNA transcripts. a, Foxp1 has two annotated promoters (based on RefSeq and UCSC ‘known genes’), only one of which shows H3K4me3 in ES cells. The corresponding transcriptional unit is marked by H3K36me3. In MEFs, H3K36me3 extends an additional 500 kb upstream to an H3K4me3 site that seems to reflect an alternative promoter (this site is bivalent in ES cells). b, H3K36me3 enrichment extends significantly downstream of Sox2. Although highly active in ES cells, Sox2 is flanked by two bivalent CpG islands that may poise it for repression. c, d, H3K4me3 and H3K36me3 indicate two highly expressed non-coding RNAs (c), and the putative primary transcript (dashed line) for a single annotated microRNA (d). 557
©2007 Nature Publishing Group
ARTICLES
NATURE | Vol 448 | 2 August 2007
within a subset of genes, although the functional implications remain to be elucidated.
primarily reflects enrichment of intracisternal A-particle (IAP) and early transposon (ETn) elements (Supplementary Fig. 8). IAP and ETn elements are active in murine ES cells and produce double-stranded RNAs41,42. RNA has also been implicated in maintaining satellite and telomeric heterochromatin38. Hence, these enrichment data are consistent with a global role for RNA in targeting repressive chromatin marks in mammalian ES cells, analogous to that observed in lower eukaryotes38,39. We next examined the distributions of H3K9me3 and H4K20me3 across unique sequences in the mouse genome. We identified ,1,800 H3K9me3 sites (median size ,300 bp) in ES cells, with the vast majority also showing H4K20me3. Fully 78% of the sites lie within 2 kb of a satellite repeat or LTR (primarily IAP and ETn elements). This suggests that repressive marks are capable of spreading from repeat insertions and could potentially regulate proximal unique sequence. Recent studies have described a handful of active genes with H3K9me3 and H4K20me3, raising the possibility that these ‘repressive’ marks also function in transcriptional activation31,32. One-third of the ,1,800 H3K9me3-enriched sites reside within an annotated gene, which is roughly the proportion expected by chance. However, H3K9me3 sites that are larger and/or more distant from LTRs are more likely to occur within genes (Supplementary Fig. 9). The largest genic site in ES cells (,6 kb) coincides with the Polrmt gene (Fig. 6d). This case is notable because the downstream gene (Hcn2) is convergent and contains a CpG island at its 39 end. Transcription from 39 promoters has been proposed as a potential mechanism of transcriptional interference by producing antisense transcripts23. This example may therefore reflect a link between transcriptional interference and H3K9me3, as has been suggested for a few other mammalian loci43,44. Our results thus confirm the presence of H3K9me3
H3K4 and H3K9 trimethylation at imprinted loci We next studied chromatin marks associated with imprinting. This epigenetic process typically involves allele-specific DNA methylation of CpG-rich imprinting control regions45. Several reports have also described allele-specific chromatin modification at a handful of imprinting control regions, with H3K9me3 and H4K20me3 on the DNA methylated allele and H3K4me3 on the opposite allele46,47. We searched for regions showing overlapping H3K9me3 and H3K4me3 in ES cells. Notably, 13 of the top 20 sites, as ranked by enrichment of the two marks, are located within known imprinted regions, coincident with imprinting control regions or imprinted gene promoters. An example is the Peg13 promoter (Fig. 6c). Conversely, of the ,20 known and putative autosomal imprinted loci that contain imprinting control regions, 17 have at least one with the overlapping chromatin marks (Supplementary Table 7). We conclude that overlapping H3K9me3 and H3K4me3 is a common signature of imprinting control regions in ES cells. Allele-specific histone methylation To explore the feasibility of inferring allele-specific chromatin states, we constructed chromatin-state maps in male ES cells derived from a more distant cross (129SvJae (maternal) x Mus musculus castaneus (paternal)), and used a catalogue of ,3.5 million single nucleotide polymorphisms (SNPs) to assign ChIP-Seq reads to one of the two parental alleles. As a positive control, we first compared results for chromosome X and the autosomes for reads derived by H3K4me3 ChIP. Virtually all
a
b 20 kb
5 kb
H3K4me3
H3K36me3
No. reads
4 castaneus
SNPs: H3K36me3
4 129 r Tp
miRNAs
c
d 2 kb H3K4me3
5 kb H3K4me3 H3K27me3 H3K36me3
H3K9me3 4
H3K9me3
castaneus
No. reads
SNPs: H3K4me3 H3K9me3
H4K20me3 CpG
4 129
t lrm
Po
2 cn H
3
g1
Pe
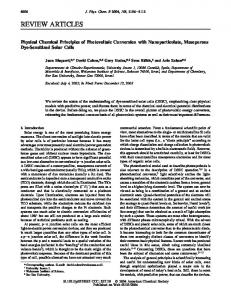
Figure 6 | Allele-specific histone methylation and genic H3K9me3/ H4K20me3. a, H3K4me3 and H3K36me3 indicate a primary microRNA transcript in the Dlk1–Dio3 locus. The allele specificity of this transcript is read out using ChIP-Seq data for hybrid ES cells and a SNP catalogue. The H3K36me3 reads overwhelmingly correspond to maternal 129SvJae alleles, consistent with the known maternal expression of these microRNAs36. b, In contrast, a non-imprinted transcript shows roughly equal proportions of
reads assigned to 129SvJae and M. m. castaneus alleles. c, Peg13 is marked by H3K4me3 and H3K9me3 in ES cells; 19 out of 21 H3K4me3 reads correspond to the paternal M. m. castaneus allele, whereas 6 out of 6 H3K9me3 reads correspond to the maternal 129SvJae allele, consistent with paternal expression of this gene. d, H3K9me3 and H4K20me3 enrichment evident at the Polrmt gene may reflect transcriptional interference owing to antisense transcription from the 39 UTR CpG island of Hcn2 (see text).
558 ©2007 Nature Publishing Group
ARTICLES
NATURE | Vol 448 | 2 August 2007
(97%) of ,3,700 informative reads on chromosome X, and roughly half (57%) of the 178,000 informative reads on the autosomes, were assigned to the 129SvJae strain. These proportions correspond roughly to the expected 100% and 50%. We then examined the allelic distribution at overlapping H3K4me3 and H3K9me3 sites coincident with putative imprinting control regions (see above). Six of the imprinting control regions had enough reads ($10) containing SNPs to assess allelic bias. In every case, the SNPs showed significant bias in the expected direction (P , 0.02; Fig. 6c and Supplementary Table 7). We applied the same approach to search for allelic imbalance in intervals with significant H3K36me3 enrichment, which would predict differential transcription of the two alleles. A striking interval corresponds to a microRNA cluster within the Dlk1–Dio3 locus known to be imprinted in the embryo proper36 (Fig. 6a, b). Of the additional imprinted genes with H3K36me3 enrichment, four (Snrpn, Grb10, Impact, Peg3) had enough reads containing SNPs to assess allelic bias. In every case, the data showed significant bias in the expected direction (P , 0.02). The data also revealed novel instances of allele-specific transcription. For example, a transcript of unknown function (BC054101), first identified in trophoblast stem cells48, showed highly significant maternal bias for H3K36me3, as well as H3K4me3 (P , 10215; Supplementary Fig. 10). The results suggest that, with sufficiently deep coverage and dense SNP maps, ChIP-Seq will provide a powerful means for identifying allele-specific chromatin modifications. With data from reciprocal crosses, it should be possible to discriminate novel cases of imprinting from strain-specific differences.
cycles of PCR. Sequencing was carried out using the Illumina/Solexa Genome Analyzer system according to the manufacturer’s specifications. Reads were aligned to the reference genome, and the fragment count at any given position (25-bp resolution) was estimated as the number of uniquely aligned reads oriented towards it and within 300 bp. Enriched intervals were identified by comparison of the mean fragment count in 1-kb windows against a sample-specific expected distribution estimated by randomization (H3K4me3, H3K27me3), or using a supervised Hidden Markov Model (H3K36me3, H3K9me3, H4K20me3). Promoters were inferred from full-length mouse RefSeqs. HCPs contain a 500-bp interval within 20.5 kb to 12 kb with a (G1C)-fraction $0.55 and a CpG observed to expected ratio (O/E) $0.6. LCPs contain no 500-bp interval with CpG O/E $0.4. Chromatin states of promoters were determined by overlap with H3K4me3- and H3K27me3-enriched intervals. Correlations with expression levels were calculated from the mean fragment count over each promoter or transcript. ES cell, NPC and MEF expression data were generated using GeneChip arrays (Affymetrix) and GenePattern (http://www.broad.mit.edu/cancer/software/). Expression data for adult tissues were downloaded from Novartis (http:// symatlas.gnf.org). Repeat class enrichments were determined by aligning reads to consensus sequences (http://www.girinst.org). Mouse SNP maps were obtained from Perlegen (http://mouse.perlegen.com). Allele-specific bias was evaluated by a binomial test of the null hypothesis that ChIP fragments were drawn uniformly from both alleles. Full Methods and any associated references are available in the online version of the paper at www.nature.com/nature. Received 10 May; accepted 13 June 2007. Published online 1 July 2007. 1.
Discussion Genome-wide chromatin-state maps provide a rich source of information about cellular state, yielding insights beyond what is typically obtained by RNA expression profiling. Analysis of H3K4me3 and H3K36me3 allows recognition of promoters together with their complete transcription units. This should help to define alternative promoters and their usage in specific cell types; identify the primary structure of genes encoding non-coding RNAs; detect gene expression (given the narrower dynamic range); and detect allele-specific transcription. In addition, analysis of H3K9me3 and H4K20me3 should facilitate the study of heterochromatin, spreading and imprinting mechanisms. Most interestingly, analysis of H3K4me3 and H3K27me3 provides a rich description of cellular state. Our results suggest that promoters may be classified as active, repressed or poised for alternative developmental fates. Conceivably, chromatin state at key regulatory genes may suffice to describe developmental commitment and potential. Given the technical features of ChIP-Seq (high throughput, low cost and input requirement), it is now appropriate to contemplate projects to generate catalogues of chromatin-state maps representing a wide range of human and mouse cell types. These should include varied developmental stages and lineages, from totipotent to terminally differentiated, with the aim of precisely defining cellular states at the epigenetic level and observing how they change over the course of normal development. Chromatin-state maps should also be systematically catalogued from situations of abnormal development. Cancer cells are the most obvious targets, as they are frequently associated with epigenetic defects and many appear to have acquired characteristics of earlier developmental stages. A comprehensive public database of chromatin-state maps would be a valuable resource for the scientific community.
2. 3. 4.
5. 6.
7. 8. 9. 10. 11. 12. 13.
14.
15. 16. 17. 18. 19.
METHODS SUMMARY Murine V6.5 ES cells (129SvJae 3 C57BL/6; male), hybrid ES cells (129SvJae 3 M. m. castaneus F1; male) and NPCs were cultured as described8,9. Primary MEFs (129SvJae 3 C57BL/6; male) were obtained at embryonic day (E)13.5. ChIP experiments were carried out as described15. Sequencing libraries were generated from 1–10 ng of ChIP DNA by adaptor ligation, gel purification and 18
20.
21.
Surani, M. A., Hayashi, K. & Hajkova, P. Genetic and epigenetic regulators of pluripotency. Cell 128, 747–762 (2007). Bernstein, B. E., Meissner, A. & Lander, E. S. The mammalian epigenome. Cell 128, 669–681 (2007). Kouzarides, T. Chromatin modifications and their function. Cell 128, 693–705 (2007). Buck, M. J. & Lieb, J. D. ChIP-chip: considerations for the design, analysis, and application of genome-wide chromatin immunoprecipitation experiments. Genomics 83, 349–360 (2004). Mockler, T. C. et al. Applications of DNA tiling arrays for whole-genome analysis. Genomics 85, 1–15 (2005). Roh, T. Y., Cuddapah, S. & Zhao, K. Active chromatin domains are defined by acetylation islands revealed by genome-wide mapping. Genes Dev. 19, 542–552 (2005). Service, R. F. Gene sequencing. The race for the $1000 genome. Science 311, 1544–1546 (2006). Conti, L. et al. Niche-independent symmetrical self-renewal of a mammalian tissue stem cell. PLoS Biol. 3, e283 (2005). Bernstein, B. E. et al. A bivalent chromatin structure marks key developmental genes in embryonic stem cells. Cell 125, 315–326 (2006). Ringrose, L. & Paro, R. Epigenetic regulation of cellular memory by the Polycomb and Trithorax group proteins. Annu. Rev. Genet. 38, 413–443 (2004). Schuettengruber, B., Chourrout, D., Vervoort, M., Leblanc, B. & Cavalli, G. Genome regulation by polycomb and trithorax proteins. Cell 128, 735–745 (2007). Azuara, V. et al. Chromatin signatures of pluripotent cell lines. Nature Cell Biol. 8, 532–538 (2006). Saxonov, S., Berg, P. & Brutlag, D. L. A genome-wide analysis of CpG dinucleotides in the human genome distinguishes two distinct classes of promoters. Proc. Natl Acad. Sci. USA 103, 1412–1417 (2006). Weber, M. et al. Distribution, silencing potential and evolutionary impact of promoter DNA methylation in the human genome. Nature Genet. 39, 457–466 (2007). Bernstein, B. E. et al. Genomic maps and comparative analysis of histone modifications in human and mouse. Cell 120, 169–181 (2005). Kim, T. H. et al. A high-resolution map of active promoters in the human genome. Nature 436, 876–880 (2005). Boyer, L. A. et al. Polycomb complexes repress developmental regulators in murine embryonic stem cells. Nature 441, 349–353 (2006). Lee, T. I. et al. Control of developmental regulators by polycomb in human embryonic stem cells. Cell 125, 301–313 (2006). Squazzo, S. L. et al. Suz12 binds to silenced regions of the genome in a cell-typespecific manner. Genome Res. 16, 890–900 (2006). Pasini, D., Bracken, A. P., Hansen, J. B., Capillo, M. & Helin, K. The Polycomb Group protein Suz12 is required for Embryonic Stem Cell differentiation. Mol. Cell. Biol. 27, 3769–3779 (2007). Klose, R. J. & Bird, A. P. Genomic DNA methylation: the mark and its mediators. Trends Biochem. Sci. 31, 89–97 (2006).
559 ©2007 Nature Publishing Group
ARTICLES
NATURE | Vol 448 | 2 August 2007
22. Wang, X., Su, H. & Bradley, A. Molecular mechanisms governing Pcdh-c gene expression: evidence for a multiple promoter and cis-alternative splicing model. Genes Dev. 16, 1890–1905 (2002). 23. Carninci, P. et al. The transcriptional landscape of the mammalian genome. Science 309, 1559–1563 (2005). 24. Alexander, D. L., Ganem, L. G., Fernandez-Salguero, P., Gonzalez, F. & Jefcoate, C. R. Aryl-hydrocarbon receptor is an inhibitory regulator of lipid synthesis and of commitment to adipogenesis. J. Cell Sci. 111, 3311–3322 (1998). 25. Lengner, C. J. et al. Primary mouse embryonic fibroblasts: a model of mesenchymal cartilage formation. J. Cell. Physiol. 200, 327–333 (2004). 26. Garreta, E., Genove, E., Borros, S. & Semino, C. E. Osteogenic differentiation of mouse embryonic stem cells and mouse embryonic fibroblasts in a threedimensional self-assembling peptide scaffold. Tissue Eng. 12, 2215–2227 (2006). 27. Doetsch, F. The glial identity of neural stem cells. Nature Neurosci. 6, 1127–1134 (2003). 28. Krichevsky, A. M., Sonntag, K. C., Isacson, O. & Kosik, K. S. Specific microRNAs modulate embryonic stem cell-derived neurogenesis. Stem Cells 24, 857–864 (2006). 29. Rao, B., Shibata, Y., Strahl, B. D. & Lieb, J. D. Dimethylation of histone H3 at lysine 36 demarcates regulatory and nonregulatory chromatin genome-wide. Mol. Cell. Biol. 25, 9447–9459 (2005). 30. Bannister, A. J. et al. Spatial distribution of di- and tri-methyl lysine 36 of histone H3 at active genes. J. Biol. Chem. 280, 17732–17736 (2005). 31. Kim, A., Kiefer, C. M. & Dean, A. Distinctive signatures of histone methylation in transcribed coding and noncoding human b-globin sequences. Mol. Cell. Biol. 27, 1271–1279 (2007). 32. Vakoc, C. R., Sachdeva, M. M., Wang, H. & Blobel, G. A. Profile of histone lysine methylation across transcribed mammalian chromatin. Mol. Cell. Biol. 26, 9185–9195 (2006). 33. Li, B., Carey, M. & Workman, J. L. The role of chromatin during transcription. Cell 128, 707–719 (2007). 34. Fantes, J. et al. Mutations in SOX2 cause anophthalmia. Nature Genet. 33, 461–463 (2003). 35. Hutchinson, J. N. et al. A screen for nuclear transcripts identifies two linked noncoding RNAs associated with SC35 splicing domains. BMC Genomics 8, 39 (2007). 36. Seitz, H. et al. A large imprinted microRNA gene cluster at the mouse Dlk1-Gtl2 domain. Genome Res. 14, 1741–1748 (2004). 37. Cullen, B. R. Transcription and processing of human microRNA precursors. Mol. Cell 16, 861–865 (2004). 38. Zaratiegui, M., Irvine, D. V. & Martienssen, R. A. Noncoding RNAs and gene silencing. Cell 128, 763–776 (2007).
39. Verdel, A. & Moazed, D. RNAi-directed assembly of heterochromatin in fission yeast. FEBS Lett. 579, 5872–5878 (2005). 40. Martens, J. H. et al. The profile of repeat-associated histone lysine methylation states in the mouse epigenome. EMBO J. 24, 800–812 (2005). 41. Baust, C. et al. Structure and expression of mobile ETnII retroelements and their coding-competent MusD relatives in the mouse. J. Virol. 77, 11448–11458 (2003). 42. Svoboda, P. et al. RNAi and expression of retrotransposons MuERV-L and IAP in preimplantation mouse embryos. Dev. Biol. 269, 276–285 (2004). 43. Cho, D. H. et al. Antisense transcription and heterochromatin at the DM1 CTG repeats are constrained by CTCF. Mol. Cell 20, 483–489 (2005). 44. Feng, Y. Q. et al. The human b-globin locus control region can silence as well as activate gene expression. Mol. Cell. Biol. 25, 3864–3874 (2005). 45. Edwards, C. A. & Ferguson-Smith, A. C. Mechanisms regulating imprinted genes in clusters. Curr. Opin. Cell Biol. 19, 281–289 (2007). 46. Delaval, K. et al. Differential histone modifications mark mouse imprinting control regions during spermatogenesis. EMBO J. 26, 720–729 (2007). 47. Feil, R. & Berger, F. Convergent evolution of genomic imprinting in plants and mammals. Trends Genet. 23, 192–199 (2007). 48. Strausberg, R. L. et al. Generation and initial analysis of more than 15,000 fulllength human and mouse cDNA sequences. Proc. Natl Acad. Sci. USA 99, 16899–16903 (2002).
Supplementary Information is linked to the online version of the paper at www.nature.com/nature. Acknowledgements We thank S. Fisher, M. Kellis, B. Birren and M. Zody for technical assistance and constructive discussions. We acknowledge L. Zagachin in the MGH Nucleic Acid Quantitation core for assistance with real-time PCR. E.M. was supported by an institutional training grant from NIH. M.W. was supported by fellowships from the Human Frontiers Science Organization Program and the Ellison Foundation. This research was supported by funds from the National Human Genome Research Institute, the National Cancer Institute, the Burroughs Wellcome Fund, Massachusetts General Hospital, and the Broad Institute of MIT and Harvard. Author Information All analysed data sets can be obtained from http:// www.broad.mit.edu/seq_platform/chip/. Microarray data have been submitted to the GEO repository under accession number GSE8024. Reprints and permissions information is available at www.nature.com/reprints. The authors declare no competing financial interests. Correspondence and requests for materials should be addressed to E.S.L. (
[email protected]) or B.E.B. (
[email protected]).
560 ©2007 Nature Publishing Group
doi:10.1038/nature06008
METHODS Cell culture. V6.5 murine ES cells (genotype 129SvJae 3 C57BL/6; male; passages 10–15) and hybrid murine ES cells (genotype 129SvJae 3 M. m. castaneus F1; male; passages 4–6) were cultivated in 5% CO2 at 37 uC on irradiated MEFs in DMEM containing 15% FCS, leukaemia-inhibiting factor, penicillin/ streptomycin, L-glutamine, nonessential amino acids and 2-mercaptoethanol. Cells were subjected to at least two to three passages on 0.2% gelatin under feeder-free conditions to exclude feeder contamination. V6.5 ES cells were differentiated into neural progenitor cells (NPCs) through embryoid body formation for 4 days and selection in ITSFn media for 5–7 days, and maintained in FGF2 and EGF2 (R&D Systems) as described8. The cells uniformly express nestin and Sox2 and can differentiate into neurons, astrocytes and oligodendrocytes. Mouse embryonic fibroblasts (genotype 129SvJae 3 C57BL/6; male; E13.5; passages 4–6), were grown in DMEM with 10% fetal bovine serum and penicillin/ streptomycin at 37u, 5% CO2. Chromatin immunoprecipitation. ChIP experiments were carried out as described previously15 and at http://www.upstate.com. Briefly, chromatin from fixed cells was fragmented to a size range of 200–700 bases with a Branson 250 Sonifier or a Diagenode Bioruptor. Solubilized chromatin was immunoprecipitated with antibody against H3K4me3 (Abcam 8580), H3K9me3 (Abcam 8898), H3K27me3 (Upstate 07-449), H3K36me3 (Abcam 9050), H4K20me3 (Upstate 07-463), pan-H3 (Abcam 1791) or RNA polymerase II (Covance MMS-126R). Antibody–chromatin complexes were pulled-down using protein A-sepharose (or anti-IgM-conjugated agarose for RNA polymerase II), washed and then eluted. After cross-link reversal and proteinase K treatment, immunoprecipitated DNA was extracted with phenol-chloroform, ethanol precipitated, and treated with RNase. ChIP DNA was quantified using PicoGreen. Library preparation and Solexa sequencing. One to ten nanograms of ChIP DNA (or unenriched whole-cell extract) were prepared for Solexa sequencing as follows: DNA fragments were repaired to blunt ends by T4 DNA polymerase and phosphorylated with T4 polynucleotide kinase using the END-IT kit (Epicentre). Then, a single ‘A’ base was added to 39 ends with Klenow (39R59 exo2, 0.3 U ml21). Double-stranded Solexa adaptors (75 bp with a ‘T’ overhang) were ligated to the fragments with DNA ligase (0.05 U ml21). Ligation products between 275 and 700 bp were gel purified on 2% agarose to remove unligated adaptors, and subjected to 18 PCR cycles. Completed libraries were quantified with PicoGreen. DNA sequencing was carried out using the Illumina/Solexa Genome Analyzer sequencing system. Cluster amplification, linearization, blocking and sequencing primer reagents were provided in the Solexa Cluster Amplification kits and were used according to the manufacturer’s specifications as described here. To obtain single strand templates, the sample preparation was first denatured in NaOH (0.1 N final concentration) and diluted in Solexa hybridization buffer (4 uC) to a final concentration of either 2 or 4 pM. Sample loading was carried out as follows. A template sample was loaded into each lane of a Solexa flowcell mounted on a Solexa cluster station on which all subsequent steps were performed. The temperature was increased to 95 uC for 1 min and slowly decreased to 40 uC to allow for annealing onto complementary adaptor oligonucleotides on the flowcell surface. Cluster formation was then carried out as follows. The template strands were extended with Taq polymerase (0.25 U ml21) to generate a fixed copy of the template on the flowcell. The samples were then denatured with formamide (Sigma-Aldrich, F-5786, .99.5% (GC)) and washed (Solexa Wash buffer) to remove the original captured template, leaving behind a single-stranded template ready for amplification. Clusters were then amplified under isothermal conditions (60 uC) for 30 cycles using Solexa amplification mix containing BstI DNA polymerase (0.08 U ml21). After each amplification cycle, the templates were denatured with formamide (as above). Fresh amplification mix was added after each denaturation step. After amplification, the clusters were linearized with Solexa linearization mix, and any unextended flowcell surface capture oligonucleotides were blocked with ddNTPs (2.4 mM mix in the presence of 0.25 U ml21 terminal transferase). The linearized clusters were then denatured (0.1 N NaOH) to remove and wash away the linearized strands. The single-stranded templates in the cluster were then annealed with the Solexa sequencing primer (10 mM). The flowcells were removed from the cluster station and then transferred onto the 1G Genetic Analyser which performed the sequencing according to its own standard protocols. We followed the protocol without any modifications. Read alignment and generation of density maps and modified intervals. Sequence reads from each ChIP library are compiled, post-processed and aligned to the reference genome sequence using a general purpose computational pipeline. We first pre-compute a table that associates each possible 12-mer with all of its occurrences in the reference genome. Then, for each SMS read, we scan both it and its reverse complement, and for each of its constituent 12-mers, we find each
potential start point on the reference genome, and then compute the number of mismatches in the corresponding alignment. These computations are dynamically terminated so that only ‘unique’ alignments are reported, according to the following rule: if an alignment A has only x mismatches, and if there is no alternative alignment having #x 1 2 mismatches, then we call A unique. To minimize the risk of amplification bias, only one read was kept if multiple reads aligned to the same start point. For each ChIP (or control) experiment, we next estimate the number of endsequenced ChIP fragments that overlap any given nucleotide position in the reference genome (here, at 25-bp resolution). For each position, we count the number of aligned reads that are oriented towards it and closer than the average length of a library fragment (,300 bp). To identify the portion of the mouse genome that can be interrogated with SMS reads of a given length (k) and alignment stringency, we aligned every k-mer that occurs in the reference sequence (mm8) using the same pipeline as for SMS reads. Nucleotide positions in the reference genome where less than 50% of the 200 flanking k-mers on each side had ‘unique’ alignments were masked as repetitive and disregarded from further analysis (,28% of the genome). Although we analysed reads spanning 27–36 bp, all data were conservatively masked at k 5 27. We identified genomic intervals enriched with a specific chromatin mark from the mean fragment count in 1-kb sliding windows. To account for varying read numbers and lengths, we generated sample-specific expected distributions of fragment counts under the null hypothesis of no enrichment by moving each aligned read to a randomly chosen ‘unique’ position on the same chromosome. Nominal P-values for enrichment at a particular position were obtained by comparison to a randomized version of the same data set (due to the large number of reads, multiple randomizations gave identical results). Genome-wide maps of enriched sites were created by identification of windows where the nominal P-value fell below 1025, and merging any enriched windows that were less than 1-kb apart into continuous intervals. To improve sensitivity to the more diffuse enrichment observed from H3K9me3 and H4K20me3 near repetitive regions and from H3K36me3 across large transcripts, we also developed a Hidden Markov Model (HMM) to segment the reference genome into ‘enriched’ and ‘unenriched’ intervals (R.P.K., manuscript in preparation). The observed fragment densities were divided into four categories, in a sample-dependent manner (‘masked’, ‘sub-threshold’, ‘near-threshold’ and ‘above threshold’). Emission and transition probabilities were fitted using supervised learning on limited intervals (,10 Mb total) chosen to reflect diverse chromatin landscapes, and the resultant models were applied genome wide. Validation of ChIP-Seq by comparison to ChIP-chip and real-time PCR. ChIP-Seq data for H3K4me3 and H3K27me3 in ES cells were compared to published ChIP-chip profiles across ,2% of the mouse genome9. Significantly enriched sites in the ChIP-chip data were defined using a previously validated P-value threshold of 1024, and compared to the ChIP-Seq sites. In addition, a set of 50 PCR primer pairs (Supplementary Table 2) was designed to amplify 100– 140-bp fragments from genomic regions showing a wide range of signals for H3K4me3 and H3K27me3 by ChIP-Seq. Real-time PCR was carried out using Quantitect SYBR green PCR mix (Qiagen) on a 7000 ABI detection system, using 0.25 ng ChIP or WCE DNA as template. Fold enrichments reflect two independent ChIP assays, each evaluated in duplicate by real-time PCR. Promoter classification and definition of gene and transcript intervals. The analysed promoters were based on transcription start sites inferred from fulllength mouse RefSeqs (downloaded from the UCSC Genome Brower 2 April 2007). Promoters containing a 500-bp interval within 20.5 kb to 12 kb with a (G1C)-fraction $0.55 and a CpG observed to expected ratio (O/E) $0.6 were classified as HCPs. Promoters containing no 500-bp interval with CpG O/E $0.4 were classified as LCPs. The remainder were classified as ICPs. The chromatin states of promoters were determined by overlap with cell-type-specific H3K4me3 and H3K27me3 intervals. For comparison with expression levels, the chromatin states of genes with more than one known promoter were classified according to the most ‘active’ mark (that is, a gene with an H3K4me3 marked promoter and a bivalent promoter would be classified as ‘H3K4me3’). Correlation between H3K4me3 enrichment and expression levels was calculated from the mean fragment density over each promoter from 20.5 kb to 11 kb. Correlation between H3K36me3 and expression levels was calculated from the mean fragment density over each RefSeq transcript. Expression data. RNA expression data for ES cells, NPCs and MEFs were generated from polyA RNA using GeneChip Mouse Genome 430 2.0 Arrays (Affymetrix). Expression data for adult tissues were downloaded from the Novartis Gene Expression Atlas at http://symatlas.gnf.org. Pre-processing, normalization (GC-RMA) and hierarchical clustering (Pearson, log-transformed, row-centred values) were performed using GenePattern (http://www.broad. mit.edu/cancer/software/).
©2007 Nature Publishing Group
doi:10.1038/nature06008
Analysis of repetitive elements. Chromatin state at repetitive elements was evaluated by aligning SMS reads directly to a library of repetitive element consensus sequences (http://www.girinst.org). The proportion of reads aligning to each class was calculated for H3K9me3 and H4K20me3, and enrichment determined by comparison to WCE and pan-H3. We also applied an orthogonal approach based on HMM intervals of H3K9me3 in unique sequences (see above). For each repetitive element type or class, we calculated the number of occurrences within 1 kb of a unique H3K9me3 site, controlling against a set of randomly placed sites of the same length distribution. Allele-specific histone methylation. SNPs between the 129S1/SvlmJ (used as proxy for 129SvJae) and M. m. castaneus mouse strains were obtained from Perlegen at http://mouse.perlegen.com. Allele-specific bias was evaluated by a binomial test of the null hypothesis that ChIP fragments were drawn uniformly from both alleles. (H3K4me3 and H3K9me3 reads were pooled before the test, see Supplementary Table 7.) We note that the 129SvJae strain is closer to the C57BL/6-derived reference genome, and this may cause a slight bias towards assigning aligned reads to this strain. To minimize this bias, aligned reads were kept for analysis if no alternative alignment had the same number of mismatches to the reference sequence.
©2007 Nature Publishing Group