Vol 450 | 8 November 2007 | doi:10.1038/nature06340
ARTICLES Discovery of functional elements in 12 Drosophila genomes using evolutionary signatures Alexander Stark1,2*, Michael F. Lin1,2*, Pouya Kheradpour2*, Jakob S. Pedersen3,4*, Leopold Parts5,6, Joseph W. Carlson7, Madeline A. Crosby8, Matthew D. Rasmussen2, Sushmita Roy9, Ameya N. Deoras2, J. Graham Ruby10,11, Julius Brennecke12, Harvard FlyBase curators{, Berkeley Drosophila Genome Project{, Emily Hodges12, Angie S. Hinrichs4, Anat Caspi13, Benedict Paten4,5,14, Seung-Won Park15, Mira V. Han16, Morgan L. Maeder17, Benjamin J. Polansky17, Bryanne E. Robson17, Stein Aerts18,19, Jacques van Helden20, Bassem Hassan18,19, Donald G. Gilbert21, Deborah A. Eastman17, Michael Rice22, Michael Weir23, Matthew W. Hahn16, Yongkyu Park15, Colin N. Dewey24, Lior Pachter25,26, W. James Kent4, David Haussler4, Eric C. Lai27, David P. Bartel10,11, Gregory J. Hannon12, Thomas C. Kaufman21, Michael B. Eisen28,29, Andrew G. Clark30, Douglas Smith31, Susan E. Celniker7, William M. Gelbart8,32 & Manolis Kellis1,2 Sequencing of multiple related species followed by comparative genomics analysis constitutes a powerful approach for the systematic understanding of any genome. Here, we use the genomes of 12 Drosophila species for the de novo discovery of functional elements in the fly. Each type of functional element shows characteristic patterns of change, or ‘evolutionary signatures’, dictated by its precise selective constraints. Such signatures enable recognition of new protein-coding genes and exons, spurious and incorrect gene annotations, and numerous unusual gene structures, including abundant stop-codon readthrough. Similarly, we predict non-protein-coding RNA genes and structures, and new microRNA (miRNA) genes. We provide evidence of miRNA processing and functionality from both hairpin arms and both DNA strands. We identify several classes of pre- and post-transcriptional regulatory motifs, and predict individual motif instances with high confidence. We also study how discovery power scales with the divergence and number of species compared, and we provide general guidelines for comparative studies. The sequencing of the human genome and the genomes of dozens of other metazoan species has intensified the need for systematic methods to extract biological information directly from DNA sequence. Comparative genomics has emerged as a powerful methodology for this endeavour1,2. Comparison of few (two–four) closely related genomes has proven successful for the discovery of protein-coding genes3–5, RNA genes6,7, miRNA genes8–11 and catalogues of regulatory elements3,4,12–14. The resolution and discovery power of these studies
should increase with the number of genomes15–20, in principle enabling the systematic discovery of all conserved functional elements. The fruitfly Drosophila melanogaster is an ideal system for developing and evaluating comparative genomics methodologies. Over the past century, Drosophila has been a pioneering model in which many of the basic principles governing animal development and population biology were established21. In the past decade, the genome sequence of D. melanogaster provided one of the first systematic views
1 The Broad Institute, Massachusetts Institute of Technology and Harvard University, Cambridge, Massachusetts 02140, USA. 2Computer Science and Artificial Intelligence Laboratory, MIT, Cambridge, Massachusetts 02139, USA. 3The Bioinformatics Centre, Department of Molecular Biology, University of Copenhagen, Ole Maaloes Vej 5, 2200 Copenhagen N, Denmark. 4Center for Biomolecular Science and Engineering, University of California, Santa Cruz, California 95064, USA. 5Wellcome Trust Sanger Institute, Wellcome Trust Genome Campus, Hinxton, Cambridge CB10 1SA, UK. 6Institute of Computer Science, University of Tartu, Estonia. 7BDGP, LBNL, 1 Cyclotron Road MS 64-0119, Berkeley, California 94720, USA. 8FlyBase, The Biological Laboratories, Harvard University, 16 Divinity Avenue, Cambridge, Massachusetts 02138, USA. 9Department of Computer Science, University of New Mexico, Albuquerque, New Mexico 87131, USA. 10Department of Biology, MIT, Cambridge, Massachusetts 02139, USA. 11Whitehead Institute, Cambridge, Massachusetts 02142, USA. 12Cold Spring Harbor Laboratory, Watson School of Biological Sciences, 1 Bungtown Road, Cold Spring Harbor, New York 11724, USA. 13University of California, San Francisco/University of California, Berkeley Joint Graduate Group in Bioengineering, Berkeley, California 97210, USA. 14EMBL Nucleotide Sequence Submissions, European Bioinformatics Institute, Wellcome Trust Genome Campus, Hinxton, Cambridge CB10 1SD, UK. 15Department of Cell Biology and Molecular Medicine, G-629, MSB, 185 South Orange Avenue, UMDNJ-New Jersey Medical School, Newark, New Jersey 07103, USA. 16Department of Biology and School of Informatics, Indiana University, Indiana 47405, USA. 17Department of Biology, Connecticut College, New London, Connecticut 06320, USA. 18Laboratory of Neurogenetics, Department of Molecular and Developmental Genetics, VIB, 3000 Leuven, Belgium. 19Department of Human Genetics, K. U. Leuven School of Medicine, 3000 Leuven, Belgium. 20Department de Biologie Moleculaire, Universite Libre de Bruxelles, 1050 Brussels, Belgium. 21Department of Biology, Indiana University, Bloomington, Indiana 47405, USA. 22Department of Mathematics and Computer Science, Wesleyan University, Middletown, Connecticut 06459, USA. 23Biology Department, Wesleyan University Middletown, Connecticut 06459, USA. 24Department of Biostatistics and Medical Informatics, University of Wisconsin-Madison, Madison, Wisconsin 53706, USA. 25Department of Mathematics, University of California at Berkeley, Berkeley, California 94720, USA. 26 Department of Computer Science, University of California at Berkeley, Berkeley, California 94720, USA. 27Department of Developmental Biology, Memorial Sloan-Kettering Cancer Center, New York, New York 10021, USA. 28Graduate Group in Biophysics, Department of Molecular and Cell Biology, and Center for Integrative Genomics, University of California, Berkeley, California 94720, USA. 29Lawrence Berkeley National Laboratory, Life Sciences Division, Berkeley, California 94720, USA. 30Department of Molecular Biology and Genetics, Cornell University, Ithaca, New York 14853, USA. 31Agencourt Bioscience Corporation, 500 Cummings Center, Suite 2450, Beverly, Massachusetts 01915, USA. 32The Department of Molecular and Cellular Biology, Harvard University, Cambridge, Massachusetts 02138, USA. *These authors contributed equally to this work. {Lists of participants and affiliations appear at the end of the paper.
219 ©2007 Nature Publishing Group
ARTICLES
NATURE | Vol 450 | 8 November 2007
of a metazoan genome22, and the ongoing effort by the FlyBase and Berkeley Drosophila Genome Project (BDGP) groups established a systematic high-quality genome annotation23–25. Moreover, the fruitfly benefits from extensive experimental resources26–28, which enable novel functional elements to be systematically tested and used in the evaluation of genetic screens29,30. The fly research community has sequenced, assembled and annotated the genomes of 12 Drosophila species22,31,32 at a range of evolutionary distances from D. melanogaster (Fig. 1a, b). The analysis of these genomes was organized around two complementary aims. The first, described in an accompanying paper32, was to understand the evolution of genes and chromosomes on the Drosophila phylogeny, and how it relates to speciation and adaptation. The second goal, described here, was to develop general comparative methodologies to discover and refine functional elements in D. melanogaster using the 12 genomes, and to investigate the scaling of discovery power and its implications for studies in vertebrates (Fig. 1c). Here, we report genome-wide alignments of the 12 species (Supplementary Information 1), and the systematic discovery of euchromatic functional elements in the D. melanogaster genome. We predict and refine thousands of protein-coding exons, RNA genes and structures, miRNAs, pre- and post-transcriptional regulatory motifs and regulatory targets. We validate many of these elements using complementary DNA (cDNA) sequencing, human curation, small RNA sequencing, and correlation with experimentally supported transcription factor and miRNA targets. In addition, our analysis leads to several specific biological findings, listed below. $ We predict 123 novel polycistronic transcripts, 149 genes with apparent stop-codon readthrough and several candidate programmed
D.m o D.w j il
1.5
2.1 2.2
2.3 2.4
ack Tet Fugu rao don Zeb rafi sh Me dak a
1.9
kleb
12 (+D sp. .gri)
Stic
2.3
2.9
3.5
4.2 2 (+pl 0 sp. atyp us)
1.9
1.4
Fro g
ssu Opo
1.3
1.3
1 (+op 9 sp. oss um)
0.1 0.2 0.4 0.5
1.0 1.1
8 (+D sp. .pse )
Flies (multi-species) Mammals
0.8
9 (+D sp. .wil )
0.5
D.v D.gir ri
0.2
m
0.1
Hum D.m Chi an m el R 3 sp B hesup (+D . T ushb s .sim ree ab shr y ) H ew Eleporse 5 sp han . (+D .yak A D t rma og ) dillo Ca Cowt R a Gui n bb Hedea-pi it geh g Shr og Ten ew Mo rec use Rat
Vertebrates (pairwise)
6 (+D sp. .ana )
Flies (pairwise)
0.1 substitutions per site
rd
el D.s D.sim ec
D.m
c
D.e D.y re ak
D. virilis D. grimshawi
Subgenus Drosophila
CG4495
D.mel D.sim D.sec D.yak D.ere D.ana D.pse D.per D.wil D.moj D.vir D.gri
Liza
Subgenus Sophophora
b
D.a na D.p D.per se
melanogaster group
D. melanogaster melanogaster D. simulans subgroup D. sechellia D. yakuba D. erecta D. ananassae D. pseudoobscura D. persimilis D. willistoni D. mojavensis
Pla ty Chi pus cke n
a
frameshifts, with potential roles in regulation, localization and function of the corresponding protein products. $ We make available the first systematic prediction of general RNA genes and structures (non-coding RNAs (ncRNAs)) in Drosophila, including several structures probably involved in translational regulation and adenosine-to-inosine RNA editing (A-to-I editing). $ We present comparative and experimental evidence that some miRNA loci yield multiple functional products, from both hairpin arms or from both DNA strands, thereby increasing the versatility and complexity of miRNA-mediated regulation. $ We provide further comparative evidence for miRNA targeting in protein-coding exons. $ We report an initial network of pre- and post-transcriptional regulatory targets in Drosophila on the basis of individual highconfidence motif occurrences. Comparative genomics and evolutionary signatures. Although multiple closely related genomes provide sufficient neutral divergence for recognition of functional regions in stretches of highly conserved nucleotides16,17,33, measures of nucleotide conservation alone do not distinguish between different types of functional elements. Moreover, functional elements that tolerate abundant ‘silent’ mutations, such as protein-coding exons and many regulatory motifs, might not be detected when searching on the basis of strong nucleotide conservation. Across many genomes spanning larger evolutionary distances, the information in the patterns of sequence change reveals evolutionary signatures (Fig. 2) that can be used for systematic genome annotation. Protein-coding regions show highly constrained codon substitution frequencies34 and insertions and deletions that are heavily
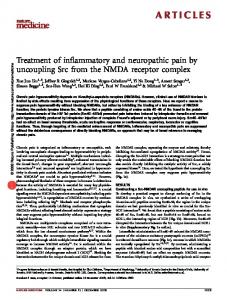
Figure 1 | Phylogeny and alignment of 12 Drosophila species. a, Phylogenetic tree relating the 12 Drosophila species, estimated from fourfold degenerate sites (Supplementary Methods 1). The 12 species span a total branch length of 4.13 substitutions per neutral site. b, Gene order conservation for a 0.45-Mb region of chromosome 2L centred on CG4495, for which we predict a new exon (Fig. 3a), and spanning 35 genes. Colour represents the direction of transcription. Boxes represent full gene models.
1 (+el 8 sp. eph ant)
15 (+dosp. g)
9 (+m sp. ous e)
(+tr 5 sp. ees hrew )
3 (rhe sp. sus )
Hum an
(multi-species)
Individual exons and introns are not shown. c, Comparison of evolutionary distances spanned by fly and vertebrate trees. Pairwise and multi-species distances (in substitutions per fourfold degenerate site) are shown from D. melanogaster and from human as reference genomes. Note that species with longer branches (for example, mouse) show higher pairwise distances, not always reflecting the order of divergence. Multi-species distances include all species within a phylogenetic clade.
220 ©2007 Nature Publishing Group
ARTICLES
NATURE | Vol 450 | 8 November 2007
biased to be multiples of three3 (Fig. 2a). RNA genes and structures tolerate substitutions that preserve base pairing35,36 (Fig. 2b). MicroRNA hairpins show a characteristic conservation profile with high conservation in the stem and mutations in loop regions10,11 (Fig. 2c). Finally, regulatory motifs are marked by high levels of genome-wide conservation3,4,12–14, and post-transcriptional motifs show strand-biased conservation12 (Fig. 2d, e). We find that these signatures can be much more precise for genome annotation than the overall level of nucleotide conservation (for example, Fig. 3a). Revisiting the protein-coding gene catalogue The annotation of protein-coding genes remains difficult in metazoan genomes owing to short exons and complex gene structures G S A A T I Y Y E S M P A S A S T G V L S L T T GGA AGT GCT GCC ACA ATC TAC TAC GAA TCT ATG CCA GCC TCC GCC TCC ACA GGC GTT CTA TCA TTG ACT ACG GGA AGT GCT GCC ACA ATC TAC TAC GAA TCT ATG CCA GCC TCC GCC TCC ACA GGC GTT CTA TCA TTG ACT ACG GGA AGT GCT GCC ACA ATC TAC TAC GAA TCT ATG CCA GCC TCC GCC TCC ACA GGC GTT CTA TCA TTG ACT ACT GGA AGT GCT GCC ACA ATC TAC TAC GAG TCT ATG CCA GCC TCC GCC TCC ACG GGC GTT CTA TCA TTG ACT ACG GGA AGT GCT GCC ACA ATC TAC TAC GAG TCT ATG CCA GCC TCC GCC TCC ACA GGC GTT CTA TCA TTG ACT ACG GGT AGT GCA GCT ACG ATC TAC TAC GAA TCA ATG CCG GCA TCC TCG TCC ACT GGC GTA CTC TCG TTG ACC ACC GGC AGC TCT GCC ACA ATC TAC TAC GAA TCG ATG CCC GCC TCG GCC TCC ACG GGC GTC CTC TCG CTG ACC ACA GGC AGC TCT GCC ACA ATC TAC TAC GAA TCG ATG CCC GCC TCG GCC TCC ACG GGC GTC CTC TCG CTG ACC ACA GGT GGA GCT GCC ACC ATT TAT TAT GAA TCC ATG CCA GCA TCT GCC TCA ACT GGA GTC CTC TCG CTG ACC ACC 6 TCA ACG GGC GTT CTA TCG CTG ACC ACC 3 GGC AGC TCA G-- -CC ATC TAC TAT GAA TCT ATG CCG GC- --- --C GGC AGC TCG G-- -CC ATC TAC TAT GAG TCC ATG CCG GC- --- --C TCG ACG GGG GTG CTC TCG CTG ACC ACC GGC AGC TCG G-- -CC ATC TAT TAC GAG TCG ATG CCG GC- --- --G TCG ACG GGC GTC CTC TCA CTG ACG ACG ** * * * * ** ** ** ** ** ** *** ** ** ** * ** ** ** ** ** ** ** ** **
AAC CGC CTT CCC CCT GGA CTC GTC CCA CTC TCT GCT CCT TCT CCA CCA GCG ATG CAA ACT TTG CGA ATC ACT AGC CGC CTT CCC CCC GGA CTC GTC CCA CTA CCT GCT CCT TCT CCA CCA GCG ATG CAA ACT TTG CGA ATC ACT AGC CGC CTT CCC CCC GGA CTC GCC CCA CTA CCT GCT CCT TCT CCA CCA GCG ATG CAA ACT TTG CGA ATC ACT AGC CGC CTT CCC TCT G-- --- --- --- - 14 CAT GCT CCT TCT CCT CCA GCG ATG CAA ACT TTG CGA ATC ACT AGC CGC CTT CCC CCT GGA CTC GTC CCA CTA CCT GCT CCT GCT CCT CCA ACG ATG CAA ACT TTG CGA ATC ACT GGC CAT CCT CCT CCT GGC AGC -CC CAA CTG CCT CCG TTT TGT CTG TGT GTG TTG GTA ACT TTG CAA ATC ACT GTT CAC GTC CTT TGT GGC CAG TTC TCC TCT CCT TTT CTC TCT CGG TGC GTG TTG GAA ACT TTG CAA ATC ACT GTT CAC GTC CTT TGT GGC CAG TTC TCC TCT CCT TTT CTC TCT CGG TGC GTG TTG GAA ACT TTG CAA ATC ACT ACT CGC CAG CTT TGT GGC CAG ---3 TAG TTC TCT GCT CTT --- --- 7 GT GTG TTG GAA AAC TTG CAA ATC ACT AGC TTA CGT CCA AGT GAG CGT GTG CGT ATA CCT GTT GTG TTG GCT TGC CTG TTG AAA ATT TTT CCC AAC ACT AGC TAA CGT CCA AGT GTG CAT GTG CAT GTA CGT GTG GTG TTT GTA TGT CTG TTG AAA ATT TTG CCC AAC ACT AGC TAA CGT TCA GCT GTG --- --- --- --- --- 17 TGTG TGT GTG TGT TCG TTG AAA ATT TTG CCA AAC ACT * * * ** * * * ** * * * ***
Protein-coding exon
Non-coding region
AA AC G U G U C G A U C G U A G C G C G C U A U G U A 20 G C A A A U C G U A A C U G C G G C A U 10 G G C G C U A U A U A A U G U C G G C 1 5′ 3′ 29
38
47
57
67
1 10 20 29 38 47 57 67 D.mel GCGAUUUGGAGCUCUCAAGUUUGGGUCACUUAAAC-GGGUGACCCAGACAUGAAGGCUGCCAAAUUGC D.sim GCGAUUUGGAGCUCUCAAGUUUGGGUCACUUAAAG-GGGUGACCCAGACAUGAAAGCUGCCAAAUCGC D.sec GCGAUUUGGAGCUCUCAAGUUUGGGUCACUUAAAG-GGGUGACCCAGACAUGAAGGCUGCCAAAUUGC D.yak GCGAUUUGGAGCCCUUAAGUUUGGGUCAUUUAAAG-GGGUGACCCAGACAUGAGGGCUGCCAAGUUGC D.ere GCGAUUUGGAGCCAUUAAGUUUGGGUCAUUUAAAG-GGGUGACCCAGACAUGAGGGCUGCCAAGUUGC D.ana GCGAUUUGGAGCCCUCAAGUUUGGGUCACUUUAAC-GCGUGUCCCAGACAUGAUGGCUGCCAAAUUGC D.pse GCGAUUUGGAGCCCUCAAGUUUGGGUCACUUAAAU-GGGUGACCCAGACAUGAUGGCUACUAGAUC-D.per GCGAUUUGGAGCCCUCAAGUUUGGGUCACUUAAAU-GGGUGACCCAGACAUGAUGGCUACUAGAUC-D.wil GCAAUUUCGAACUAUUAAGUUUGGAUCACUUAAAGCACGUGAUCCAGACAUAAUAGAUCUGAGAUUUU D.moj AACAUUUGG-CCUGUCAAGUCUGCGCCAUUUAAAU-GCGUGGCCCAGACAUGACAAGCUACAAAUGUU D.vir AGCAUUUGG-UUUGCCAAGUCUGUGGCAUUUGAAU-GUAUGUCGCAGACAUGACAAUC-GCAAAUGCU D.gri AGCAUUUGG-UUUGUUAAGUCUGCGUCAUUUCAAU-GUGUGCCGCAGACAUGACAAAUUCCAAAUGUU
((((((((.((((.(((.(((((((((((...... ..))))))))))).))).))))..)))))))) abcdefgh iklm nop qrstuvwxyzA Azyxwvutsrq pon mlki hgfedcba
RNA
c
Codon substitution typical of protein-coding regions L
Frame-preserving gap (length L a multiple of 3)
Characteristic non-coding region events Triplet substitution typical of non-coding regions Nonsense mutation introducing a stop codon L
Frame-shifting gap (length L not a multiple of 3)
No change Conserved paired nucleotide Conserved unpaired nucleotide
Silent changes characteristic of RNA evolution Silent G•U substitution Silent substitution in unpaired base Silent base-preserving double substitution
Changes disruptive of RNA structures Disruptive double substitution Disruptive single substitution Disruptive insertion or deletion
U U C U U A
U
C A A
C
G U G
U
A
U
G
U G U G C U
miRNA
A
A
U U
U U A U G U C G
miRNA*
miRNA
A U U G
G
U U
A A
U
A
U
G
G C G U C
G
A
U
A
U
A
U
A
C
G U
5′
3′
miRNA
d
Characteristic protein-preserving events
D.mel D.sim D.sec D.yak D.ere D.ana D.pse D.per D.wil D.moj D.vir D.gri
D.mel D.sim D.sec D.yak D.ere D.ana D.pse D.per D.wil D.moj D.vir D.gri
miRNA*
GGGGATGTGGGGAAGGATGCTCTTTTCTGACTCTATTTTGTCGGCGAACATGGATCTAGTGCACGGTGG-TTCATGATTAAGTTCGTGACTAGATTTCATGCTCGTCTATTAAGTTGGGTCAGCACA-ACGAAGA----GAGCGGAGCT GGGGATGTGGGGAAGGATGCTCTTTTCTGACTCTATTTTGTCGGCGAACATGGATCTAGTGCACGGTGG-TTCATGATTAAGTTCGTGACTAGATTTCATGCTCGTCTATTAAGTTGGGTCAGCACA-ACGAAGA----GAGCGCAGCT GGGGATGTGGGGAAGGATGCTCTTTTCTGACTCTATTTTGTCGGCGAACATGGATCTAGTGCACGGTGG-TTCATGATTAAGTTCGTGACTAGATTTCATGCTCGTCTATTAAGTTGGGTCAGCACA-ACGAAGA----GAGCGGAGCT GGGGATGTGGGGAAGGATGCTCTTTTCTGACTCTATTTTGTCGGCGAACATGGATCTAGTGCACGGTGG-TTCATGATTAAGTTCGTGACTAGATTTCATGCTCGTCTATTAAGTTGGGTCAGCACT-ACGAAGA----GAG-----CT GGAGAAGTGGGGAAGGATGCTCTTTTCTGACTCTATTTTGTCGGCGAACATGGATCTAGTGCACGGTGG-TTCATGATTAAGTTCGTGACTAGATTTCATGCTCGTCTATTAAGTTGGGTCAGCACT-ACGAAGA----GAG-----CT GAAAAGG----ATTTGGGGTCTTTTTCTGACTCTATTTTGTCGGCGAACATGGATCTAGTGCACGGTGT-TTCATGATTAAGTTCGTGACTAGATTTCATGCTCGTCTATTAAGTTGGGTCAGCACA-CCAAAGAGTCGGATAGTGGAG TCTGATCCGGCAGCGTTTGCTCTTCTCTGACTCTATTTTGTCGGCGAACATGGATCTAGTGCACGGTTG-TTCATGATTAAGTTCGTGACTAGATTTCATGCTCGTCTATTAAGTTGGGTCAACACA-ACGAACCGAAAGAGCAGAGCA TCTGATCCGGCAGCGTTTGCTCTTCTCTGACTCTATTTTGTCGGCGAACATGGATCTAGTGCACGGTTG-TTCATGATTAAGTTCGTGACTAGATTTCATGCTCGTCTATTAAGTTGGGTCAACACA-ACGAACCGAAAGAGCAGAGCA GAGTCCTTTCTATGTGGCAGCGTCTCTTGACTCTATTTTGTCGGCGAACATGGATCTAGTGCACGGTTTGTTCATGATTAAGTTCGTGACTAGATTTCATGCTCGTCTATTAAGTTGGGTCAGCACA-ACAAGAG--CGCAGCGGAGAG ATTTCTTTT-----TTTTGCTCTTCTCTGACTCTATTTTGTCGGCGAACATGGATCTAGTGCACGGTTG-TTCATGATTAAGTTCGTGACTAGATTTCATGCTCGTCTATTAAGTTGGGTCAATACACACA-GCGAAAACATGGCCAAG GTTTCGCTC-----TTTTGCTCTTCTCTGACTCTATTTTGTCGGCGAACATGGATCTAGTGCACGGTTG-TTCATGATTAAGTTCGTGACTAGATTTCATGCTCGTCTATTAAGTTGGGTCAACACACACACACACACACATAAAAGAA ACTGCAACTGCAACTGCTGCTCTTTTCTGACTCTATTTTGTCGGCGAACATGGATCTAGTGCACGGTTG-TTCATGATTAAGTTCGTGACTAGATTTCATGCTCGTCTATTAAGTTGGGTCAACACACA-ACACAAAAAAAAAAGAGGA (((.(((((... .............))))))))))).)))))).))))).)).)))).))))))) ((((( ***************************************************************************************************************************************************** ***************************************************************************************************************************************************** ***************************************************************************************************************************************************** ***************************************************************************************************************************************************** * ******* * ** ************************************************************************************************************************ ********* * *** *** ** ************************************************** ***************************************************************** * *** *** * ** * * * ************************************************** ****************************************************** ******* ** * *** ** ******* ****************************************** ****************************************************** ******* ** * * ******* ****************************************** ****************************************************** **** ** * * * ** ****************************************** ***************************************************** *** ** * * * **************************************** **************************************************** **
GATTAGT------TCATCATTTATTAT---T------ATT---AATTAATGGCGTT-----------TCGCAGC-GGCTGG-C-----------------------TGTTTATTATTAACCATTATTT------A-ACA----CC GATTAGT------TCATCATTTATTAT---T------ATT---AATTAATGGCGTT-----------TCGCAGC--GCTGG-C-----------------------TGTTTATTATTAACCATTATTT------A-ACA----CC GATTAGT------TCATCATTTATTAT---T------ATT---AATTAATGGCGTT-----------TCGCAGC--GCTGG-C-----------------------TTTTTATTATTAACCATTATTT------A-ATA----CC GATTAGT------TCATCATTTATTAT---T------ATT---AATTAATGGCGTT-----------TCGCAGC--GCTGG-CTG---------------------TGTTTATTATTTATCATTATTA------A-ACA----CC GATTAGT------TCATCGTTTATTAT---T------ATC---AATTAATGGCGTT-----------TCGCAGC--GGTGG-C-----------------------TGTTTATTATTAACCATTACTA------A-ACA----CC GATTTGT------TCATCATTTATTAT---T------------AATTAATGGTATT-----------TCTTGACTGGCTGC-CTGCC---TGCCTGTTA--TTTGTTGTTTATTATTAAGCATTATTA------A-ACA----CA GATATGC------TCATCATTTATTAT---T------GAT---AATTAATGGAACTTTGGTCAGTT-TTGCTGCCTGCCTG-TTGCCTGCTGCCTGTTGCTTTTGCTGTTTATTATTAACTATTATTG------A-GCAGCGCCA GATATGC------TCCCCATTTTTTCT---T------GAT---AATTAATGGAAATTTGGTCACTTATTACTGCCTGCCGG-T-------CACCTCTCGCTTCTGCTGTTTATTATTAACTATTATTG------A-GCAGCGCCA GATTAGT------TCATCATTTATTAT---TATTTATATT---AATTAATGAAGTTT----------TCGTTTC------G-T-----------------------TTCGTATGGTT-----TCGTTT------G-ATG-----GATTAGTCGTTCATCAATATTAATTATGTAT------ATAATTAATTAATGAAGTT-----------TT----C--GCTTTAT-----------------------CGTTTATCGACAGCTATTTTTAAT----A-ACA----AC GATTAGTTGATCATCATCATTAATTAT---T------ATA---AATTAATGAAGTT--------------------GCGTT-T-----------------------CGTTTATCGACAGCTATTTTTAAT----A-ACA----AC GATTAGTTGCTCATCATCATTAATTATGAGT------ATT---AATTAATGAAGTT-----------T--------GCTCT-T-----------------------CGCTCACCGATAGCTATTTTTAATACCAA-ACA----AC
Regulatory motifs
Mef2 (BLS=0.25)
Mef2: YTAWWWWTAR
Mef2 (BLS=0.83)
e
1
200 160
Confidence
0.6
120 80
0.4
Known motifs
0.2
40 0
0.8
Random motifs
0
20
40
60
80
Confidence level
b
D.mel D.sim D.sec D.yak D.ere D.ana D.pse D.per D.wil D.moj D.vir D.gri
Number of conserved instances
a
with abundant alternative splicing. Comparative information has improved computational gene predictors5, but their accuracy still falls far short of well-studied gene catalogues such as the FlyBase annotation, which combines computational gene prediction37, high-throughput experimental data38–42 and extensive manual curation23. Recognizing this, we set out not only to produce an independent computational annotation of protein-coding genes in the fly genome, but also to assess and refine its already high-quality annotations43. Our analyses of D. melanogaster coding genes are based on two independent evolutionary signatures unique to protein-coding regions (Fig. 2a): (1) reading frame conservation (RFC)3, which observes the tendency of nucleotide insertions and deletions to preserve the codon reading frame; and (2) codon substitution frequencies
0 100
BLS (% of tree)
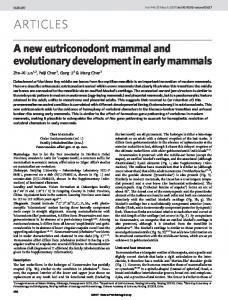
Figure 2 | Distinct evolutionary signatures for diverse classes of functional elements. a, Protein-coding genes tolerate mutations that preserve the amino-acid translation, leading to abundant conservative codon substitutions (green). Insertions and deletions are largely constrained to be a multiple of three (grey). In contrast, non-coding regions show abundant non-conservative triplet substitutions (red), nonsense mutations (blue) and frame-shifting insertions and deletions (orange). b, RNA genes tolerate mutations that preserve the secondary structure (for example, single substitutions involving G . U base pairs and compensatory changes) and exclude structure-disrupting mutations. Matching parentheses and matching letters of the alphabet indicate paired bases. c, MicroRNA genes, in
contrast, generally do not show changes in stem regions, but tolerate substitutions in loop regions and flanking unpaired regions, leading to a distinctive conservation profile. Asterisks denote the number of informant species matching the melanogaster sequence at each position. d, Regulatory motifs tolerate local movement and nucleotide substitutions consistent with their degeneracy patterns, and show increased conservation across the phylogenetic tree, measured as the branch length score (BLS; Supplementary Methods 5a). e, Increasing BLS thresholds select for instances of known motifs (black) at increasing confidence (red), as the number of conserved instances of control motifs (grey) drops significantly faster. 221
©2007 Nature Publishing Group
ARTICLES
NATURE | Vol 450 | 8 November 2007
7183K
7184K
7185K
7186K
7187K
b
7188K
Chr 2L Predicted exons Protein-coding evolutionary signal CG4496
FlyBase genes
CG4495
414 rejected genes
29% 222
Removed from FlyBase protein-coding genes
73 Flagged as uncertain
119 No action
81% 928 predicted new exons
c
Conservation
19%
562 192 174 Modify existing annotation New gene No action
CG4495
(see panel a)
LD46238
Known splice form New exon (see panel c)
d
71%
FlyBase curation
a
Low conservation High protein-coding signal
High conservation No protein-coding signal
Inverse PCR primers
IP17639
cDNA validation
CG8092 A V A A A E Q Q H Y H A Q H H H H P Q X Y K P H G K L K S R D Y T L H W Q N Y X GCA GTC GCT GCC GCC GAG CAG CAG CAC TAT CAC GCC CAG CaC CAT CAC CAT cCG CaA TGA TAC AAG CCC CAC GGA AAG CTC AAA TCA CGC GAC TAT ACC CTT CAC TGG CAG AAC TAT TAG TTA AAG TTC ATT CAT ATT CaT CGC ACA TTG GCC ATA TCC CGA
Protein-coding evolution
e
Stop
Continued protein-coding evolution
Stop
Non-coding evolution Codon substitutions
CG14047 D
Y
F
N
N
Q
Q
R
E
R
H
Y
Q
L
R
+1 P P R F V P P P P P P R R L L L T Q T GAC TAT TTC AAC AAT CAG CAG CGC GAG CGA CAC TAC CAG CTC CGG CGG CAG AGC CAG CGG CAG A CCT CCG AGA TTT GTA CCG CCG CCA CCG CCT CCG CGT CGC TTG CTC CTC ACG CAG ACC A A A A G G G G G G G
Protein-coding evolution (frame 1)
R
Q
S
Q
R
Conservative substitution Disruptive substitution
Q
Protein-coding evolution (frame 2)
Frameshift
Gaps Frame-preserving (multiple of 3) Frame-shifting (not a multiple of 3)
Exon boundaries Stop codon
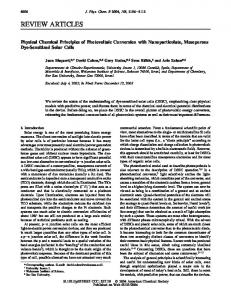
Figure 3 | Revisiting the protein-coding gene catalogue and revealing unusual gene structures. a, Protein-coding evolutionary signatures correlate with annotated protein-coding exons more precisely than the overall conservation level (phastCons track33), for example excluding highly conserved yet non-coding elements. Asterisk denotes new predicted exon, which we validate with cDNA sequencing (see panel c). The height of the black tracks indicates protein-coding potential according to evolutionary signatures (top) and overall sequence conservation (bottom). Blue and green boxes indicate predicted coding exons (top) and the current FlyBase annotation (bottom). The region shown represents the central 6 kb of Fig. 1b,
rendered by the UCSC genome browser126. b, Results of FlyBase curation of 414 genes rejected by evolutionary signatures (Table 1), and 928 predicted new exons. c, Experimental validation of predicted new exon from panel a. Inverse PCR with primers in the predicted exon (green) results in a fulllength cDNA clone, confirming the predicted exon and revealing a new alternative splice form for CG4495. d, Protein-coding evolution continues downstream of a conserved stop codon in 149 genes, suggesting translational readthrough. e, Codon-based evolutionary signatures (CSF score) abruptly shift from one reading frame to another within a protein-coding exon, suggesting a conserved, ‘programmed’ frameshift.
(CSF, see Supplementary Methods 2a), which observes mutational biases towards synonymous codon substitutions and conservative amino acid changes, similar to the non-synonymous/synonymous substitution ratio KA/KS34 and other methods44–46. Assessing and refining existing gene annotations. We first assessed the 13,733 euchromatic genes in FlyBase47 release 4.3. Using the above measures, we defined tests that ‘confirmed’ genes supported by the evolutionary evidence, ‘rejected’ genes inconsistent with protein-coding selection, or ‘abstained’ for genes that were not aligned or with ambiguous comparative evidence (Supplementary Methods 2a). Of the 4,711 genes with descriptive names, we confirmed 97%, rejected 1% and abstained for 2%, whereas the same criteria applied to 15,000 random non-coding regions $300 nucleotides rejected 99% of candidates and confirmed virtually none (Table 1). Together, these results illustrate the high sensitivity and specificity of our criteria. Applying the same criteria to the 9,022 genes lacking a descriptive name (genes designated only by a CG identifier, referred to hereafter as CGid-only genes), our tests accepted 87%, rejected 5% (414 genes) and abstained for 8%. This provides strong evidence that most CGidonly genes encode proteins, but also suggests that they may be less
constrained20,32 and/or may include incorrect annotations. Indeed, on manual review, 222 (54%) of the 414 rejected CGid-only genes were re-categorized as non-protein-coding or deleted (of which 55 were due to genomically primed clones), 73 (18%) were flagged as being of uncertain quality, and the remaining 119 (29%) were kept unchanged (Fig. 3b). Some of these are probably rapidly evolving protein-coding genes, but others may also prove to be non-proteincoding genes or spurious; in fact, none of these had any functional gene ontology (GO) annotation48. In addition, we proposed specific corrections and adjustments to hundreds of existing transcript models, including translation start site adjustments (Supplementary Fig. 2b), alternative splice boundaries (Supplementary Fig. 2b), recent nonsense mutations (Supplementary Fig. 2c) and alternative translational reading frames43. Identifying new genes and exons. To predict new protein-coding exons, we integrated our metrics into a probabilistic algorithm that determines an optimal segmentation of the genome into proteincoding and non-coding regions (Fig. 3a) on the basis of wholegenome sequence alignments of the 12 fly species (Supplementary
Table 1 | Assessment of FlyBase euchromatic protein-coding gene annotations Regions evaluated
Total
Confirm
Abstain
Reject*
Named genes CGid-only genes Non-coding regions{
4,711 9,022 15,564
4,566 (96.9%) 7,879 (87.3%) 3 (0.0%)
105 (2.2%) 729 (8.1%) 131 (0.8%)
40 (0.8%) 414 (4.6%) 15,430 (99.1%)
* A minority of rejected genes are false rejections; see Fig. 3b and text for details. { Regions $300 nucleotides in length randomly chosen from the non-coding part of the genome (see Supplementary Methods 2a).
222 ©2007 Nature Publishing Group
ARTICLES
NATURE | Vol 450 | 8 November 2007
Methods 2a). Our genome-wide search predicted 1,193 new proteincoding exons, mostly in euchromatic regions annotated as intergenic (43%), intronic (26%), or 59/39 untranslated region (UTR; 23%) in FlyBase annotation release 4.3. We manually reviewed 928 of these predictions according to FlyBase standards23 (Supplementary Methods 2a), leading to 142 new gene models (incorporating 192 predictions) and 438 revised gene models (incorporating 562 predictions) (Fig. 3b). In parallel, we tested 184 predictions (126 intergenic, 58 intronic) by directed cDNA sequencing using inverse polymerase chain reaction (inverse PCR) of circularized full-length clones49–51 (Fig. 3c), which validated 120 targeted predictions (65%) and an additional 42 predictions not directly targeted but contained within the recovered transcripts. Predictions in intergenic regions yielded 88 full-length cDNAs, providing evidence for 50 new genes and modification of 39 gene models. Predictions within introns of existing annotations yielded 32 fulllength cDNAs, of which only 18 (56%) represent new splice variants of the surrounding gene, whereas the remaining 14 revealed nested or interleaved gene structures. This provides additional evidence that such complex gene structures are not rare in Drosophila23. Overall, 83% of the 948 predicted exons that we assessed by manual curation or cDNA sequencing were incorporated into FlyBase, resulting in 150 new genes and modifications to hundreds of existing gene models. Finally, the 245 predictions that we did not assess were in non-coding regions of existing transcript models, or were already included in FlyBase independent of our study. In an independent analysis52, we predicted 98 new genes on the basis of inferred homology to predicted genes in the informant species32, of which 63% matched the above predictions. Discovering unusual features of protein-coding genes. Our analysis also predicted an abundance of unusual protein-coding genes that call for follow-up experimental investigation. First, we found open reading frames with clear protein-coding signatures and conserved start and stop sites on the transcribed strand of annotated UTRs, indicative of polycistronic transcripts23,53,54. These include 73% of 115 annotated dicistronic transcripts and 135 new candidate cistrons of 123 genes (Supplementary Fig. 2b). Second, we predicted that 149 genes undergo stop codon readthrough, with protein-coding selection continuing past a deeply conserved stop codon (Fig. 3d), in some cases for hundreds of amino acids. It is unlikely that these genes are selenoproteins, as they appear to lack SECIS elements a
V E G E C T L I
U G A A G C G G A A G C G U A C A G U C A U A G U A A U C U U U A G G U A A A U C C C G G
M Exon 5
L F G N Intron 4
5′-
L A
CUUUGC A
F
CU U C U U U G C C
Splice
F A A
C G C A
T H
C A G A U C G A G A G
C
S I E
b
G UU A A G C C A 14 U C G 25 G U G G G C 29 U G 10 G 31 C U G G C U G G C 5 A U 36 G C U G C G C 1 A 41 U
that direct selenocysteine recoding55–58. Other mechanisms may instead be at work, such as regulation of ribosomal release factors59, A-to-I editing39,60,61, alternative splicing, or other less-characterized mechanisms62. In fact, these genes are significantly enriched in neuronal proteins (P 5 1024), which frequently undergo A-to-I editing63. Third, we found four genes in which CSF signatures abruptly shift from one reading frame to another in the absence of nearby intron– exon boundaries or insertions and deletions (Fig. 3e). These are suggestive of conserved ‘programmed’ frameshifts64, which are thought to be rare in eukaryotes. Overall, our results affected over 10% of protein-coding genes, and will be available in future releases of FlyBase. They also suggest that several types of unusual protein-coding gene structure may be more prevalent in the fly than previously appreciated. RNA genes and structures Several comparative approaches to RNA gene identification have been developed6,7,65 that recognize their characteristic properties: compensatory double substitutions of paired nucleotides (for example, A .U«C .G), structure-preserving single-nucleotide mutations involving G .U base pairs (G .U«G .C and G .U«A . U), and few nucleotide substitutions disrupting functional base pairs (Fig. 2b). To predict new structures, we applied EvoFold7 in highly conserved segments of the 12 Drosophila species and focused on highstringency candidates with strong support by compensatory changes (Supplementary Methods 4). Our search led to 394 predictions, recovering 68 known RNA structures (primarily transfer RNA genes) in 0.02% of the genome (570-fold enrichment). The novel candidates consisted of 177 structures in intergenic regions (54%), 103 in introns (32%), 36 in 39 UTRs (11%) and 10 in 59 UTRs (3%). In addition, we predicted 200 structures in protein-coding regions (Supplementary Methods 3). Notably, 75% of 39 UTR structures and 80% of 59 UTR structures were predicted on the transcribed strand, suggesting that they are frequently part of the messenger RNA. In contrast, only 47% of intronic structures are on the transcribed strand, suggesting that they are largely independent of the surrounding genes. Known and novel types of RNA genes. Of the 177 predicted intergenic structures, 30 were detected in a tiling-array expression study42. This fraction (17%) is significantly above that for all conserved intergenic regions (12%, P 5 0.007), but lower than that of known C GU C C U G A U 22 14 A U A U A U A U 26 10 A U U G G C G C A U 5 31 A U A Protein translation U A U 1 M R I G U G C G C A U U -3′ U 5′- U U Start
c
18
1
D.mel D.sim D.sec D.yak D.ere D.ana D.pse D.per D.wil D.moj D.vir D.gri
5
10
14
18
25
29 31
36
41
UGGCAGUCGCUGGGCACGAGUUACUGUGCGGUGGCUGUCCA UGGAAGUCGCUGGGCACGAGUUACUGUGCGGUGGCUGUCCA UGGGAGUCGCUGGGCACGAGUUACUGUGCGGUGGCUGUCCA UGGGAGUCGCUGGGCACGAGUUACUGUGCGGCGGCUGU UCA UGGGAGCCGCUGGGCACGAGUUACUGUGCGGCGGCUGU UCA UG-GG GUCGUUGGGCACGAGUUACUGUGCGACGGUCAU -CA UGGGGGUCGCUGGGCACGAGUUACUGUGCGGCGCCUGU UUA UGGGGGUCGCUGGGCACGAGUUACUGUGCGGCGCCUGU UUA UGAUUAAUUCCUGGCACGAGUUACUGUGCGGAAUUCGA UCA UGUUGGCGCCUGGGCACGAGUUACUGUGCGGGCGCAUA ACA UGUUGGCGGCCAGGCACGAGUUACUGUGCGGACGUCUU UCA UGUCUGCGCCUGGGCACGAGUUAAUGUGCGGGCGCCUG GCA (((.(((((((..(((((......))))))))))))..))) abc defghik lmnop ponmlkihgfed cba Intron 2
lodestar
Exon 1
CG6764
S
C U A U U U G G Intron 5 G G UU U CAU CA GGUUUGA -3′
Y
L G FHQ
Exon 5
spineless
Splice
Figure 4 | Novel RNA structures. a, New exonic RNA structure spanning 78 of 90 nucleotides of spineless exon 5. b, New intronic RNA structure in lodestar shows 11 compensatory substitutions and 10 silent G .U substitutions, providing strong evidence of structural selection (colours as in
Fig. 2b). c, New 59 UTR structure that overlaps the translation start site of CG6764, the fly orthologue of yeast ribosomal protein RPL24, suggesting a potential role in translational regulation. a–c, Structure shown corresponds to shaded region in the gene model. 223
©2007 Nature Publishing Group
ARTICLES
NATURE | Vol 450 | 8 November 2007
intergenic ncRNAs (21%), suggesting that these candidates may be of lower abundance, temporally or spatially constrained, or might include false positives. Two predictions were expressed throughout development, one extending the annotation of a previously reported but uncharacterized ncRNA66 and the other probably representing a novel type of ncRNA. The predictions also included nine novel H/ACA-box small nucleolar RNA candidates in introns of ribosomal genes, known to frequently contain small nucleolar RNAs that guide post-transcriptional base modifications of ncRNAs67. Likely A-to-I editing structures. Many of the 48 intronic candidates on the transcribed strand and many of the 200 hairpins in coding sequence are probably involved in A-to-I editing or post-transcriptional regulation (Fig. 4a). Hairpins in coding sequence were associated with 11 of the 157 known editing sites (120-fold enrichment) and both intronic and coding-sequence hairpins showed a strong enrichment for ion-channel genes (6%, P 5 0.007 and 10%, P 5 2 3 10212, respectively), known to be frequent editing targets. Editing is known to occur at multiple sites in the same gene63, and we find an additional 10 hairpins in known editing targets, as well as 40 additional hairpins clustered in 18 genes not previously known to be edited (for example huntingtin68, which harbours four predicted hairpins, more than any other gene). Intronic predictions also showed the highest abundance of compensatory substitutions: for example, Resistant to dieldrin (Fig. 2b) contained a 26-base-pair (bp) intronic hairpin flanked by exons known to be edited69 with a striking 16 compensatory changes, lodestar showed one hairpin with 11 compensatory changes, and Inverted repeat-binding protein showed one hairpin with 10 compensatory substitutions (Fig. 4b). Likely regulatory UTR structures. We predicted 38 structures in 39 UTRs, a density twofold higher than the genomic average, whereas fewer than 10 such examples are currently known70. A considerable fraction of these lies in regulatory genes (14 out of 38; P 5 1024), including several transcriptional regulators (for example, cas, spen and Alh), the tyrosine phosphatase PTP-ER and the translation initiation factor eIF3-S8. This suggests that many regulatory genes may themselves be regulated post-transcriptionally through these structures. 39 UTR structures were also enriched for genes involved in mRNA localization (3 out of 38, P 5 2.7 3 1024), including oo18 RNA-binding protein (orb) and staufen (stau), both of which contain doublestranded RNA-binding domains, are involved in axis specification during oogenesis, and interact with the mRNA of maternal effect protein oskar. The hairpin in orb is known to be important for mRNA transport and localization71, whereas the highly similar stau hairpin has not been previously described to our knowledge. The ten structures found in 59 UTRs probably contain binding sites for factors that regulate translation. For example, the fly homologue of yeast ribosomal protein RPL24 contains a hairpin structure overlapping its start codon (Fig. 4c). This is interesting in light of high conservation upstream of the start codon in yeast ribosomal proteins3,4, and findings that ribosomal proteins bind to their mRNAs and control translation in prokaryotes72,73. Conserved RNA structures in roX2 recruit MSL. In an independent study74, we searched for conserved regions in the non-coding roX1 and roX2 (RNA on the X) genes to gain insights into their function. Both RNAs are components of the MSL (Male-specific lethal) complex and are crucial for dosage compensation in male flies, inducing lysine 16 acetylation of histone H4, leading to upregulation of hundreds of genes on the X chromosome75. We identified several stemloop structures with repeated sequence motifs (for example, GUUNUACG), and found that tandem repeats of one of these were sufficient to recruit MSL complexes to the X chromosome and to induce acetylation of lysine 16 of histone H4. Although this structure could not fully rescue roX-deficient males, our results suggest that it mediates MSL recruitment during roX2-dependent chromatin modification and dosage compensation, illustrating the power of evolutionary evidence for directing experimental studies.
Prediction and characterization of miRNA genes Focusing on specific classes of RNA genes markedly increases the accuracy of RNA gene prediction, reviewed in refs 35, 76 and illustrated here for Drosophila miRNA genes. The common biogenesis and function of miRNAs77 lead to evolutionary and structural signatures (Fig. 2c) that can be used for their systematic de novo discovery8–11. Using such signatures in the 12 fly genomes (Supplementary Methods 4a, b), we predicted 101 miRNAs78 (Supplementary Table 4d), which include 60 of the 74 verified Rfam miRNAs (81%), while spanning less than 0.006% of the fly genome (13,500-fold nucleotide enrichment). Comparison of our predictions with high-throughput sequencing data of short RNA libraries from different stages and tissues of D. melanogaster78,79 revealed that 84 of the 101 predictions (83%), including 24 of the 41 novel predictions (59%), were authentic miRNA genes (Fig. 5a and Supplementary Table 4d). An independent computational method79 had 20 of its 45 novel predictions validated when used across six Drosophila species. Additional candidates may represent genuine miRNAs whose temporal or spatial expression pattern does not overlap with the surveyed libraries. Several of the validated miRNAs were on the transcribed strand of introns or clustered with other miRNAs. For example, mir-11 and mir998 (the vertebrate homologue of which, mir-29, has been implicated in cancer80) were both found in the last intron of E2f, and might be involved in cell-cycle regulation (Fig. 5b). Notably, two predictions overlapped exons of previously annotated protein-coding genes that were independently rejected above (Fig. 5c), providing an explanation for the previously observed transcripts of these annotations and highlighting the importance of specific signatures for genome annotation. High-throughput sequencing data discovered an additional 50 miRNAs not found computationally79,81, thereby illustrating the limitations of purely computational approaches. Some of these had precursor structures not seen previously for animal miRNAs, including unusually long hairpins79 and hairpins corresponding to short introns (mirtrons)81,82. The remaining were often less broadly conserved or showed unusual conservation properties. Signatures for mature miRNA annotation. The exact position of 59 cleavage of mature miRNAs is important, because it dictates the core of the target recognition sequence83–85. This leads to unique structural and evolutionary signatures, including direct signals, present at the 59 cleavage site, and indirect signals, stemming from the relationship of miRNAs with their target genes (Supplementary Methods 4a, c). Combined into a computational framework78, these signatures predicted the exact start position in 47 of the 60 cloned Rfam miRNAs (78%), and were within 1 bp in 51 cases (85%). The method disagreed with the previous annotation in 9 of the 14 Rfam miRNAs that were not previously cloned, of which 6 were confirmed by sequencing reads78,79, leading to marked changes in the inferred target spectrum (Fig. 5d). Prediction accuracy was significantly lower (41% exact, 61% within 1 nucleotide) for novel miRNAs, which, however, also showed less accurate processing in vivo78,79. New insights into miRNA function and biogenesis. We predicted targets for all conserved miRNAs identified by high-throughput sequencing79 searching for conserved matches to the seed region (similar to ref. 86) evaluated using the branch length score (Supplementary Methods 5a), a new scoring scheme described below. Whereas the resulting miRNA targeting network changed substantially79, we found that the novel and revised miRNAs shared many of their predicted targets with previously known miRNAs, resulting in a denser network with increased potential for combinatorial regulation78,79. For ten miRNA hairpins, the mature miRNA and the corresponding miRNA star sequence (miRNA*, the small RNA from the opposite arm of the hairpin) both appeared to be functional: both reached high computational scores and were frequently sequenced78,79, often exceeding the abundance of many mature miRNAs (Supplementary Table 4e). The Hox miRNA mir-10 showed a particularly striking example of a functional star sequence (Fig. 5e): both arms showed
224 ©2007 Nature Publishing Group
ARTICLES
NATURE | Vol 450 | 8 November 2007
abundant reads, high scores and highly conserved Hox gene targets78,79, suggesting a key role in Hox regulation. In addition, for 20 miRNA loci, the anti-sense strand also folded into a high-scoring hairpin suggestive of a functional miRNA78 (Supplementary Table 4f). Indeed, sequencing reads confirmed that four of these anti-sense hairpins are processed into small RNAs in vivo79. Thus, a single genomic miRNA locus may produce up to four miRNAs, each with distinct targets.
their many weakly specified positions, and the varying distances at which they can act87,88. Recent studies have shown that comparative genomics of a small number of species can be used for motif discovery3,4,12–14, on the basis of hundreds of conserved instances across the genome (Fig. 2d). Many related genomes should lead to increased discovery power, but also pose new challenges, arising from sequencing, assembly, or alignment artefacts, and from movement or loss of motif instances in individual species. To account for the unique properties of regulatory motifs, we developed a phylogenetic framework to assess the conservation of each motif instance across many genomes89. Briefly, we searched for motif instances in each of the aligned genomes, and based on the set
Regulatory motif discovery and characterization Regulatory motifs recognized by proteins and RNAs to control gene expression have been difficult to identify due to their short length, a
mir-190
C
A
U
U
U
A C U A A
A U U A U A C A C A U U
G A U G A U A U G U U U
miRNA
G U G A
1 1 1 8 26 1
No. of reads
c mir-279
E2f
+1
0.4
e
Target overlap 40%
U
0.1 0
U
U
C
G
U
0.3
U U
+3
U U
U U
G G
U U
G G
A
C
Target overlap 1%
A
U
G
CG31044
C U U U A
U
G
U
A
G
C
U
A
U
A
U
A
A
U
A
U
G
C
C
G
C
G
U
U U C
A
U
U
A
G
G
U
A
C C
G A G
C
G U
G
U
C
G
A
U
C
G
C
G
miR-10 miR-10* Average miRNA* 162
1.5
A
A
1,620
2.5
G
U C U
5′
0.2
U
mir-996
miR-10*
0.2
G
U A
68 89
204
A
C A
0.3
miR-274 7mer seed conservation
ACCCAGGAATCAAACATATTATTA CCCAGGAATCAAACATATTA CCCAGGAATCAAACATATTAT CCCAGGAATCAAACATATTATT CCCAGGAATCAAACATATTATT CCAGGAATCAAACATATTATTA
No. of reads
mir-998 mir-11
7mer seed conservation
d
8 31 47 13 28 353 34 1 1 2 1 1 1 1 1
miR-10
U U G G G
A G G A C C C A C
AGATATGTTTGATATTCTT AGATATGTTTGATATTCTTG AGATATGTTTGATATTCTTGG AGATATGTTTGATATTCTTGGT AGATATGTTTGATATTCTTGGTT AGATATGTTTGATATTCTTGGTTG AGATATGTTTGATATTCTTGGTTGT AGATATGTTTGATATTCTTGGTTGTT GATATGTTTGATATTCTTGGT GATATGTTTGATATTCTTGGTTG ATATGTTTGATATTCTTGGTT TATGTTTGATATTCTTGGTTG ATGTTTGATATTCTTGGTTG ATGTTTGATATTCTTGGT TGTTTGATATTCTTGGTTG
A U
U C U U
GATGGTTCCAGTGAGATATGTTTGATATTCTTGGTTGTTTCATTCAAAAGTTCACCCAGGAATCAAACATATTATTACTGTGACCCT C ((.(((..((((((((((((((((((..((((((.((...(........)..)).)))))))))))))))))).))))))..))).) )
miRNA*
b
miRNA*
miRNA
U
U C
G A
A
A
A
U
U
rhea
U U G
0.3 3′
Mature score
200
18
No. of reads No. of targets
129
88 3
0.1
iab
pb
0 C
A
G
U
U
miR-263a
A
A
U
G
G
A
A
U
G
G
Dfd
miR-10
scr
Antp
Ubx abd-A
miR-iab-4
abd-B
miR-10*
C
A
Figure 5 | MicroRNA gene identification and functional implications. a, New predicted miRNA (mir-190) and its validation by sequencing reads. Total read counts for mature miRNA (red) and miRNA* (blue) show a characteristic pattern of processing indicative of miRNAs. Highlighted regions indicate most abundant processing products. b, Example of clustered known (mir-11) and new (mir-998) miRNAs in the intron of cellcycle regulator E2f. c, Example of a new miRNA (mir-996) in the transcript of a spurious gene. CG31044 was rejected by our protein-coding analysis, its
transcript probably representing the precursor of mir-996, with no proteincoding function. d, Revisions to the 59 end of miR-274 and miR-263a are proposed on the basis of evolutionary evidence (for example, 7mer seed conservation; black curve) and confirmed by sequencing reads. Changes at the 59 end of more than one nucleotide results in marked changes to the predicted target spectra (venn diagrams). e, Evidence from evolutionary signals (mature score), sequencing reads and target predictions suggests that both miR-10 and miR-10* are functional, each targeting distinct Hox genes. 225
©2007 Nature Publishing Group
ARTICLES
NATURE | Vol 450 | 8 November 2007
of species that contained them, we evaluated the total branch length over which the D. melanogaster motif instance appears to be conserved (Supplementary Methods 5a, b), which we call the branch length score (BLS). We used BLS for the discovery of novel motifs (this section) and for the prediction of individual functional motif instances (next section). Predicted motifs recover known regulators. To discover motifs, we estimated the conservation level of candidate sequence patterns with a motif excess conservation (MEC) score compared to overall conservation levels in promoters, UTRs, introns, protein-coding exons and intergenic regions (Supplementary Methods 5a). Our search in regions with roles in pre-transcriptional regulation resulted in 145 distinct motifs (Table 2), obtained by collapsing variants across 83 motifs discovered in promoters, 35 in enhancers, 20 in 59 UTRs, 35 in core promoters, 30 in introns and 84 in the remaining intergenic regions. Motifs discovered in each region showed similar properties and large overlap: 66 (46%) were discovered independently in at least two regions and 40 (28%) in at least three, consistent with shared regulatory elements in these regions90. The 145 discovered motifs match 40 (46%) of the 87 known transcription factors in Drosophila (Supplementary Table 5c) compared to 8% expected at random (P 5 1 3 10220). Several of the nondiscovered known motifs are involved in early anterior–posterior segmentation of the embryo, consistent with reports that they are largely non-conserved91; indeed, 74% of these did not exceed the conservation expected by chance in promoter regions. Other
non-discovered motifs often lacked characteristics expected for transcription factor motifs, suggesting that some may be spurious: 49% were unusually long (.10 nucleotides) compared to 23% of recovered ones, and showed only one or a few total instances genomewide, suggestive of individual regulatory sites rather than motifs. Tissue-specific and functional enrichment of novel motifs. The discovered motifs showed strong signals with respect to embryonic expression patterns (Fig. 6a). Overall, 75 (52%) were either enriched or depleted in genes expressed in at least one tissue, compared to 59% of known motifs and 3% of random controls. Motif depletion may represent either specific repressors for individual tissues, or activators excluded from these tissues. Motif depletion was found more generally in ubiquitously expressed genes (30% of discovered and 34% of known motifs compared with 1% expected at random), similar to findings for in vivo binding sites92, and probably reflecting less complex regulation. We also found significant motif enrichment in groups of genetically interacting genes (collected by FlyBase) that often function in common developmental contexts or signalling pathways, genes of metabolic pathways (Kyoto Encyclopedia of Genes and Genomes, KEGG93), and genes with shared functions (GO). In total, 68% of discovered and 70% of known motifs were enriched or depleted in one of the functional categories (14% random). Noteworthy examples include motif ME93 (GCAACA), which was more highly enriched in neuroblasts (P 5 4 3 10212) than either of the two well-known regulators of neuroblast development, prospero and asense (P 5 4 3 1025 and 2 3 1027, respectively). Similarly,
Table 2 | Pre-transcriptional motifs Name
Motif consensus
MEC
MCS
Region*
Known transcription factor{
Multiplicity score{
ImaGO enrichment1
ImaGO score1
ME1 ME2 ME3 ME4 ME5 ME6 ME7 ME8 ME9 ME10 ME11 ME12 ME13 ME14 ME15 ME16 ME17 ME18 ME19 ME20 ME21 ME22 ME23 ME24 ME25 ME26 ME27 ME28 ME29 ME30 ME31 ME32 ME33 ME34 ME35 ME36 ME37 ME38 ME39 ME40
GTCACGTD AWNTGGGTCA BCATAAATYA HAATTAYGCRH STATAWAWR VATTWGCAT BYAATTARH HRTCAATCA TGACANNNNNNTGACA RCGTGNNNNGCAT MATTAAWNATGCR TTAATGATG WTGACANBT YGACMTTGA AATTRNNNNCAATT TGACGTCAT MAATTNAATT MRYTTCCGYY MATTRRCACNY YTAATGAVS TAATTRANNTTNATG WAATGCGCNT MATTWRTCA YAATTWNRYGC TTAYGTAA YGCGTHAATTR AATTRYGWCA GCGCATGH WAATCARCGC AATTAANNNNNCATNA GCGTSAAA YGCGYRTCAWT GCGTTGAYA AAATKKCATTA RACASCTGY TGTCAATTG WAATKNNNNNCRCGY CASGTAR WCACGTGC CATTANNNWAATT
0.448 0.393 0.369 0.365 0.358 0.356 0.338 0.338 0.336 0.329 0.324 0.32 0.318 0.313 0.309 0.304 0.304 0.304 0.303 0.298 0.294 0.291 0.288 0.287 0.283 0.283 0.28 0.28 0.275 0.271 0.271 0.269 0.269 0.266 0.266 0.265 0.261 0.261 0.26 0.259
45.41 26.97 36.02 32.71 24.31 44.06 15.45 42.32 9 15.94 12.43 20.31 63.45 27.06 21.17 12.24 51.57 39.04 25.24 44.5 8.67 18.17 46.25 30.91 13.06 13.61 22.85 30.17 13.82 16.44 29.95 12.87 15.1 14.04 28.38 12.65 23.34 9.24 10.54 19.02
PIG PIG PCEIG PCE5IG C PE5IG PCE5IG PIG G PIG PIG PG PE5IG PIG PG PC5IG PE5IG PEIG PIG PEIG G G PEIG PG 5 PEG PEIG PCEG G G PG G PG PG PCEG PG PEG PEG PCE5IG G
– Hr46 Caudal Engrailed TATA – Engrailed – – – acj6 – – – – CrebA – Dorsal – – – – – – Giant – – – – Antennapedia – – – – Scute – – Single-minded Enhancer of split –
– – – – – 3.73 7.08 – – – – – 4.14 – – – – – – – – – – 4.27 – – – – – – – – – – – – – 4.58 – –
– Oesophagus (13–16) Ubiquitous (13–16) – Ventral nerve cord (13–16) Ubiquitous (11–12) Ubiquitous (11–12) Dorsal pharyngeal muscle PR (11–12) – – Tracheal PR (11–12) – Ubiquitous (13–16) Midgut (13–16) – – Ubiquitous (11–12) Ubiquitous (11–12) – Foregut PR (11–12) – – Dorsal epidermis PR (11–12) Ubiquitous (11–12) Midgut (13–16) – Pericardial cell (13–16) Ventral nerve cord PR (11–12) – – – – – – Ventral sensory complex SA (11–12) Tracheal system (13–16) – Ventral epidermis PR (11–12) – –
– 4.52 26.22 – 25.1 27.15 210.26 24.15 – – 4.11 – 23.97 4.32 – – 26.66 24.4 – 4.19 – – 4.4 24.79 5.32 – 4.1 5.75 – – – – – – 4.08 4.56 – 7.41 – –
The top 40 of 145 are shown. MEC, motif excess conservation; MCS, motif conservation score. See Supplementary Table 5c for the full table. * Region where the motif was found: P, promoter, C, core promoter; E, enhancers; 5, 59 UTR; I, intron; G, intergenic genome. { The known transcription factor motif matching the consensus sequence. { A multiplicity score is reported for motifs with many repeated occurrences. 1 Tissue where motif is most strongly enriched or depleted, and corresponding score (positive, enrichment; negative, depletion). PR, primordium; SA, specific anlage.
226 ©2007 Nature Publishing Group
ARTICLES
NATURE | Vol 450 | 8 November 2007
initiation97. For example, ME5 (STATAWAWR), which matches the TATA-box motif, displayed a sharp peak on the transcribed strand, 27 nucleotides upstream of the transcription start site. Similarly, ME120 (TCAGTT), corresponding to the known initiator motif (Inr) strongly peaked directly on the transcription start site, and ME54 (RCGYRCGY), which matches a known downstream promoter element (DPE), peaked 30 nucleotides downstream of the transcription start site. Regulatory motifs involved in post-transcriptional regulation. We also used BLS/MEC to discover motifs involved in post-transcriptional regulation, and developed methods to distinguish motifs acting at the DNA level, motifs acting at the RNA level and motifs stemming from protein-coding codon biases (Supplementary Methods 5a). Motifs acting post-transcriptionally at the RNA level generally showed highly asymmetric conservation12, as functional instances can only occur on the transcribed strand. Indeed, 71 of 90 motifs (79%) discovered in 39 UTRs showed strand-specific conservation (compared with only 3% of 59 UTR motifs and 5% of intron motifs, suggesting that these act primarily in pre-transcriptional regulation). Overall, 33 motifs discovered in 39 UTRs were complementary to the 59 end of Rfam miRNAs, recovering 72% of known miRNAs (68% of 59 unique miRNA families). An additional 21 motifs matched to 59 ends of novel miRNAs predicted above, of which 12
b
STATAWAWR (TATA box)
TCAGTT (Inr)
RCGYRCGY (DPE)
TATCGATA (Dref)
–500 nt
c
–250 nt
5 4 3 2 1
F1
F2
F3
All Fs
Reading frame
Figure 6 | Regulatory motif discovery. a, Discovered motifs show enrichment (red) or depletion (blue) in genes expressed in a given tissue (log colour range from P 5 1025 enrichment to P 5 1025 depletion). Biclustering reveals groups of motifs with similar tissue enrichment and groups of tissues with similar motif content. Full matrix and randomized control is shown in Supplementary Fig. 6d. b, Positional bias of discovered motifs relative to transcription start sites (TSS). Peaks with highly specific distances from the transcription start site (for example, first three plots) are characteristic of core promoter elements, and broad peaks (for example, fourth plot) are characteristic of transcription factors. For non-palindromic motifs, colours indicate forward-strand (red) and reverse-strand (blue) instances. Curves denote the density of all instances and individual segments
TSS
d
(×10–2)
Motif excess conservation
Germ cell Central nervous system Ventral nerve cord Brain Procephalon Amnioserosa Cuprophilic cell Central brain neuron Central brain Central brain surface glia Central brain glia Lateral cord surface glia Ventral midline Sensory nervous system PR Labial sensory complex Ventral apodeme Maxillary sensory complex Epipharynx Hypopharynx Salivary gland common duct Head epidermis dorsal Optic lobe Visual system Ventral sensory complex PR Sensory system head Salivary gland duct Salivary gland Apoptotic amnioserosa Proventriculus inner layer Visceral branch Dorsal trunk Oesophagus Tracheal system Posterior spiracle Head epidermis Ventral epidermis Dorsal epidermis Atrium Clypeolabrum Foregut Hindgut Lateral cord neuron Lateral cord glia Midgut interstitial cell Labral sensory complex Corpus allatum Ring gland Large intestine Dorsal apodeme Visceral muscle Oenocyte Antennal sense organ Circulatory system Dorsal vessel Small intestine Rectum Proventriculus intermediate layer Proventriculus Anal pad Malpighian tubule main segment Midgut chamber Malpighian tubule Midgut Dorsal prothoracic pharyngeal muscle Gastric caecum Somatic muscle Gonad Ubiquitous Muscle system Plasmatocytes Crystal cell Dorsal-lateral sensory complex No staining
Motif excess conservation
a
ME 5 ME 26 ME 18 ME 2 ME 14 ME 25 ME 1 ME 39 ME 15 ME 8 ME 31 ME 33 ME 43 ME 29 ME 34 ME 41 ME 3 ME 17 ME 48 ME 19 ME 36 ME 6 ME 7 ME 50 ME 20 ME 32 ME 23 ME 27 ME 13 ME 46 ME 49 ME 38 ME 28 M E 11 ME 37 ME 4 ME 24 ME 42 ME 22 ME 45
motifs ME89 (CACRCAC), ME11 (MATTAAWNATGCR) and ME117 (MAAMNNCAA) were highly enriched in malpighian tubule (P 5 4 3 1027), trachea (P 5 4 3 1025) and surface glia (6 3 1027), respectively, in each case ranking above motifs for factors known to be important in these tissues (Supplementary Table 5c). These presumably correspond to as-yet-unknown regulators for these tissues. Exclusion, clustering and positional constraints. A large number of motifs were depleted in coding sequence (57% of discovered versus 57% of known and 10% of random motifs, P 5 3 3 10218) and in 39 UTRs (30% versus 22% and 0%, P 5 4 3 10211), suggesting specific exclusion similar to in vivo binding92. Many of the intergenic or intronic instances occurred in clusters, a property of motifs that has been used to identify enhancer elements91,94–96. We assessed increased conservation of motifs when found near other instances of the same motif (whether conserved or not, to correct for regional conservation biases), and found significant multiplicity for 19% of the discovered motifs (compared to 24% of known and 4% of random motifs). In addition, 15 of the discovered motifs (10%) were significantly enriched near transcription start sites (compared to 14% of known and 1% of random motifs). Several were enriched at precise positions and preferred orientations (Fig. 6b), including close matches to several known core promoter motifs involved in transcription
(×10–2)
+250 nt
+500 nt
miRNA 7mer conservation In coding exons In 3′ UTRs
4 3 2 1 0
–5 –4 –3 –2
3 4 5 6 7 8 9 10 11 12 13 14 15 16 17 18 19 20 –1
0 1 2
–1
Position relative to mature miRNA 5′ end
denote individual motif instances, summed across groups of 50 genes (each line). c, Coding regions show reading-frame-invariant conservation for miRNA motifs (red) and reading-frame-biased conservation for protein motifs (grey). MEC scores are evaluated for each of the three reading frame offsets (F1–F3) and also without frame correction (all Fs). Plots show average MEC for all miRNA motifs and 500 top-scoring protein-coding motifs (based on MEC without frame correction). d, Motif excess conservation (MEC) of 7mer complements at different offsets with respect to miRNA 59 end, averaged across all Rfam miRNAs. MEC scores evaluated in protein-coding regions and 39 UTRs show a highly similar profile (correlation coefficient 0.96), suggesting similar evolutionary constraints. 227
©2007 Nature Publishing Group
ARTICLES
NATURE | Vol 450 | 8 November 2007
anti-target genes (Supplementary Fig. 5f), similar to findings for these genes’ 39 UTRs103,104. Overall, these results, together with findings in vertebrates86,101–103, suggest that important miRNA targets have been overlooked by many target prediction methods105 that have traditionally focused exclusively on 39 UTR sequences. Prediction of individual regulator binding sites Previous methods for regulatory motif discovery3,4,12–14 integrated conservation information over hundreds of motif instances across the genome, leading to an exceedingly clear signal for motif discovery even if many of these instances are only marginally conserved. In contrast, the reliable identification of individual motif instances has been hampered by lack of neutral divergence and would require many related genomes15–19. In the absence of such data, previous studies have relied on motif clustering91,94–96 or other sequence characteristics106 to predict regulatory targets or regions. With the availability of the 12 fly genomes, we inferred high-confidence instances of regulatory motifs by mapping the BLS of each motif instance to a confidence value (Supplementary Methods 5a). This value represents the probability that a motif instance is functional, on the basis of the conservation level of appropriate control motifs evaluated in the same type of region (promoter, 39 UTR, coding, and so on). Because the number of conserved instances decreases much more rapidly for control motifs than for real motifs, the many genomes allowed us to reach high confidence values for many transcription factors and miRNAs, even at relatively modest BLS thresholds (Fig. 2e). Conserved motif instances identify functional in vivo targets. We found that increasing confidence levels selected for functional instances for both transcription factor and miRNA motifs: the normalized fraction of transcription factor motif instances within promoter regions rose from 20% to 90%; that of miRNA motif instances within 39 UTRs rose from 20% to 90%; and the fraction of miRNA motif instances on the transcribed strand of 39 UTRs rose from 50% (uniform) to 100% (Fig. 7a); in each case selecting the regions and strands where the motifs are known to be functional. We further assessed how predicted motif instances compared with in vivo targets in promoter regions, defined experimentally (without comparative information). We used a set of highconfidence direct CrebA targets107 and three genome-wide chromatin
Scaled fraction of motif instances b c s g s TF motifs in bound regions ter TRs Rs n n o i T o d r U 100 om 5′ U Int Co 3′ 12 Confidence Pr Mef2 90 Twist Baseline 0% 10 80 Snail
miRNA
80% 3′ UTRs (+ strand)
Baseline miRNA
0%
60%
3′ UTRs (– strand)
Fraction of motif instances conserved
TF motifs 95%
Bound region enrichment (fold)
a
CrebA
8 6 4 2 0
0
20
40 60 80 Confidence (%)
Figure 7 | Identification of individual motif instances. a, Increasing confidence levels select for motif instances in regions they are known to be functional: conserved transcription factor (TF) motifs enrich for promoters; miRNA motifs for 39UTRs, and specifically the transcribed strand. Regions are normalized for their overall length, measured by the number of motif instances without conservation (0% confidence baseline). b, Increasing confidence levels select for transcription factor motif instances with experimental support for each factor tested. c, The high fraction of experimentally supported motif instances that are recovered at 60% confidence for transcription factors and 80% confidence for miRNAs illustrates the high sensitivity of the BLS approach. d, Comparison of
d Motif instance recovery Known motif Expected random
70 60 50 40 30 20 10 0
CrebA miRNAs
Mef2
Twist Snail
Enrichment/depletion of muscle genes
were validated experimentally78,79, and 3 motifs matched uniquely to miRNA star sequences, all of which were abundantly expressed in vivo (Supplementary Table 4e). We found 33 additional motifs in 39 UTRs that were apparently not associated with miRNAs. MO40 (TGTANWTW) closely matches the Puf-family Pumilio motif98. MO32 (AATAAA) corresponds to the polyadenylation signal and displays both very strong conservation and a sharply defined distance preference with respect to the end of the annotated 39 UTR (P 5 10269). Finally, several motifs (for example, MO24 5 TAATTTAT; MO94 5 TTATTTT) are variants of known AU-rich elements, which are known to mediate mRNA instability and degradation99. MicroRNA targeting in protein-coding regions. Protein-coding regions can also harbour functional regulatory motifs, such as exonic splicing regulatory elements100. However, motif conservation is difficult to assess within protein-coding regions because of the overlapping selective pressures. Indeed, the most highly conserved nucleotide sequence patterns of length seven (7mers) in coding sequence showed strong reading-frame-biased conservation, suggesting that they reflect protein-coding constraints rather than regulatory roles at the DNA or RNA level (Fig. 6c). MicroRNA motifs, which function at the RNA level, instead showed high conservation in all three reading frames, suggesting that they are specifically selected within coding regions for their RNAlevel function. Indeed, previous studies have shown that miRNA motifs in coding regions are preferentially conserved in vertebrates86, that they can lead to repression in experimental assays101,102, and that they are avoided in genes co-expressed with the miRNA103. Frameinvariant conservation allows us to demonstrate the coding-region targeting of individual miRNAs, and also enables the de novo discovery of miRNA motifs in coding regions. Using frame-invariant conservation, we recovered 11 miRNA motifs within the top 20 coding-region motifs (Supplementary Table 5g), whereas using overall conservation required several hundred candidates to recover 11 miRNA motifs. Moreover, 7mers complementary to different positions in the mature miRNA show a distinctive conservation pattern indicative of functional targeting in coding regions (Fig. 6d) and similar to that found in 39 UTRs12,83 (correlation coefficient 0.96). Finally, 6mers complementary to miRNA 59 ends were depleted in coding exons of
8 Relative functional enrichment ChIP+cons
7
ChIP only
6
ChIP, all
5
Cons, all 4
Cons only
3 2 1 0
Mef2 Twist Snail
Mef2
Twist
Snail
ChIP + enhancer
chromatin immunoprecipitation (ChIP) and conservation in their ability to identify functional motif instances. Motif instances that are both ChIPbound and conserved (purple) show the strongest functional enrichment in muscle genes for Mef2 and Twist (depletion for Snail), whereas motif instances derived by ChIP alone (light blue) show substantially reduced enrichment levels. Comparing the enrichment of all instances recovered by ChIP (blue) and all instances recovered by conservation (red) suggests that the two approaches perform comparably. Even the sites recovered by conservation alone outside bound regions (pink) show enrichment levels comparable to ChIP, suggesting that they are also functional.
228 ©2007 Nature Publishing Group
ARTICLES
NATURE | Vol 450 | 8 November 2007
immunoprecipitation (ChIP) data sets for Snail, Mef2 and Twist92,108,109, and in each case found that the enrichment between conserved motif instances and known in vivo regions increased sharply for increasing confidence values (Fig. 7b). We also found that a large fraction of motif instances in experimentally determined target regions was conserved (Fig. 7c): 76% of motif instances in direct CrebA targets and 90% of motif instances in experimentally supported miRNA targets104,110 were recovered at 60% confidence. Although many of the miRNA targets stem from comparative predictions and are expected to be well conserved, their high recovery rate illustrates the increased sensitivity of the BLS measure compared to perfect conservation (Supplementary Fig. 7d). Similar results were found for motifs in known enhancers that were determined to be bound by ChIP (‘ChIP-bound’): 65% of Mef2 motifs, 65% of Snail motifs and 25% of Twist motifs were conserved (Fig. 7c). ChIP-determined and conservation-determined targets show similar enrichment. To determine whether ChIP-bound motifs that lack conservation are biologically meaningful, we studied their enrichment in muscle gene promoters. We found that motifs that were both bound and evolutionarily conserved showed very strong correlation with muscle genes for all three factors: Mef2 showed eightfold enrichment, Twist showed sevenfold enrichment and Snail, a mesodermal repressor, showed threefold depletion for muscle genes. However, when only non-conserved sites were considered, the correlation dropped significantly to 1–2-fold for all three factors, suggesting that non-conserved ChIP-bound sites may be of decreased biological significance (Fig. 7d). We also used the correlation with muscle genes to compare ChIPon-chip and evolutionary conservation as two complementary methods for target identification (Fig. 7d). We found that the enrichment of conservation-inferred targets was consistently higher than the enrichment of ChIP-inferred targets for each of the three factors. Finally, we assessed the functional significance of motif instances that were only found by the conservation approach, specifically excluding those in ChIP-bound regions, and found that these were also enriched in the same functional categories as ChIP-bound sites with comparable or higher functional correlations (Fig. 7d). This suggests that the additional conserved instances are indeed functional, probably reflecting the higher coverage of conservation-based approaches, which are not restricted to the experimental conditions surveyed, or that they may be bound in vivo yet missed by ChIP-on-chip technology111,112. In an independent study113 we compared several strategies for the prediction of motif instances and cis-regulatory modules and found that using the 12 fly genomes led to substantial improvements. In another study, we reported the recovery of conserved motifs for b
c
100
90
80
No. of species 2 5 6 8 9 12 Best pair
70
Branch Species used length D.mel, D.ere 0.2 +D.sim, D.sec, D.yak 0.4 +D.ana 1.3 +D.pse, D.per 1.9 +D.wil 2.8 +D.moj, D.vir, D.gri 4.1 1.0 D.mel, D.ana
Known ncRNAs recovered
35 30 25 20 15 Pairwise Multiple
10 5
80 70 60 50 Pairwise Multiple
40
60 100
200
300
400
500
Sequence length (nucleotide)
600
0
1
2
3
4
Branch length
Figure 8 | Scaling of discovery power with the number and distance of informant species. a, Discriminatory power of CSF protein-coding evolutionary metric for varying exon lengths and using different numbers of informant species. Sensitivity is shown for known exons at a fixed falsepositive rate based on random non-coding regions. Mean length is shown for each exon length quantile. Multi-species comparisons increase discovery
0
1
2
3
Branch length
4
Motifs reaching 60% confidence (%)
Scaling of comparative genomics power Theoretical considerations and pilot studies on selected genomic regions showed that the discovery power of comparative methods scales with the number and phylogenetic distance of the species compared16–20,46,119,120. We extended these analyses by investigating the scaling of genome-wide discovery power using evolutionary signatures for each class of functional elements (Fig. 8), on the basis of the recovery of known elements using different subsets of informant species (at a fixed stringency). We found that recovery consistently increased with the total number of informant species, and that multi-species comparisons outperformed pairwise comparisons within the same phylogenetic clade. When we examined subsets of informants with similar total branch length (for example, several close species versus one distant species),
Cloned miRNAs recovered
Exon sensitivity at 99% specificity (%)
a
several known regulators, including Suppressor of Hairless, in genes of the Enhancer of split complex114. A regulatory network of D. melanogaster at 60% confidence. Having established the accuracy of conserved motif instances, we present an initial regulatory network for D. melanogaster at 60% confidence (Supplementary Fig. 5i), containing 46,525 regulatory connections between 67 transcription factors and 8,287 genes, and 3,662 connections between 81 cloned miRNAs (clustered in 49 families with unique seed sequences) and 2,003 genes. The distribution of predicted sites per target gene is highly nonuniform and indicative of varying levels of regulatory control. Genes with the highest number of sites appeared to be enriched in morphogenesis, organogenesis, neurogenesis and a variety of tissues, whereas ubiquitously expressed genes and maternal genes with housekeeping functions had the fewest sites104. Interestingly, transcription factors appeared to be more heavily targeted than other genes, both by transcription factors (10 sites versus 5.5 on average, P 5 10215) and by miRNAs (2.3 versus 1.8 miRNAs, P 5 5 3 1025). Moreover, genes with many transcription factor sites also had many miRNA sites, and conversely, genes with few transcription factor sites also had few miRNA sites (P 5 1024 and P 5 7 3 1023, respectively). Several of the predicted regulatory connections have independent experimental support (Supplementary Table 5h), including direct regulation of achaete by Hairy115, of giant by Bicoid116, of Enhancer of split complex genes by Suppressor of Hairless117, and of bagpipe by Tinman (known to cooperate in mesoderm induction and heart specification118). More generally, when tissue-specific expression data were available, we found that on average 46% of all targets were co-expressed with their factor in at least one tissue (Supplementary Fig. 5i), which is significantly higher than expected by chance (P 5 2 3 1023).
d 70 60 50 40 30 20
Pairwise Multiple
10 0 0
1
2
3
4
Branch length
power, especially among short exons. b, Recovery of known ncRNAs (among the top 100 predictions) for pairwise (blue) and multi-species (red) comparisons. c, Recovery of cloned miRNAs (among the top 100 predictions). d, Recovery of transcription factor and miRNA motifs with instances at 60% confidence. 229
©2007 Nature Publishing Group
ARTICLES
NATURE | Vol 450 | 8 November 2007
multi-species comparisons sometimes performed better (proteincoding exons, ncRNAs), comparably (motifs), or worse (miRNAs) than pairwise comparisons. This complex relationship between total branch length and actual discovery power probably reflects imperfect genome assemblies/alignments, characteristics of each class of functional elements, and the specific methods we used. For example, ncRNA discovery probably benefits from observing more compensatory changes across more genomes, whereas miRNA discovery may be more sensitive to artefacts in low-coverage genomes, given the expected high conservation of miRNA arms. As expected, longer elements were easier to discover than shorter elements. Long protein-coding exons (.300 nucleotides) were recovered at very high rates even with few species at close distances (leaving little room for improvement with additional species). In contrast, more informant species and larger distances were crucial for recovering short exons, miRNAs and regulatory motifs. Notably, the optimal evolutionary distance for pairwise comparisons to D. melanogaster also seemed to depend on element length: for long protein-coding exons, the best pairwise informant was the closely related D. erecta, for exons of intermediate lengths D. ananassae, and for the shortest exons the distant D. willistoni (Supplementary Table 7a). Distant species were also optimal for other classes of short elements (ncRNAs, miRNAs and motifs, Fig. 8b–d). This suggests that a small number of species at close evolutionary distances may generally allow the discovery of long elements, possibly including clade-specific elements, whereas short clade-specific elements may not be reliably detectable without many genomes at close distances. Finally, we investigated the effect of alignment choice on our results (Supplementary Fig. 8). We found high similarity between different alignment strategies for longer elements (.93% agreement for exons), whereas shorter elements showed larger discrepancies between alignments (81% and 59% agreement for miRNA and motif instances, respectively). Although factors such as genome size, repeat density, pseudogene abundance and physiological differences might confound a simple analogy to the vertebrate phylogeny based on neutral branch length (Fig. 1c), our results suggest that comparisons spanning marsupials, birds and reptiles may prove surprisingly useful for biological signal discovery in the human genome. Discussion Our results demonstrate the potential of comparative genomics for the systematic characterization of functional elements in a complete genome. Even in a species as intensely studied as D. melanogaster, our methods predicted several thousand new functional elements, including protein-coding genes and exons, novel RNA genes and structures, miRNA genes, regulatory motifs, and regulator targets. Our novel predictions have overwhelming statistical support, often surpassing that of known functional elements, and are additionally supported by experimental evidence in hundreds of cases. The common underlying methodology in this study has been the recognition of specific evolutionary signatures associated with each class of functional elements, which can be much more informative for genome annotation than overall measures of nucleotide conservation. These signatures are general and are immediately relevant to the analysis of the human genome and more generally of any species. In addition to the many new elements, we gained specific biological insights and formulated hypotheses that we hope will guide follow-up experiments. We found 149 genes with potential translational readthrough, showing protein-like evolution downstream of a highly conserved stop codon, and possibly encoding additional protein domains or peptides specific to certain developmental contexts. We also found several candidate programmed frameshifts, which might be part of regulatory circuits (as for ODC/Oda 64) or help expand the diversity of protein products generated from one mRNA, similar to their role in prokaryotes121. We also presented evidence of miRNA processing from both arms of a miRNA hairpin
and from both DNA strands of a miRNA locus in some cases, potentially leading to as many as four functional miRNAs per locus. As miRNA/miRNA* pairs are expressed from a single precursor and thus co-regulated, whereas sense/anti-sense pairs are expressed from distinct promoters, the use of both arms or both strands provides compelling general building blocks for higher-level miRNAmediated regulation. The newly discovered elements did not dramatically increase the total number of annotated nucleotides. Known and predicted elements explain 42% of nucleotides in phastCons elements33, compared to 35.5% for previous annotations (Supplementary Fig. 6), an 18% increase (mostly owing to conserved motif instances). The remaining phastCons elements and independent estimates based on transcriptional activity42 would suggest that a much higher fraction of the genome may be functional (Supplementary Fig. 6). Although it is possible that these estimates are artificially high and that we are in fact converging on a complete annotation of the fly genome, they might instead indicate that much remains to be discovered, which may require the recognition of as-yet-unknown classes of functional elements with distinct evolutionary signatures. Our results also allowed us to compare and contrast evolutionary and experimental methods for the recovery of functional elements, particularly for the identification of regulator targets. We found that comparative genomics resulted in many functionally meaningful sites for transcription factors Mef2, Twist and Snail outside ChIPbound regions, probably representing targets from diverse conditions not surveyed experimentally. Similarly, ChIP resulted in many additional sites outside those recovered by comparative genomics: some of these may have been replaced by functionally equivalent non-orthologous sequence, rendering them apparently non-conserved in sequence alignments122–124; others may have species- or lineagespecific roles, thus lacking sufficient signal for their comparative detection; finally, some bound sites may be biochemically active yet selectively neutral125. It is worth noting, however, that ChIP-bound motifs that were not conserved showed decreased enrichment in muscle/ mesoderm development where the factors are known to act, suggesting that potential lineage-specific roles may lie outside the regulators’ conserved functions. To resolve these questions, comparative genomics studies would benefit greatly from experimental studies in several related species in parallel. Overall, comparative genomics and species-specific experimental studies provide complementary approaches to biological signal discovery. Comparative studies help pinpoint evolutionarily selected functional elements across diverse conditions, whereas experimental studies reveal stage- and tissue-specific information, as well as species-specific sites. Ultimately, their integration is a necessary step towards a comprehensive understanding of animal genomes. METHODS SUMMARY The Methods are described in Supplementary Information, with more details found in the cited companion papers for each section. The sections of the Supplementary Methods are arranged in the same order as the manuscript to facilitate cross-referencing, with an index on the first page to aid navigation. Received 21 July; accepted 4 October 2007. 1. 2. 3. 4. 5. 6. 7.
Miller, W., Makova, K. D., Nekrutenko, A. & Hardison, R. C. Comparative genomics. Annu. Rev. Genomics Hum. Genet. 5, 15–56 (2004). Ureta-Vidal, A., Ettwiller, L. & Birney, E. Comparative genomics: genome-wide analysis in metazoan eukaryotes. Nature Rev. Genet. 4, 251–262 (2003). Kellis, M. et al. Sequencing and comparison of yeast species to identify genes and regulatory elements. Nature 423, 241–254 (2003). Cliften, P. et al. Finding functional features in Saccharomyces genomes by phylogenetic footprinting. Science 301, 71–76 (2003). Brent, M. R. Genome annotation past, present, and future: how to define an ORF at each locus. Genome Res. 15, 1777–1786 (2005). Washietl, S., Hofacker, I. L. & Stadler, P. F. Fast and reliable prediction of noncoding RNAs. Proc. Natl Acad. Sci. USA 102, 2454–2459 (2005). Pedersen, J. S. et al. Identification and classification of conserved RNA secondary structures in the human genome. PLoS Comput. Biol. 2, e33 (2006).
230 ©2007 Nature Publishing Group
ARTICLES
NATURE | Vol 450 | 8 November 2007
8. 9. 10. 11. 12. 13. 14. 15. 16. 17.
18. 19. 20.
21. 22. 23. 24. 25. 26. 27.
28. 29.
30. 31. 32. 33. 34.
35. 36. 37. 38. 39. 40. 41.
42. 43.
44. 45.
Lim, L. P. et al. The microRNAs of Caenorhabditis elegans. Genes Dev. 17, 991–1008 (2003). Lim, L. P. et al. Vertebrate microRNA genes. Science 299, 1540 (2003). Lai, E. C., Tomancak, P., Williams, R. W. & Rubin, G. M. Computational identification of Drosophila microRNA genes. Genome Biol. 4, R42 (2003). Berezikov, E. et al. Phylogenetic shadowing and computational identification of human microRNA genes. Cell 120, 21–24 (2005). Xie, X. et al. Systematic discovery of regulatory motifs in human promoters and 39 UTRs by comparison of several mammals. Nature 434, 338–345 (2005). Ettwiller, L. et al. The discovery, positioning and verification of a set of transcription-associated motifs in vertebrates. Genome Biol. 6, R104 (2005). Chan, C. S., Elemento, O. & Tavazoie, S. Revealing posttranscriptional regulatory elements through network-level conservation. PLoS Comput. Biol. 1, e69 (2005). Boffelli, D. et al. Phylogenetic shadowing of primate sequences to find functional regions of the human genome. Science 299, 1391–1394 (2003). Cooper, G. M. et al. Distribution and intensity of constraint in mammalian genomic sequence. Genome Res. 15, 901–913 (2005). Margulies, E. H., Blanchette, M., Haussler, D. & Green, E. D. Identification and characterization of multi-species conserved sequences. Genome Res. 13, 2507–2518 (2003). Thomas, J. W. et al. Comparative analyses of multi-species sequences from targeted genomic regions. Nature 424, 788–793 (2003). Eddy, S. R. A model of the statistical power of comparative genome sequence analysis. PLoS Biol. 3, e10 (2005). Bergman, C. M. et al. Assessing the impact of comparative genomic sequence data on the functional annotation of the Drosophila genome. Genome Biol. 3, RESEARCH0086 (2002). Rubin, G. M. & Lewis, E. B. A brief history of Drosophila’s contributions to genome research. Science 287, 2216–2218 (2000). Adams, M. D. et al. The genome sequence of Drosophila melanogaster. Science 287, 2185–2195 (2000). Misra, S. et al. Annotation of the Drosophila melanogaster euchromatic genome: a systematic review. Genome Biol. 3, RESEARCH0083 (2002). Celniker, S. E. & Rubin, G. M. The Drosophila melanogaster genome. Annu. Rev. Genomics Hum. Genet. 4, 89–117 (2003). Ashburner, M. & Bergman, C. M. Drosophila melanogaster: a case study of a model genomic sequence and its consequences. Genome Res. 15, 1661–1667 (2005). Matthews, K. A., Kaufman, T. C. & Gelbart, W. M. Research resources for Drosophila: the expanding universe. Nature Rev. Genet. 6, 179–193 (2005). Venken, K. J., He, Y., Hoskins, R. A. & Bellen, H. J. P[acman]: a BAC transgenic platform for targeted insertion of large DNA fragments in D. melanogaster. Science 314, 1747–1751 (2006). Dietzl, G. et al. A genome-wide transgenic RNAi library for conditional gene inactivation in Drosophila. Nature 448, 151–156 (2007). Spradling, A. C. et al. The Berkeley Drosophila Genome Project gene disruption project: Single P-element insertions mutating 25% of vital Drosophila genes. Genetics 153, 135–177 (1999). St Johnston, D. The art and design of genetic screens: Drosophila melanogaster. Nature Rev. Genet. 3, 176–188 (2002). Richards, S. et al. Comparative genome sequencing of Drosophila pseudoobscura: chromosomal, gene, and cis-element evolution. Genome Res. 15, 1–18 (2005). Drosophila 12 Genomes Consortium.. Evolution of genes and genomes on the Drosophila phylogeny. Nature doi:10.1038/nature06341 (this issue) (2007). Siepel, A. et al. Evolutionarily conserved elements in vertebrate, insect, worm, and yeast genomes. Genome Res. 15, 1034–1050 (2005). Nekrutenko, A., Makova, K. D. & Li, W. H. The KA/KS ratio test for assessing the protein-coding potential of genomic regions: an empirical and simulation study. Genome Res. 12, 198–202 (2002). Eddy, S. R. Computational genomics of noncoding RNA genes. Cell 109, 137–140 (2002). Bompfuenewerer, A. F. et al. Evolutionary patterns of non-coding RNAs. Theor. Biosci. 123, 301–369 (2004). Reese, M. G. et al. Genome annotation assessment in Drosophila melanogaster. Genome Res. 10, 483–501 (2000). Rubin, G. M. et al. A Drosophila complementary DNA resource. Science 287, 2222–2224 (2000). Stapleton, M. et al. A Drosophila full-length cDNA resource. Genome Biol. 3, RESEARCH0080 (2002). Hild, M. et al. An integrated gene annotation and transcriptional profiling approach towards the full gene content of the Drosophila genome. Genome Biol. 5, R3 (2003). Yandell, M. et al. A computational and experimental approach to validating annotations and gene predictions in the Drosophila melanogaster genome. Proc. Natl Acad. Sci. USA 102, 1566–1571 (2005). Manak, J. R. et al. Biological function of unannotated transcription during the early development of Drosophila melanogaster. Nature Genet. 38, 1151–1158 (2006). Lin, M. F. et al. Revisiting the protein-coding gene catalog of Drosophila melanogaster using twelve fly genomes. Genome Res. doi:10.1101/gr.6679507 (in the press). Yang, Z. & Bielawski, J. P. Statistical methods for detecting molecular adaptation. Trends Ecol. Evol. 15, 496–503 (2000). Mignone, F., Grillo, G., Liuni, S. & Pesole, G. Computational identification of protein coding potential of conserved sequence tags through cross-species evolutionary analysis. Nucleic Acids Res. 31, 4639–4645 (2003).
46. Zhang, L., Pavlovic, V., Cantor, C. R. & Kasif, S. Human-mouse gene identification by comparative evidence integration and evolutionary analysis. Genome Res. 13 (6A), 1190–1202 (2003). 47. Crosby, M. A. et al. FlyBase: genomes by the dozen. Nucleic Acids Res. 35 (Database issue) D486–D491 (2007). 48. Ashburner, M. et al. Gene ontology: tool for the unification of biology. The Gene Ontology Consortium. Nature Genet. 25, 25–29 (2000). 49. Ochman, H., Ajioka, J. W., Garza, D. & Hartl, D. L. Inverse polymerase chain reaction. Bio/Technology 8, 759–760 (1990). 50. Hoskins, R. A. et al. Rapid and efficient cDNA library screening by self-ligation of inverse PCR products (SLIP). Nucleic Acids Res. 33, e185 (2005). 51. Wan, K. H. et al. High-throughput plasmid cDNA library screening. Nature Protocols 1, 624–632 (2006). 52. Hahn, M. W., Han, M. V. & Han, S.-G. Gene family evolution across 12 Drosophila genomes. PLoS Genet 3, e197 (2007). 53. Andrews, J. et al. The stoned locus of Drosophila melanogaster produces a dicistronic transcript and encodes two distinct polypeptides. Genetics 143, 1699–1711 (1996). 54. Brogna, S. & Ashburner, M. The Adh-related gene of Drosophila melanogaster is expressed as a functional dicistronic messenger RNA: multigenic transcription in higher organisms. EMBO J. 16, 2023–2031 (1997). 55. Hatfield, D. L. & Gladyshev, V. N. How selenium has altered our understanding of the genetic code. Mol. Cell. Biol. 22, 3565–3576 (2002). 56. Kryukov, G. V. et al. Characterization of mammalian selenoproteomes. Science 300, 1439–1443 (2003). 57. Copeland, P. R. Regulation of gene expression by stop codon recoding: selenocysteine. Gene 312, 17–25 (2003). 58. Castellano, S. et al. In silico identification of novel selenoproteins in the Drosophila melanogaster genome. EMBO Rep. 2, 697–702 (2001). 59. von der Haar, T. & Tuite, M. F. Regulated translational bypass of stop codons in yeast. Trends Microbiol. 15, 78–86 (2007). 60. Luo, G. X. et al. A specific base transition occurs on replicating hepatitis delta virus RNA. J. Virol. 64, 1021–1027 (1990). 61. Casey, J. L. & Gerin, J. L. Hepatitis D virus RNA editing: specific modification of adenosine in the antigenomic RNA. J. Virol. 69, 7593–7600 (1995). 62. Steneberg, P. et al. Translational readthrough in the hdc mRNA generates a novel branching inhibitor in the Drosophila trachea. Genes Dev. 12, 956–967 (1998). 63. Bass, B. L. RNA editing by adenosine deaminases that act on RNA. Annu. Rev. Biochem. 71, 817–846 (2002). 64. Ivanov, I. P. et al. The Drosophila gene for antizyme requires ribosomal frameshifting for expression and contains an intronic gene for snRNP Sm D3 on the opposite strand. Mol. Cell. Biol. 18, 1553–1561 (1998). 65. Eddy, S. R. Non-coding RNA genes and the modern RNA world. Nature Rev. Genet. 2, 919–929 (2001). 66. Yuan, G. et al. RNomics in Drosophila melanogaster: identification of 66 candidates for novel non-messenger RNAs. Nucleic Acids Res. 31, 2495–2507 (2003). 67. Lestrade, L. & Weber, M. J. snoRNA-LBME-db, a comprehensive database of human H/ACA and C/D box snoRNAs. Nucleic Acids Res. 34 (Database issue), D158–D162 (2006). 68. Bier, E. Drosophila, the golden bug, emerges as a tool for human genetics. Nature Rev. Genet. 6, 9–23 (2005). 69. Hoopengardner, B., Bhalla, T., Staber, C. & Reenan, R. Nervous system targets of RNA editing identified by comparative genomics. Science 301, 832–836 (2003). 70. Mignone, F. et al. UTRdb and UTRsite: a collection of sequences and regulatory motifs of the untranslated regions of eukaryotic mRNAs. Nucleic Acids Res. 33 (Database issue), D141–D146 (2005). 71. Cohen, R. S., Zhang, S. & Dollar, G. L. The positional, structural, and sequence requirements of the Drosophila TLS RNA localization element. RNA 11, 1017–1029 (2005). 72. Allemand, F. et al. Escherichia coli ribosomal protein L20 binds as a single monomer to its own mRNA bearing two potential binding sites. Nucleic Acids Res. 35, 3016–3031 (2007). 73. Okumura, T., Matsumoto, A., Tanimura, T. & Murakami, R. An endoderm-specific GATA factor gene, dGATAe, is required for the terminal differentiation of the Drosophila endoderm. Dev. Biol. 278, 576–586 (2005). 74. Park, S. W. et al. An evolutionarily conserved domain of roX2 RNA is sufficient for induction of H4-Lys16 acetylation on the Drosophila X chromosome. Genetics (in the press). 75. Park, Y. & Kuroda, M. I. Epigenetic aspects of X-chromosome dosage compensation. Science 293, 1083–1085 (2001). 76. Berezikov, E., Cuppen, E. & Plasterk, R. H. Approaches to microRNA discovery. Nature Genet. 38 (Suppl 1), S2–S7 (2006). 77. Bartel, D. P. MicroRNAs: genomics, biogenesis, mechanism, and function. Cell 116, 281–297 (2004). 78. Stark, A. et al. Systematic discovery and characterization of fly microRNAs using 12 Drosophila genomes. Genome Res. doi:10.1101/gr.6593807 (in the press). 79. Ruby, J. G. et al. Evolution, biogenesis, expression, and target predictions of a substantially expanded set of Drosophila microRNAs. Genome Res. doi:10.1101/ gr.6597907 (in the press). 80. Pekarsky, Y. et al. Tcl1 expression in chronic lymphocytic leukemia is regulated by miR-29 and miR-181. Cancer Res. 66, 11590–11593 (2006). 81. Ruby, J. G., Jan, C. H. & Bartel, D. P. Intronic microRNA precursors that bypass Drosha processing. Nature 448, 83–86 (2007).
231 ©2007 Nature Publishing Group
ARTICLES
NATURE | Vol 450 | 8 November 2007
82. Okamura, K. et al. The mirtron pathway generates microRNA-class regulatory RNAs in Drosophila. Cell 130, 89–100 (2007). 83. Lewis, B. P. et al. Prediction of mammalian microRNA targets. Cell 115, 787–798 (2003). 84. Stark, A., Brennecke, J., Russell, R. B. & Cohen, S. M. Identification of Drosophila microRNA targets. PLoS Biol. 1, E60 (2003). 85. Lai, E. C. Micro RNAs are complementary to 39 UTR sequence motifs that mediate negative post-transcriptional regulation. Nature Genet. 30, 363–364 (2002). 86. Lewis, B. P., Burge, C. B. & Bartel, D. P. Conserved seed pairing, often flanked by adenosines, indicates that thousands of human genes are microRNA targets. Cell 120, 15–20 (2005). 87. Tompa, M. Identifying functional elements by comparative DNA sequence analysis. Genome Res. 11, 1143–1144 (2001). 88. Stormo, G. D. DNA binding sites: representation and discovery. Bioinformatics 16, 16–23 (2000). 89. Kheradpour, P., Stark, A., Roy, S. & Kellis, M. Reliable prediction of regulator targets using 12 Drosophila genomes. Genome Res. doi:10.1101/gr.7090407 (in the press). 90. Stathopoulos, A. & Levine, M. Genomic regulatory networks and animal development. Dev. Cell 9, 449–462 (2005). 91. Schroeder, M. D. et al. Transcriptional control in the segmentation gene network of Drosophila. PLoS Biol. 2, e271 (2004). 92. Zeitlinger, J. et al. Whole-genome ChIP-chip analysis of Dorsal, Twist, and Snail suggests integration of diverse patterning processes in the Drosophila embryo. Genes Dev. 21, 385–390 (2007). 93. Kanehisa, M. et al. The KEGG resource for deciphering the genome. Nucleic Acids Res. 32 (Database issue) D277–D280 (2004). 94. Berman, B. P. et al. Exploiting transcription factor binding site clustering to identify cis-regulatory modules involved in pattern formation in the Drosophila genome. Proc. Natl Acad. Sci. USA 99, 757–762 (2002). 95. Markstein, M. et al. A regulatory code for neurogenic gene expression in the Drosophila embryo. Development 131, 2387–2394 (2004). 96. Philippakis, A. A. et al. Expression-guided in silico evaluation of candidate cis regulatory codes for Drosophila muscle founder cells. PLoS Comput. Biol. 2, e53 (2006). 97. Smale, S. T. & Kadonaga, J. T. The RNA polymerase II core promoter. Annu. Rev. Biochem. 72, 449–479 (2003). 98. Gerber, A. P. et al. Genome-wide identification of mRNAs associated with the translational regulator PUMILIO in Drosophila melanogaster. Proc. Natl Acad. Sci. USA 103, 4487–4492 (2006). 99. Zubiaga, A. M., Belasco, J. G. & Greenberg, M. E. The nonamer UUAUUUAUU is the key AU-rich sequence motif that mediates mRNA degradation. Mol. Cell. Biol. 15, 2219–2230 (1995). 100. Fairbrother, W. G., Yeh, R. F., Sharp, P. A. & Burge, C. B. Predictive identification of exonic splicing enhancers in human genes. Science 297, 1007–1013 (2002). 101. Kloosterman, W. P., Wienholds, E., Ketting, R. F. & Plasterk, R. H. Substrate requirements for let-7 function in the developing zebrafish embryo. Nucleic Acids Res. 32, 6284–6291 (2004). 102. Grimson, A. et al. MicroRNA targeting specificity in mammals: determinants beyond seed pairing. Mol. Cell 27, 91–105 (2007). 103. Farh, K. K. et al. The widespread impact of mammalian MicroRNAs on mRNA repression and evolution. Science 310, 1817–1821 (2005). 104. Stark, A. et al. Animal microRNAs confer robustness to gene expression and have a significant impact on 39 UTR evolution. Cell 123, 1133–1146 (2005). 105. Rajewsky, N. microRNA target predictions in animals. Nature Genet. 38 (suppl. 1), S8–S13 (2006). 106. Elnitski, L. et al. Distinguishing regulatory DNA from neutral sites. Genome Res. 13, 64–72 (2003). 107. Abrams, E. W. & Andrew, D. J. CrebA regulates secretory activity in the Drosophila salivary gland and epidermis. Development 132, 2743–2758 (2005). 108. Sandmann, T. et al. A temporal map of transcription factor activity: mef2 directly regulates target genes at all stages of muscle development. Dev. Cell 10, 797–807 (2006). 109. Sandmann, T. et al. A core transcriptional network for early mesoderm development in Drosophila melanogaster. Genes Dev. 21, 436–449 (2007). 110. Sethupathy, P., Corda, B. & Hatzigeorgiou, A. G. TarBase: A comprehensive database of experimentally supported animal microRNA targets. RNA 12, 192–197 (2006). 111. Lee, T. I. et al. Control of developmental regulators by Polycomb in human embryonic stem cells. Cell 125, 301–313 (2006). 112. Boyer, L. A. et al. Core transcriptional regulatory circuitry in human embryonic stem cells. Cell 122, 947–956 (2005). 113. Aerts, S., van Helden, J., Sand, O. & Hassan, B. Fine-tuning enhancer models to predict transcriptional targets across multiple genomes. PLoS ONE 2 (11), e1115 (2007). 114. Maeder, M., Polansky, B., Robson, B. & Eastman, D. Phylogenetic footprinting analysis in the upstream regulatory regions of the Drosophila Enhancer of split genes. Genetics (in the press). 115. Van Doren, M. et al. Negative regulation of proneural gene activity: hairy is a direct transcriptional repressor of achaete. Genes Dev. 8, 2729–2742 (1994). 116. Kraut, R. & Levine, M. Spatial regulation of the gap gene giant during Drosophila development. Development 111, 601–609 (1991).
117. Bailey, A. M. & Posakony, J. W. Suppressor of hairless directly activates transcription of enhancer of split complex genes in response to Notch receptor activity. Genes Dev. 9, 2609–2622 (1995). 118. Yin, Z. & Frasch, M. Regulation and function of tinman during dorsal mesoderm induction and heart specification in Drosophila. Dev. Genet. 22, 187–200 (1998). 119. Margulies, E. H. et al. An initial strategy for the systematic identification of functional elements in the human genome by low-redundancy comparative sequencing. Proc. Natl Acad. Sci. USA 102, 4795–4800 (2005). 120. Margulies, E. H., Chen, C. W. & Green, E. D. Differences between pair-wise and multi-sequence alignment methods affect vertebrate genome comparisons. Trends Genet. 22, 187–193 (2006). 121. Farabaugh, P. J. Programmed translational frameshifting. Annu. Rev. Genet. 30, 507–528 (1996). 122. Odom, D. T. et al. Tissue-specific transcriptional regulation has diverged significantly between human and mouse. Nature Genet. 39, 730–732 (2007). 123. Ludwig, M. Z. & Kreitman, M. Evolutionary dynamics of the enhancer region of even-skipped in Drosophila. Mol. Biol. Evol. 12, 1002–1011 (1995). 124. Ludwig, M. Z. et al. Functional evolution of a cis-regulatory module. PLoS Biol. 3, e93 (2005). 125. The ENCODE Project Consortium.. Identification and analysis of functional elements in 1% of the human genome by the ENCODE pilot project. Nature 447, 799–816 (2007). 126. Kent, W. J. et al. The human genome browser at UCSC. Genome Res. 12, 996–1006 (2002).
Supplementary Information is linked to the online version of the paper at www.nature.com/nature. Acknowledgements We thank the National Human Genome Research Institute (NHGRI) for continued support. A.S. was supported in part by the Schering AG/ Ernst Schering Foundation and in part by the Human Frontier Science Program Organization (HFSPO). P.K. was supported in part by a National Science Foundation Graduate Research Fellowship. J.S.P. thanks B. Raney and R. Baertsch, and the Danish Medical Research Council and the National Cancer Institute for support. J.B. thanks the Schering AG/Ernst Schering Foundation for a postdoctoral fellowship. L.Parts thanks J. Vilo. S.R. was supported by a HHMI-NIH/NIBIB Interfaces Training Grant and thanks T. Lane and M. Werner-Washburne. D.H., D.P.B., G.J.H. and T.C.K. are Investigators of the Howard Hughes Medical Institute, and B.P., J.G.R., E.H. and J.B. are affiliated with these investigators. J.W.C. and S.E.C. were supported by the NHGRI. M.K. was supported by start-up funds from the MIT Electrical Engineering and Computer Science Laboratory, the Broad Institute of MIT and Harvard, and the MIT Computer Science and Artificial Intelligence Laboratory, and by the Distinguished Alumnus (1964) Career Development Professorship. Author Contributions Organizing committee: Manolis Kellis, William Gelbart, Doug Smith, Andrew G. Clark, Michael E. Eisen, Thomas C. Kaufman; protein-coding gene prediction: Michael F. Lin, Ameya N. Deoras, Mira V. Han, Matthew W. Hahn, Donald G. Gilbert, Michael Weir, Michael Rice, Manolis Kellis; manual curation of protein-coding genes: Madeline A. Crosby, Harvard FlyBase curators, William M. Gelbart; validation of protein-coding genes: Joseph W. Carlson, Berkeley Drosophila Genome Project, Susan E. Celniker; non-coding RNA gene prediction: Jakob S. Pedersen, David Haussler, Yongkyu Park, Seung-Won Park, Manolis Kellis; microRNA gene prediction: Alexander Stark, Pouya Kheradpour, Leopold Parts, Manolis Kellis; microRNA cloning and sequencing: Julius Brennecke, Emily Hodges, Gregory J. Hannon; microRNA target prediction: Alexander Stark, J. Graham Ruby, Manolis Kellis, Eric C. Lai, David P. Bartel; motif identification: Alexander Stark, Pouya Kheradpour, Manolis Kellis; motif instance prediction: Alexander Stark, Pouya Kheradpour, Sushmita Roy, Morgan L. Maeder, Benjamin J. Polansky, Bryanne E. Robson, Deborah A. Eastman, Stein Aerts, Bassem Hassan, Jacques van Helden, Manolis Kellis; genome alignments: Angie S. Hinrichs, W. James Kent, Anat Caspi, Lior Pachter, Colin N. Dewey, Benedict Paten; phylogeny and branch length estimation: Matthew D. Rasmussen, Manolis Kellis; final manuscript preparation: Alexander Stark, Michael F. Lin, Pouya Kheradpour, Jakob Pedersen, Manolis Kellis. Author Information Reprints and permissions information is available at www.nature.com/reprints. Correspondence and requests for materials should be addressed to M.K. (
[email protected]).
Harvard FlyBase curators Madeline A. Crosby1, Beverley B. Matthews1, Andrew J. Schroeder1, L. Sian Gramates1, Susan E. St Pierre1, Margaret Roark1, Kenneth L. Wiley Jr1, Rob J. Kulathinal1, Peili Zhang1, Kyl V. Myrick1, Jerry V. Antone1 & William M. Gelbart1 Berkeley Drosophila Genome Project Joseph W. Carlson2, Charles Yu2, Soo Park2, Kenneth H. Wan2 & Susan E. Celniker2 1 FlyBase, The Biological Laboratories, Harvard University, 16 Divinity Avenue, Cambridge, Massachusetts 02138, USA. 2BDGP, LBNL, 1 Cyclotron Road MS 64-0119, Berkeley, California 94720, USA.
232 ©2007 Nature Publishing Group