African Journal of Business Management Vol. 5(16), pp. 6801-6813, 18 August, 2011 Available online at http://www.academicjournals.org/AJBM DOI: 10.5897/AJBM10.1396 ISSN 1993-8233 ©2011 Academic Journals
Full Length Research Paper
Artificial immune algorithm-based approach to recognizing unnatural patterns among autocorrelated characteristics Hui-Ping Cheng* and Chuen-Sheng Cheng 1
Department of Business Innovation and Development, MingDao University, 369 Wen-Hua Rd., Peetow, Changhua 52345, Taiwan. 2 Department of Industrial Engineering and Management, Yuan-Ze University, 135 Yuan-Tung Rd., Chung-Li, Taoyuan 320, Taiwan. Accepted 24 February, 2011
A control chart is a tool for statistical process control (SPC) used to determine variations in manufacturing processes resulting from common or assignable causes. The presence of unnatural patterns in control charts is an indication that the process has been influenced by assignable causes, and corrective actions must be taken. However, the assumption of uncorrelated or independent observations is not suitable for all of the characteristics pertaining to a product. This study presents a method with which to improve the accuracy of pattern recognition in control charts, through the autocorrelation of product characteristics. Particularly, we developed an artificial algorithm-based machine learning model to recognize unnatural patterns and processes in AR(1) simultaneously. The proposed method integrates an artificial immune system and support vector machine within a recognition system. This study evaluated the accuracy with which four patterns could be recognized. The four patterns include trends, sudden shifts, cyclic patterns, and normal patterns. Identifying unnatural patterns can greatly narrow the range of possible causes that must be investigated, thereby speeding up the diagnostic processes. Keyword: Pattern recognition, artificial immune algorithm, support vector machine, autocorrelation. INTRODUCTION Statistical process control (SPC) is a popular management resource employed throughout the manufacturing sector (Cheng, 1997; Woodall and Montgomery, 1999; Stoumbos et al., 2000; Montgomery, 2005). Control charts play an essential role in monitoring critical quality characteristics. When a Shewhart control chart shows that a point falls outside the limits of control or an unnatural pattern appears (also as known as abnormal pattern or non-random variation), the process lies in an out-of-control state. Figure 1 illustrates various representative unnatural patterns found in traditional univariate control charts: trends, sudden shifts, mixtures, cyclic patterns, and systematic variations. A complete description
*Corresponding author, E-mail:
[email protected].
of unnatural patterns in control charts can be found in the Statistical Quality Control Handbook (Western Electric, 1956). Because these unnatural patterns are due to distinct variations in a process, they provide valuable information with which to improve the quality of a product. An unnatural pattern in a control chart is often associated with a specific set of assignable causes, which must be swiftly identified before corrective action can be undertaken. Over the years, researchers have developed a number of supplementary rules, known as zone tests or run tests, to analyze patterns in control charts (Nelson, 1984; Western Electric, 1956). Pattern recognition in control charts usually requires skilled and experienced quality control engineers to identify unnatural patterns in a manufacturing process. These tests enable the detection of unnatural patterns, but provide no indication as to the
6802
Afr. J. Bus. Manage.
(a) Normal pattern
(b) Increasing trend
(c) Decreasing trend
(d) Upward sudden shift
(e) Downward sudden shift
(f) Mixture
(g) Cyclic pattern
(h) Systemati c pattern
Figure 1. Examples of univariate patterns in control charts (in non-autocorrelated processes).
precise nature of the difficulties. It is very difficult to find a one-to-one mapping relationship between a supplementary rule and an unnatural pattern (Cheng, 1997). Montgomery (2005) pointed out that the regular use of supplementary tests may increase the risk of false alarms. Therefore, an efficient automated pattern recognition system could help to ensure consistency, decrease the number of false alarms, and improve the benefits of implementing control charts. Researchers have proposed various approaches to recognizing patterns in control charts: statistical approaches (Cheng and Hubele, 1996; Yang and Yang, 2005), rule-based expert systems (Cheng, 1989) and artificial neural networks. A number of supervised neural networks (that is, back-propagation neural networks (BPNNs), and learning vector quantization (LVQ) networks) have been successfully implemented in previous studies (Pham and Oztemel, 1994; Cheng, 1997; Guh and Hsieh, 1999; Yang and Yang, 2002; Sancak, 2009). These neural networks learn to recognize patterns during a training phase involving representative examples. Unsupervised neural networks can be used to cluster data into groups with similar features. Self-organizing maps (SOMs) and adaptive resonance theory (ART) networks are often applied to
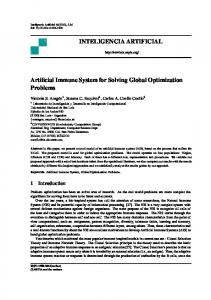
classify unnatural patterns (Kuo et al., 2002; Pacella et al., 2004). When traditional control charts are used, there is an implicit assumption that observations are independently and identically distributed (iid) over time (Montgomery, 2005). Nevertheless, the assumption of uncorrelated or independent observations is not appropriate for all manufacturing processes (Alwan and Roberts, 1988). In situations such as chemical processes, consecutive observations of a process or product are often highly correlated, and in automated testing and inspection procedures, every quality characteristic is measured for every production unit. Figures 2 and 3 illustrate unnatural patterns in control charts AR(1) (the autoregressive process of lag 1 time series model) processes with autoregressive coefficients = 0.7 and = -0.7, respectively. These figures show the obvious influence of autocorrelation on control charts. Many researchers (Cook and Chiu, 1998; Chiu et al., 2001; Cook et al., 2001; Noorossana et al., 2003; Hwarng, 2004; Hwarng, 2005; Jandaghi et al., 2010) have proposed the use of time series analysis to identify unnatural patterns in correlated data. Cook and Chiu (1998) presented a classifier based on radial basis function (RBF) to detect mean shift patterns in autocorrelated
Cheng and Cheng
3
6803
2.0 4
-0.5
0
2
-3.0
0 3 1
9
18
27
1
(a) Normal pattern
9
18
27
1
(b) Increasi ng trend
9
18
27
(c) Decreasi ng trend
5
0
5
5
0
0
-5
5 1
9
18
27
-5 1
(d) Cycli c pattern
9
18
27
1
9
(e) Systematic pattern
18
27
(f) Mixture
3
4 0
2 -3
0 1
9
18
27
(g) Upward shi ft Figure 2. Patterns in control charts in AR(1) processes (
1
9
18
27
(h) Downward shift
= 0.7).
manufacturing processes. Their results indicate that RBF classifiers are a substantial improvement over the SPC control charts for correlated data. Cook et al. (2001) extended the work of Cook and Chiu (1998) to the classification of shifted data in AR(1) processes. Cook et al. (2001) developed a BPNN model to identify shifts in variance among correlated process parameters. They concluded that networks increase considerably the classification capabilities for both shifted and non-shifted data. Chiu et al. (2001) adopted a BPNN to identify mean shifts in the values of process parameters in AR(1) time series models using various values for the autoregressive coefficient . They found that neural networks are able to recognize 1 σ , 2 σ , and 3 σ shifts for autocorrelation coefficients between -0.9 and 0.7. However, neural networks are unable to classify the shifted data in cases of highly positive autocorrelation. Noorossana et al. (2003) proposed a model comprising two serial RBF networks to detect and classify three types of nonrandom disturbance in AR(1) processes: additive outlier, innovational outlier, and level shift. Hwarng (2004) presented a BPNN approach to monitor mean shifts in processes involved in autocorrelation. Hwarng (2005) extended this research to the simultaneous identification of mean shift and changes
in correlation related to AR(1) processes. In his approach, identifiers associated with change in parameters are trained using a back-propagation algorithm. However, other patterns, such as trends, mixtures, cyclic patterns, or systematic variation have not been addressed. Support vector machines (SVMs) have recently been introduced as a technique for solving a variety of learning, classification, and prediction problems. To address the monitoring of manufacturing processes, Burges (1998) introduced a linear SVM applied to separable and nonseparable data related to pattern recognition problems. This SVM achieved very large Vapnik Chervonenkis (VC) dimensions through computation and provided good generalization performance. Chinnam (2002) demonstrated how SVM is able to detect shifts in papermaking and viscosity data. The SVM proposed by Chinnam (2002) minimized both Type I errors and Type II errors in correlated and non-correlated processes. Lo (2008) discussed the p control chart to minimize the number of complaints by providing exceptional service quality in the implementation of websites. The SVM mechanism enabled the automatic filtering of information associated with complaints with a high degree of accuracy, to enhance the productivity of the service department, and improve
6804
Afr. J. Bus. Manage.
5.0
3
2.5
0
0.0 -3
1
9
18
27
1
9
(a) Normal pattern
1
9
18
18
27
1
9
(b) Increasing trend
27
5
5
0
0
-5
-5 1
(d) Cyclic pattern
9
18
27
1
9
(e) Systematic pattern
0
4
5
0
18
27
(c) Decreasing trend
18
27
(f) Mixture
0 -4
1
9
18
27
1
(g) Upward shi ft Figure 3. Patterns in control charts in AR(1) processes (
9
18
27
(h) Downward shift
= 0.7).
customer satisfaction. Cheng and Cheng (2008a) have recently developed two classifiers based on the multiclass SVM and BPNN for identifying the source of shifts in variance in multivariate processes. The SVM scheme addresses the issue of interpreting out-of-control signals in multivariate control charts. The above studies indicate that SVM is capable of performing generalization processes efficiently and effectively without the need for a priori knowledge, even when the dimensions of the input space are large. For this reason, SVMs are well suited to binary or multiclass classification problems, yielding excellent generalization performance both in theory and practice (Burges, 1998; Chinnam, 2002; Hsu and Lin, 2002; Widodo and Yang, 2007; Lo, 2008; Cheng and Cheng, 2008a). Unnatural patterns provide valuable information regarding potentialities associated with process monitoring and the improvement of quality in managerial practices. It is well documented that each unnatural pattern on a control chart is often associated with a specific set of assignable causes (Western Electric 1958). However, the interpretation of process data remains problematic because it involves various aspects of pattern recognition, relying on the skills and experience of analysts to determine
whether an unnatural pattern exists. Such situations increase the difficulties associated with managerial practice. It is clear that previous studies have failed to provide a usable framework, and single variable models are inadequate to explain unnatural patterns. One important motivation behind this research was the growing interest in intelligent diagnostic systems. In such systems, sensors are used to capture data and the rapid interpretation of that data is critical. The analysis of process data must be completed in real-time with little or no human intervention, if it is to reduce the time required for decision-making. The proposed pattern recognition system is capable of identifying unnatural patterns to assist in the correction of assignable causes in automated manufacturing environments where the collection of data is performed automatically. With this approach, processes are monitored by a computer-based pattern recognition system in real-time, operating on-line. Managers and experts are alerted only when the process exhibits an unnatural pattern. By aiding or replacing human experts with a pattern recognition algorithm, human intervention is markedly reduced and a truly intelligent manufacturing system can be achieved. The primary objective of this study was to develop a
Cheng and Cheng
novel approach to improving the recognition of patterns in control charts with regard to autocorrelated processes. The efficiency of this system and the benefits it provides were then investigated and compared. Artificial immune systems (AISs) can be successfully implemented in fields such as classification, regression, clustering, and pattern recognition; however, they have never been used in the field of control chart pattern recognition, until now. In fact, AISs have not even been considered for pattern recognition in time series problems. This paper contributes to the literature related to pattern recognition in control charts by developing a novel recognition system, combining an artificial immune system with a support vector machine, thereby establishing a foundation on which to base future research into autocorrelation processes with positive or negative . This study presents an AIS-based machine learning approach to recognizing unnatural patterns and processes in AR(1) simultaneously. The proposed approach combines AIS and SVM in a recognition system. The AIS is responsible for clustering, cloning, and mutating the unnatural patterns, while the SVM identifies patterns promptly and accurately. The proposed AIS-based machine learning recognition system comprises three primary strategies. First, time series datasets with autocorrelated unnatural patterns are generated. Next, pre-processing converts all datasets into standardized, normalized procedures, and establishes an AIS-based machine learning system for the recognition of patterns in control charts. Finally, the proposed method identifies four patterns (including trends, sudden shifts, cyclic patterns, and normal patterns) to evaluate the accuracy of the recognition tasks performed. ARTIFICIAL IMMUNE SYSTEMS AISs emerged in the 1990s as a new field in computational research. AnAIS is an adaptive soft computing paradigm inspired by biological immunity theory outlining several principles, models, and practical applications (Timmis et al., 2000; de Castro and Timmis, 2003; Timmis et al., 2008). A natural immune system is a pattern recognition system with various functional components positioned in strategic locations throughout the human body. The primary function of the immune system is to maintain the body in homeostasis using the neural and endocrine systems (Timmis et al., 2000; de Castro and Timmis, 2002; Timmis, 2007). The immune system regulates the defense mechanisms of the body through innate and adaptive immune response. Adaptive immune responses are critical for humans, comprising diverse functions such as recognition, memory acquisition, diversity, and self-regulation. The architects of adaptive immune responses are lymphocytes, which can be divided into two classes: B and T lymphocytes (cells). In studies conducted in the field of AISs, the most common method has been to shape B cells. These B cells are significant because they secrete antibodies that play a
6805
critical role in adaptive immune response (Timmis et al., 2000). Previous researchers have proposed a number of presentation methods. For example, de Castro and Timmis (2002) presented detailed practical applications of such immune systems. The shape space model (denoted by R) quantitatively describes the interactions among antigens and foreign invaders entering the body (such as microbes and antibodies). The set of features characterizing a molecule is called its generalized shape. The affinity between cells and antigens (binary or realvalued) determines a distance measure that can be used to calculate the degree to which these molecules interact. Mathematically, the generalized shape space of a molecule (denoted by M), be it an antibody or an antigen, can be depicted by a set of coordinates M = M1, M2….Mp, l
and the M ∈ R can be regarded as a point in an ℓ -dimensional real-valued shape space. In general, antigens and antibodies are assumed to have the same length ℓ. The length, cell characteristics, and representation depend on the given problem (Şahan et al., 2004; Polat et al., 2007; Şahan et al., 2007). These studies attempted to identify deficiencies in proposed AIS algorithms, by developing attribute weighted artificial immune systems (AWAIS). Şahan et al. (2004) calculated weights using statistical information from a dataset, that is, standard deviation and the mean of attributes. AWAIS provided superior results over those of other methods in the literature, but no better than state-of-the-art methods. For pattern recognition, Dasgupta et al. (2005) and Wang et al. (2009) developed various methods based on AISs that proved efficient and flexible in the detection of novel patterns. Several researchers have proposed frameworks and design principles regarding the suitability of AISs as an adaptive soft computing paradigm and reviewed those studies integrating AIS with artificial neural networks, evolutionary algorithms, and fuzzy systems (de Castro and Timmis, 2003; van den Berg, 2009). Timmis et al. (2008) studied the advantages of AIS algorithms, including clone selection, immune network, and negative selection algorithms. Hart and Timmis (2008) summarized the areas in which AISs may be applied, suggesting a set of problem features for the development of AISs, and defining a unique niche for them. AISs can be used in fields such as classification, regression, clustering, and pattern recognition; however, they have never been used in the field of control chart pattern recognition, until now. In fact, AISs have not been considered for pattern recognition in time series problems. Generation of training datasets In autocorrelated processes In practice, the available training datasets of unnatural patterns in real-world situations may be inadequate (Alam, 2009; Jandaghi et al., 2010; Ozturk et al., 2010). Previous researchers have recommended generating training datasets using predefined mathematical models (Cheng, 1997). In this study, the entire procedure of simulation consists of generating autocorrelated process datasets and unnatural patterns. This study adopted the autoregressive
6806
Afr. J. Bus. Manage.
Table 1 Parameters of training examples for unnatural patterns.
Pattern type Increasing trend Decreasing trend Upward shift Downward shift Cyclic pattern
Parameters Gradient: 0.05 to 0.15 Gradient: -0.15to -0.05 Shift magnitude: 0.5 to 3.0 Shift magnitude: -3.0 to -0.5 Amplitude: 0.5 to 3.0; period: 12
process of lag 1 (denoted by AR(1)) because it often appears in general manufacturing processes. An interpretation of AR(1) processes can be defined by the following equation:
X t = µ + φ ( X t −1 − µ ) + ε t
(1)
where Xt is the time series observation at time t, µ represents a known mean process of the data series, Xt-1 is the time series observation at time t-1, εt is independent random noise and is the autoregressive coefficient at the interval between -1 and 1. This study analyzed four common unnatural patterns (including six classes) found in control charts: increasing trend, decreasing trends, cyclic patterns, upward shift and downward shifts. Note that the cyclic patterns include both a sine wave and cosine wave to distinguish various wave directions. Monte Carlo simulation was used to generate various unnatural patterns. The pattern generator comprised Eq. (1) in a mathematical formula expressed as;
X t = µ + φ ( X t −1 − µ ) + ε t + dt t
(2)
where dt t is a special disturbance at time t due to an assignable cause. Note the pattern parameters are expressed in terms of σ X , where
σX
σX =
σ ε2 1− φ 2
is defined as;
(3)
The generations of six types of dtt are defined as follows; (i) Increasing trends and decreasing trends: The trends can be expressed as; dtt = η t , where η is the trend slope. (ii) Cyclic patterns (including sine waves and cosine waves as components): cyclic patterns can be modeled as;
Increment 0.01 0.01 0.25 0.25 0.25
No. of training cases 1650 1650 1650 1650 1650
mean shift. The selection of training examples for unnatural patterns is complex, involving many parameters and considering multiple patterns simultaneously. A number of issues must be carefully addressed to obtain an adequate dataset for training (Alam, et al., 2009). In general, the training datasets of recognition systems should consider an equal number of training examples for each type of pattern, a wide spectrum of pattern parameters, and a sufficient number of examples during the training procedure. Table 1 shows the parameters used for simulating unnatural patterns. This study also considered AR(1) processes with various positive and negative autocorrelation coefficients covering the entire range of parameters for each type of pattern. Note that the change point in unnatural patterns was a uniformly distributed random variable ranging between 1 and 8. The random setting in the change point was implemented to enhance the learning capability of the pattern recognition system. This was a practical approach because unnatural patterns often occur after a period in which the process is in-control, and the starting point of an unnatural pattern is usually unknown beforehand (Cheng, 1997). The simulation used in this study was implemented with MATLAB (MathWorks, 2004) software. The proposed methodology used the concept of “moving windows” for the task of recognition. The quantity of data in a sequence made available to the neural network is referred to as the window size (denoted by m ) (Cheng, 1995). The input to the recognition system was a sequence of moving windows for observing process data. The recognition system began the process of diagnosis based on the most recent m observations. The determination of appropriate window size was a crucial step in the current research. It was desirable to minimize the size of the window to reduce computational demands; although, a larger window size would enable the recognition systems to identify smaller shifts. To date, no consensus has been reached among researchers regarding window size, and in the reviewed literature, this value has ranged between 8 and 60. Previous studies and our preliminary investigations indicate that increasing the size of the window does not necessarily improve performance. Therefore, we adopted window size of 32 for this study. Moreover, all variables were scaled, such that each process variable had a mean of zero and variance of one.
dtt = τ ⋅ sin(2π t / Ω) where
τ
is the amplitude of the cyclic patterns, and the symbol Ω is defined as the period of the cyclic pattern.
(iii) Upward shift and downward shifts: Sudden shifts can be written as;
dtt = ω∆ where ω represents a parameter used to determine the occurrence of shifting, the ω=0 for non-shifting and ω=1 for shifting cases, respectively. The quantity ∆ is defined as the magnitude of the
AIS-Based machine learning recognition system Artificial immune algorithm This study applied the artificial immune system developed by Timmis et al. (2008), with the intent of determining the primary and second stimulus for the current B cell. The concept of artificial recognition balls (ARBs) was also considered in this procedure. An ARB is a representation of a number of identical B cells. All ARBs depend on stimulation level as determined through an evaluation of affinity. If an ARB misses all B cells, this is an indication that the data has been learned and removed from the immune network. The artificial immune training algorithm comprised the following steps:
Cheng and Cheng
Initialization and stimulation: First, all of the input data were normalized to ensure that the Euclidean distance between two data points was in the interval [0, 1] using a simple linear transformation. The primary stimulus was the affinity between the current B cell and the pathogen (denoted by training datasets), defined as;
ps p ,l = (1 − pd p ,l )
, where
ps p , l
between these two cells. The variable
different class, and in so doing, a network connecting B cells is created. This step continues until the average stimulation value of all classes exceeds the stimulation threshold, written as follows. ARB i
∑ Sl
represents the affinity
pd p , l
represents the
distance between two items in normalized data and must be restricted to the interval [0, 1]. The second stimulus for the B cell is the measurement of affinity between the B cell and its adjacent n
ss p , q = ∑ (1 − dis p , q ) q =0 neighbors, which can be defined as , where ss p , q denotes the summation of the B cell stimulated by its
6807
NAT i = θ
p, j
j =1
ARB i
(6)
where NAT, is the stimulation threshold for the i th class and θ represents the rate of mutation and 0 ≤ θ ≤ 1 . ARB is the number
i th class. Sl p , j j th ARB pool of the i th class.
of ARBs belonging to the of the
is the stimulation level
neighbors, dis p , q is the distance between the specific B cell and the
q th neighbor,
and
n
is the number of links to the current B
cell. The specific B cell may also be suppressed by loosely connected neighbors. This process is named the “suppression n
factor” and can be expressed as;
sf p , q = −∑ dis p , q .
Therefore,
q =0
the stimulation level
Sl p
can be written as; n
n
q =0
q=0
Sl p = ps p ,l + ss p , q + sf p , q = 1 − pd p ,l + ∑ (1 − disp , q ) − ∑ dis p , q (4) Once the stimulation level of the current B cell exceeds the threshold, the cell moved into the clone phase. Memory cell identification and B cell cloning: The link between nodes in the AIS represents the affinity between two B cells, which can be defined in Eq. (5), resulting in values with higher affinities for lower Euclidean distances.
∑ (a x =1
x
Building the immune network: Once the AIS has completed one training cycle, the network of expressed B cells is more robust than before. Test for stimulation threshold is repeated to test the stimulation threshold until it is exceeded by all classes, at which point the artificial immune network has been established. The training algorithm is shown in Figure 4. The proposed method combines AIS and SVM as a recognition system to detect and identify unnatural patterns in AR(1) processes. Figure 5 illustrates an example of AIS clustering results. Linear and nonlinear separation are demonstrated in Figures 5(a) and 5(b) respectively. Next, the SVM is used to transform the data into a higher dimensional space to obtain the optimal hyperplane in the space maximizing the margin between classes.
Support vector machine and training process
l
affinity ( a , b) = 1 −
The candidate memory cell is merged with the initial memory cell: After all of the stimulation values in all classes reach the stimulation threshold, the best ARB in the same class as the antigen is taken as a candidate memory cell. Here, the AIS population comprises two sub-populations: the initial population and the clone population.
− bx ) 2 (5)
where l represents the number of data dimensions. In practice, the AIS is cloned and mutates B cells to build up a memory of B cells capable of identifying patterns similar to the one that caused the cloning in the first place. Similar B cells are represented using ARBs, and these ARBs, compete with each other for a proportion of fixed resources. In this step, the immune algorithm begins training antigens for iteration. Antigens are capable of memorizing cells, and the memory cell most stimulated by that antigen is cloned. Consequently, the number of clones is determined according to the degree of affinity between the memory cell and antigen. The cloning rate is defined as λ p = κ ( Sl p ) , where κ is a non-zero constant, and λ p is used probabilistically to decide when a clone should be mutated. Test for stimulation threshold: In the test stage, lower affinity ARBs, are eliminated, and this step continues until the required number is equal to the available quantity of resources. The stimulation levels of the remaining ARBs, are tested, and a particular value is designated for classification. If the designated value exceeds the stimulation threshold, then the ARBs, are assigned to a
Support vector machines are a remarkable technique used to solve problems in nonlinear classification, function estimation, and density. They were first introduced by Vapnik (1995) within the context of statistical learning theory to minimize structural risk. In general, classification involves training and testing datasets comprising a number of data instances. We consider a training dataset
{x k , y k } , k = 1,2,3,..., N
input vector,
l
, where x k ∈ R l is the
k
th
denotes the dimension of the input space, and
y k ∈ {−1, + 1} is its corresponding target value (class label). We assumed that training datasets are linearly separable after being mapped into a higher dimensional feature space by a nonlinear function Φ (⋅) . The recognition system is represented by
f ( x) = sgn( Φ ( x )) ⋅ w + b ) , where sgn(⋅)
is the sign function,
w is the vector perpendicular to the hyperplane, and b is a constant. To classify the datasets correctly with the highest degree of generalizability, a separable hyperplane with the largest margin must be constructed: Φ (x k ) ⋅ w + b ≥ 1 for the positive points and
Φ ( x k ) ⋅ w + b ≤ −1
for
the
negative
points.
The
optimal
hyperplane is required to satisfy the following constrained minimization.
6808
Afr. J. Bus. Manage.
Figure 4. AIS training algorithm.
Figure 5. Examples of AIS cluster.
Cheng and Cheng
6809
Table 2. Parameters of AIS-based machine learning recognition system.
Parameter Mutation rate θ Constant of clonal rate K Maximum number of training Stop error Penalty factor C Kernel type Kernel parameter γ
Parameter value 0.5 to 0.9, increment of 0.1 3 to 9, increment of 1 100000 0.00001 10 RBF kernel 0.003125
Overall number of training cases Overall number of test cases
min s.t.
11550 57750
1 w 2 y k (Φ ( x k ) ⋅ w + b ) ≥ 1
where
τ (w ) =
k = 1,2,3,..., N
(7)
Training datasets are not usually linearly separable in reality, even when mapped into a high dimensional feature space. A soft margin is introduced to incorporate the possibility of violation. This leads to the following optimization problem with regard to primal variables
w
and
min s.t.
b. N 1 w + C ∑ ξk k =1 2 y k ( Φ ( x k ) ⋅ w + b) ≥ 1 − ξ k
τ (w ) =
ξ k ≥ 0, k = 1,2,3,..., N
(8)
where C is the penalty parameter of the error term. It is important to note that the variable ξ i is introduced to allow for misclassification due to inequality. They can be viewed as a tuning parameter, used to control the trade-off between maximizing margin and minimizing classification error. By introducing Lagrange multiples, this problem can be transformed into a dual optimization problem; the equation can be written as; N
max
L (α ) = ∑ α i −
αi
is a support vector, representing non-zero values. The
advantage of the kernel function is that it attempts to make the training datasets linearly separable in the higher dimensional feature space to achieve nonlinear separation in the input space. Four typical kernel functions were defined by Burges (1998): the linear kernel, polynomial kernel, sigmoid kernel, and RBF kernel. In our study, each of four kernel functions was compared in terms of recognition performance in the selection of an optimal kernel. To reduce the search space of the parameter sets and enhance performance, we trained all datasets using the RBF kernel. Computational experiments for grid-search were developed using the SVM data mining module of STATISTICA 7.0 (STATISTICA, 2004) software. Table 2 summarizes the parameters adopted for the proposed recognition system. It must be noted that mutation rate θ and cloning rate K increase as the number of iterations increases. The SVM was initially designed for binary classification problems, that is, the data were separated by a hyperplane defined according to a number of support vectors. However, many real-world problems have more than two classes. Hsu and Lin (2002) provided a good tutorial on this issue. Basically, two approaches are usually applied to multiclass classification problems. In the first case, the SVM is modified to incorporate multiclass learning in the quadratic solving algorithm. The SVM treats all classes at the same time, to consider only one optimization problem. Unfortunately, this approach can lead to high computational cost. In the second case, several binary SVM recognition systems are combined. Oneagainst-all and one-against-one classification strategies are used in the second case. The one-against-all method separates each class from all others to build an integrated recognition system. For s class problems, an
1 N α iα j yi y j (Φ ( xi )T ⋅ Φ ( x j )) ∑ 2 i , j =1
s
binary SVM is created. The
i th
SVM is
This equation defines a quadratic programming problem with a unique solution. By defining a kernel function
trained with all samples in the i th class using positive label y = +1 , and all the other samples using negative label y = −1 . The decision function selects the class of a sample corresponding to the maximum value of s binary decision functions specified by the furthest positive hyperplane. Thus, it uses a winner takes-all scheme. The one-against-all method was the earliest approach for multiclass SVM. Another method is the one-against-one consisting of a pairwise classifi-
K (x i , x j ) = Φ (x i ) T Φ ( x j ) ,
cation system. The basic concept considers
i =1
N
0 ≤ α i , j ≤ C , ∑ α i yi = 0
s.t.
i , j =1
(9)
the need to explicitly calculate Φ (⋅)
is avoided. Consequently, the decision function is obtained as follows; N
f ( x) = sgn(∑ α i yi K (x i , x) + b) i =1
(10)
C2S = s (s − 1) / 2
binary recognition systems covering all pairs of classes, instead of using only an s SVM recognition system as with the one-againstall. Each of the s(s-1)/2 binary SVMs cast one vote for its favored class, and the class with the most votes wins. The number obtained using this method is usually greater than the number of one-against-all recognition
6810
Afr. J. Bus. Manage.
Table 3 Confusion matrix of SVM recognition system ( =0.5).
Input pattern Normal Up-trend Dn-trend Cycle-1 Cycle-2 Up-shift Dn-shift
Normal 87.5 / 95.5 0.0 / 0.0 0.0 / 0.0 0.0 / 0.0 0.0 / 0.0 0.0 / 0.0 0.0 / 0.0
Up-trend 0.0 / 0.0 89.8 / 86.2 0.0 / 0.0 0.0 / 0.0 0.0 / 0.0 0.0 / 0.0 0.0 / 0.0
Recognized pattern Dn-trend Cycle-1 Cycle-2 0.0 / 0.0 0.0 / 0.0 0.0 / 0.0 0.0 / 0.0 0.0 / 0.0 0.0 / 0.0 93.1 / 85.0 0.0 / 0.0 0.0 / 0.0 0.0 / 0.0 84.0 / 89.3 8.0 / 7.1 0.0 / 0.0 6.9 / 5.0 93.1 / 95.0 6.9 / 0.0 0.0 / 0.0 0.0 / 0.0 0.0 / 0.0 1.9 / 0.0 0.0 / 0.0
Up-shift 0.0 / 0.0 0.0 / 0.0 5.2 / 5.0 0.0 / 0.0 0.0 / 0.0 91.4 / 100.0 0.0 / 0.0
Dn-shift 12.5 / 4.5 10.2 / 13.8 1.7 / 10.0 8.0 / 3.6 0.0 / 0.0 1.7 / 0.0 98.1 / 100.0
Note: (a/b) denotes (training/test).
Table 4 Confusion matrix of AIS-based machine learning recognition system ( =0.5).
Input pattern Normal Up-trend Dn-trend Cycle-1 Cycle-2 Up-shift Dn-shift
Recognized pattern Normal Up-trend Dn-trend Cycle-1 Cycle-2 100.0 / 100.0 0.0 / 0.0 0.0 / 0.0 0.0 / 0.0 0.0 / 0.0 2.0 / 0.0 98.0 / 100.0 0.0 / 0.0 0.0 / 0.0 0.0 / 0.0 0.0 / 0.0 0.0 / 0.0 100.0 / 100.0 0.0 / 0.0 0.0 / 0.0 0.0 / 0.0 0.0 / 0.0 0.0 / 0.0 0.0 / 0.0 100.0 / 100.0 0.0 / 4.3 0.0 / 0.0 0.0 / 0.0 0.0 / 0.0 100.0 / 95.7 5.9 / 0.0 17.6 / 20.0 0.0 / 0.0 0.0 / 0.0 0.0 / 0.0 0.0 / 0.0 0.0 / 0.0 4.4 / 0.0 0.0 / 0.0 0.0 / 0.0
Up-shift 0.0 / 0.0 0.0 / 0.0 0.0 / 0.0 0.0 / 0.0 0.0 / 0.0 88.2 / 80.0 0.0 / 0.0
Dn-shift 0.0 / 0.0 0.0 / 0.0 0.0 / 0.0 0.0 / 0.0 0.0 / 0.0 0.0 / 0.0 95.6 / 100.0
Note: (a/b) denotes (training/test).
systems. In this work, s = 7 , we would need to train 27 binary recognition systems, rather than 7, as in the one-against-all method.
RESULTS AND EVALUATION
QUANTITATIVE
PERFORMANCE
In this study, the rate of accurate recognition was calculated to evaluate the performance of various recognition systems. Test samples were generated in the same manner as training samples. Each recognition system was tested with five times the number of training samples. Table 1 shows the range of parameters used for simulating unnatural patterns, comparing the accuracy with that of various other pattern recognition systems. This subject includes autocorrelated and non-autocorrelated datasets. In this application, the results were reported for various positive and negative autocorrelation situations. Tables 3 and 4 summarize the confusion matrices of classification results for traditional SVM and AIS-based machine learning recognition systems, respectively. The rows in the confusion matrix represent the desired results (that is, target patterns), while columns indicate the output patterns as recognized by the designated recognition system. Diagonal entries (in boldface) indicate correct recognition, while off-diagonal entries expressed
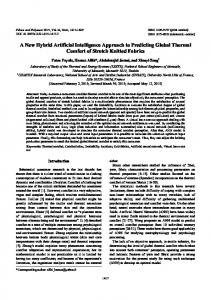
that the unnatural pattern has been mis-identified. The results in Tables 3 and 4 indicate that AIS-based machine learning recognition systems achieve performance superior to that of traditional SVMs. The proposed approach achieved a significant improvement, particularly in recognizing cyclic patterns. Figure 6 shows the overall test performance using various φ . Note that normal patterns were not included in overall performance. This figure illustrate the relationship between autoregressive coefficients φ and recognition accuracy, indicating that the proposed method performs markedly better than SVMs, particularly in cases of positive autocorrelation. In summary, the findings of this study indicate that AIS improves the recognition of both autocorrelated data and non-autocorrelated data ( =0). A closer look at the results reveals that the proposed recognition system has the same capability in identifying various directional changes in unnatural patterns. These methods are capable of clustering, cloning, and mutating, while maintaining the global characteristics of the data. CONCLUSIONS Every company endeavoring to succeed in today’s competitive market must continually improve business processes, to enhance the quality of the products or
Cheng and Cheng
SVM recogni zer Proposed recognizer
100. 0
Accuracy rate of recognition
6811
97. 5
95. 0
92. 5
90. 0
87. 5
85. 0 - 0. 9
- 0. 7
- 0.5
- 0. 3
- 0. 1
0. 0
0 .1
0. 3
0. 5
0.7
0. 9
phi Figure. 6 Overall performance of recognition systems with various
services they provide. Product quality is an ideal starting point to provide customer satisfaction and generate customer loyalty (Chang and Fong, 2010; Ding, 2010; Yeh, 2010; Zulnaidi, 2010). The proposed method can be used to monitor nonrandom variations in the manufacturing process and establish a computer-based pattern recognition system operating on-line, and in real-time. The framework allows managers and researchers to comprehend differences among operations, activities, and specific managerial interventions. It is a fact that quality is of paramount importance with regard to perceptions of customer value, and the promotion of quality should be a goal of all strategies related to improvements are partly due to the fact that the AIS production and competitive advantage. However, the possibility of making wrong decisions is a factor that burdens organizations with extraneous operational costs. Continual improvement implies that members of an organization have accepted in their hearts for the need to strive for constant improvement, to perform better today than yesterday, and to aim for an even better tomorrow. Everyone involved is constantly searching for the best possible approach and most cost effective way to do things. For this reason, identification of unnatural patterns can greatly narrow the set of possible causes that must be investigated, thereby reducing the difficulties and the time
.
associated with diagnostic searches. Managers must be aware that monitoring processes and evaluating quality is not a black box operation. The proposed recognition system provides managers with the practical means with which to attain and maintain the quality in products and services demanded of them. This study focused on the development of an AISbased machine learning approach for the improvement of pattern recognition in control charts. This study also evaluated the capability of the proposed recognition system in AR(1) processes. The simulated results demonstrate that the proposed method provides an appreciable improvement in recognition performance, over conventional SVMs. The contributions of this comparative study can be summarized as follows. (i) This study developed an AIS-based recognition system to monitor processes, through the adoption of the optimal parameters of the recognition system, and verified that the proposed approach yields stable results using a variety of parameters. (ii) The AIS-based machine learning recognition system improved the identification of abnormal processes. Four patterns (including trends, sudden shifts, cyclic patterns, and normal patterns) were identified and investigated in this study. The proposed methodology is capable of delivering a much higher level of performance than that of traditional recognition systems.
6812
Afr. J. Bus. Manage.
(iii) The proposed method integrates an artificial immune algorithm and machine learning technique, to establish a foundation on which to base future research into autocorrelation processes using positive or negative . The proposed approach could also be used to diag-nose variations in process, to achieve a high degree of recognition accuracy in autocorrelated or nonautocorrelated processes. The results of this investigation support the findings of our previous study (Cheng and Cheng, 2008b), indicating that the proposed approach is credible, extending the application of autocorrelated product characteristics to enhance product quality and customer satisfaction. The superior performance of the proposed approach can be attributed to the degree of autocorrelation, training procedure, and selection of optimal parameters. Moreover, the proposed recognition system is capable of ensuring consistency within processes, decreasing the number of false alarms, and achieving a more effective implementation of control charts. This study has identified four patterns (including trends, sudden shifts, cyclic patterns, and normal patterns) and provided robust representations, enabling the recognition of various unnatural patterns and concurrent patterns simultaneously. Studying the selection of various time series models is one possible direction for future work. ACKNOWLEDGEMENTS This paper is sponsored by the National Science Council of the Republic of China, under the project number of NSC 98-2221-E-451-012. The authors also gratefully acknowledge the constructive comments and useful suggestions of the reviewers and editors, which have improved the paper. REFERENCE Alam GM (2009). Can governance and regulatory control ensure private higher education as business or public goods in Bangladesh? Afr. J. Bus. Manag., 3(12): 890-906. Alam GM, Khalifa MTB, Shahjamal MM (2009). Return from education system in Bangladesh: an investigation on comparative flashback scenario. Afr. J. Bus. Manag., 3(10): 567-575. Alwan LC, Roberts HV (1988). Time-series modeling for statistical process control. J. Bus. Econ. Stat., 6(1): 87-95. Burges CJC (1998). A tutorial on support vector machines for pattern recognition. Data Min. Knowl. Disc., 2: 121-167. Chang NJ, Fong CM (2010). Green product quality, green corporate image, green customer satisfaction, and green customer loyalty. Afr. J. Bus. Manag., 4(13): 2836-2844. Cheng CS (1989). Group technology and expert systems concepts applied to statistical process control in small-batch manufacturing. PhD dissertation, Arizona State University. Cheng CS (1995). A multi-layer neural network model for detecting changes in the process mean. Comput. Ind. Eng., 28: 51-61. Cheng CS (1997). A neural network approach for the analysis of control chart patterns. Int. J. Prod. Res., 35: 667-697. Cheng CS, Cheng HP (2008a). Identifying the source of variance shifts in the multivariate process using neural networks and support vector machines. Expert. Syst. Appl., 35: 198-206.
Cheng CS, Hubele NF (1996). A pattern recognition algorithm for an X-bar control chart. IIE Trans. 28: 215-224. Cheng HP, Cheng CS (2008b). Denoising and feature extraction for control chart pattern recognition in autocorrelated processes. Int. J. Sign. Syst. Eng., 1(2): 115-126. Chinnam RB (2002). Support vector machines for recognizing shifts in correlated and other manufacturing processes. Int. J. Prod. Res., 40: 4449-4466. Chiu CC, Chen MK, Lee KM (2001). Shifts recognition in correlated process data using a neural network. Int. J. Syst. Sci., 32(2): 137143. Cook DF, Chiu CC (1998). Using radial basis function neural networks to recognize shifts in correlated manufacturing process parameters. IIE Trans., 30: 227-234. Cook DF, Zobel CW, Nottingham QJ (2001). Utilization of neural networks for the recognition of variance shifts in correlated manufacturing process parameters. Int. J. Prod. Res., 39(17): 3881-3887. Dasgupta D, Yu S, Majumdar NS (2005). MILA-multilevel immune learning algorithm and its application to anomaly detection. Soft Comput., 9: 172-184. de Castro LN, Timmis J (2002). Artificial immune systems: A new computational intelligence approach. Heidelberg, Springer-Verlag. de Castro LN, Timmis J (2003). Artificial immune systems as a novel soft computing paradigm. Soft Comput., 7: 526-544. Ding JF (2010). Critical factors influencing customer value for global shipping carrier-based logistics service providers using Fuzzy AHP approach. Afr. J. Bus. Manag., 4(7): 1299-1307. Guh RS, Hsieh YC (1999). A neural network based model for abnormal pattern recognition of control charts. Comput. Ind. Eng., 36: 97-108. Hart E, Timmis J (2008). Application areas of AIS: The past, the present and the future. Appl. Soft Comput., 8: 191-201. Hsu CW, Lin CJ (2002). A comparison of methods for multiclass support vector machines. IEEE T. Neural Netw., 13: 415-425. Hwarng HB (2004). Detecting process mean shift in the presence of autocorrelation: a neural-network based monitoring scheme. Int. J. Prod. Res., 42(3): 573-595. Hwarng HB (2005). Simultaneous identification of mean shift and correlation change in AR(1) process. Int. J. Prod. Res., 43(9): 1761-1783. Jandaghi G, Tehrani R, Hosseinpour D, Gholipour R, Shadkam SAS (2010). Application of Fuzzy-neural networks in multi-ahead forecast of stock price. Afr. J. Bus. Manag., 4(6): 903-914. Kuo RJ, Ho LM, Hu CM (2002). Cluster analysis in industrial market segmentation through artificial neural network. Comput. Ind. Eng., 42: 391-399. Lo S (2008). Web service quality control based on text mining using support vector machine. Expert. Syst. Appl., 34: 603-610. MathWorks (2004). MATLAB 7.0 Users Guide. Natick, MathWorks. th Montgomery DC (2005). Introduction to statistical quality control. 5 , New Jersey, John Wiley & Sons. Nelson LS (1984). The Shewhart control chart-tests for special cause. J. Qual. Techno., 16: 237-239. Noorossana R, Farrokhi M, Saghaei A (2003). Using neural networks to detect and classify out-of-control signals in autocorrelated processes. Qual. Reliab. Eng. Int., 19: 493-504. Ozturk A, Cobanli S, Erdogmus P, Tosun S (2010). Reactive power optimization with artificial bee colony algorithm. Sci. Res. Essays, 5(19): 2848-2857. Pacella M, Semeraro Q, Anglani A (2004). Adaptive resonance theory-based neural algorithms for manufacturing process quality control. Int. J. Prod. Res., 42(21): 4581-4607. Pham DT, Oztemel E (1994). Control chart pattern recognition using learning vector quantization networks. Int. J. Prod. Res., 32: 721729. Polat K, Şahan S, Güneş S (2007). A novel hybrid method based on artificial immune recognition system (AIRS) with fuzzy weighted pre-processing for thyroid disease diagnosis. Expert. Syst. Appl., 32: 1141-1147. Şahan S, Kodaz H, Güneş S, Polat K (2004). A new classifier based on attribute weighted artificial immune system. Lect. Notes
Cheng and Cheng
Comput. Sci., 3280: 11-20. Heidelberg, Springer-Verlag. Şahan S, Polat K, Kodaz H, Güneş S (2007). A new hybrid method based on fuzzy-artificial immune system and k-nn algorithm for breast cancer diagnosis. Comput. Bio. Med., 37: 415-423. Sancak E (2009). Prediction of bond strength of lightweight concretes by using artificial neural networks. Sci. Res. Essays, 4 (4): 256-266. STATISTICA (2004). STATISTICA Data Miner. Oklahoma, StatSoft. Stoumbos ZG, Reynolds MR, Ryan TP, Woodall WH (2000). The state of statistical process control as we proceed into the 21st century. J. Am. Stat. Assoc., 95: 992-998. Timmis J (2007). Artificial immune systems-today and tomorrow. Nat. Comput., 6: 1-18. Timmis J, Hone A, Stibor T, Clark E (2008). Theoretical advances in artificial immune systems. Theor. Comput. Sci., 403: 11-32. Timmis J, Neal M, Hunt J (2000). An artificial immune system for data analysis. BioSystems., 55: 143-150. Vapnik VN (1995). The nature of statistical learning theory. Heidelberg, Springer-Verlag. van den Berg HA (2009). Design principles of adaptive cellular immunity for artificial immune systems. Soft Comput., 13: 10731080.
6813
Wang W, Gao S, Tang Z (2009). Improved pattern recognition with complex artificial immune system. Soft Comput., 13: 1209-1217. Western Electric Company (1956). Statistical Quality Control Handbook. Indiana, Western Electric. Widodo A, Yang BS (2007). Support vector machine in machine condition monitoring and fault diagnosis. Mech. Syst. Signal Pr., 21: 2560-2574. Woodall WH, Montgomery DC (1999). Research issues and ideas in statistical process control. J. Qual. Techno., 31: 376-386. Yang MS, Yang JH (2002). A fuzzy-soft learning vector quantization for control chart pattern recognition. Int. J. Prod. Res., 40: 27212731. Yang JH, Yang MS (2005). A control chart pattern recognition system using a statistical correlation coefficient method. Comput. Ind. Eng., 48: 205-221. Yeh TM (2010). Determining medical service improvement priority by integrating the refined Kano model, Quality function deployment and Fuzzy integrals. Afr. J. Bus. Manag., 4(12): 2534-2545. Zulnaidi Y (2010). Quality management as an effective strategy of cost savings. Afr. J. Bus. Manag., 4(9): 1844-1855.