The best trained artificial neural network was selected and implemented for screening .... Fortunately several good simulation software packages were available.
4th International Conference on Managing Pavements (1998)
ARTIFICIAL NEURAL NETWORK BASED PROJECT SELECTION LEVEL PAVEMENT MANAGEMENT SYSTEM
Gerardo Flintsch(1), John Zaniewski(2), James Delton(3), and Alejandra Medina(4)
(1)
Virginia Polytechnic Institute and State University Department of Civil and Environment Engineering Blacksburg, VA, 24061-0105, USA (2)
West Virginia University Civil and Environmental Engineering Department PO Box 6103, Morgantown WV 26506, USA
(3)
Arizona Department of Transportation 1221 North 21st Avenue Phoenix, AZ 85009, USA
(4)
FM International 13,500 Copper Croft Run, NW, Apt C Blacksburg, VA 24060
Abstract An artificial neural network simulator was used to develop an automatic procedure for screening and recommending roadway sections for pavement preservation. The artificial neural network was used to "learn" the knowledge from historical project selection. It was trained using the pavement condition and characteristics, and the sections selected for the Arizona Department of Transportation pavement preservation program for several years. This paper summarizes the steps conducted for the development of the network architecture, its implementation in a computer program, and the results obtained in the verification stage. The artificial neural network analysis reduces the level of effort required to identify candidate sections for the pavement preservation program, reduces subjectivity, and minimizes the probability of missing sections that should be programmed. 1.
INTRODUCTION
A Pavement Management System (PMS) must provide cost-effective decisions in response to questions such as: what treatment is the most cost-effective, where are the treatments needed, and when is the best time (pavement condition) to program a treatment (AASHTO, 1990). This paper presents an artificial neural network approach for the second question. The procedure developed identifies roadway sections candidates for a preservation treatment. The results of this research will augment the current capability of Arizona Department of Transportation's (ADOT) pavement management system.
TRB Committee AFD10 on Pavement Management Systems is providing the information contained herein for use by individual practitioners in state and local transportation agencies, researchers in academic institutions, and other members of the transportation research community. The information in this paper was taken directly from the submission of the author(s).
4th International Conference on Managing Pavements (1998)
ADOT has operated a network level PMS since 1980. The PMS uses a network optimization system to determine the optimum budget needs and allocation for ADOT's pavement network. It recommends the miles of pavement, in each road functional category, traffic level and design region, that should receive each rehabilitation action, and the budget required for these actions (Wang et al, 1994). Although the network optimization system provides a very effective tool for generating annual budget needs, it does not assist with the selection of the sections needing preservation projects. ADOT’s preservation program is composed of projects to be rehabilitated and specifies when and how to rehabilitate each project. Project selection is conducted mostly manually. It starts with prioritizing sections based on a weighed index, "Rate," computed using cracking, roughness, rutting, and maintenance cost. The highest priority sections are reviewed concurrently by the PMS and district engineers. The preservation program, including a preservation recommendation (e.g., thin overlay) for each section is prepared based on these reviews. Subsequently, the most appropriate treatment for each section is designed using life cycle cost analysis. 2.
RESEARCH APPROACH
The objective of the research presented in this paper was to evaluate the use of an artificial neural network simulator for screening and recommending roadway sections for ADOT's pavement preservation program. This effort is part of a larger scale research project to develop and implement an automatic project recommendation extension of ADOT's pavement management system. The neural network simulator learned the knowledge previously applied by the PMS staff by studying the relationship between the pavement condition and characteristics at the time of programming, and the sections finally selected for the pavement preservation program. The learning process used several years of data. A neural network scheme was selected for this purpose because it is capable of detecting hidden patterns that could be missed by traditional analysis tools. A commercial artificial neural network simulator software was selected for the study. The training examples were prepared with sections programmed and not programmed from past pavements preservation programs. The most appropriate network architecture and training parameters were then defined using a designed experiment. The best trained artificial neural network was selected and implemented for screening and recommending candidate sections when supplied with the current condition of the pavement sections in the network. The output of the artificial neural network is a list of candidate roadway sections. These sections are further analyzed to prepare the list of sections recommended for the pavement preservation program. In addition to the sections recommended by the artificial neural network, all sections with any of the performance parameters exceeding an acceptable threshold value, or with very low remaining service life, are included in the list of candidate sections. 3.
ARTIFICIAL INTELLIGENCE TOOLS FOR PROJECT SELECTION
TRB Committee AFD10 on Pavement Management Systems is providing the information contained herein for use by individual practitioners in state and local transportation agencies, researchers in academic institutions, and other members of the transportation research community. The information in this paper was taken directly from the submission of the author(s).
4th International Conference on Managing Pavements (1998)
Artificial intelligence is a fast growing discipline that attempts to represent and manipulate knowledge to automatically solve problems that before were only solved by humans (Rich and Knight, 1991). Because of the complex nature of the project recommendation, prioritization and selection processes in a PMS, artificial intelligence techniques are useful tools that can be applied to these processes. Two artificial intelligence techniques, expert systems and artificial neural networks, were found particularly appealing for the screening and selection of candidate roadway sections. Each has advantages and disadvantages. Neural networks have the ability to make associations between known inputs and outputs by observing a large number of examples. They do not require the development of knowledge rules, are capable of learning from examples, have greater generalization capabilities, are able to produce correct or near correct responses when presented with partially incorrect or incomplete data, are faster to develop and allow easier updating of the knowledge base. On the other hand, expert systems require the development of rules for the knowledge-base and provide better explanation capabilities. The neural network approach was preferred because: 1.
The selection process is relatively unstructured, making the development of rules particularly complicated,
2.
Considers uncertain and sometimes incomplete data, and
3.
The degree of detail of the available information varies from section to section in the database.
Artificial neural networks mimic the human brain. The human brain is complex network of hundred of millions of neurons that send information back and forth to each other though connections. The result is an intelligent being able of learning, analysis, prediction, and recognition. Artificial neural networks are composed by many simulated neurons or units that are connected in such a way that are able to learn in a similar manner to people (Lawrence, 1994). The most important characteristics of neural networks are that they are able to produce correct or near correct responses when presented with partially incorrect or incomplete data, and they are able to generalize rules from the cases on which they are trained and apply them to new inputs. There are several ways the network can "learn." The most common learning method, used by the network developed, is by example and repetition, also called back propagation (Lawrence, 1994). Many example pairs of inputs and outputs are presented to the network, which adjusts the weights of the connections to minimize the number of wrong predictions. The examples that are presented to the network are called the training set. The learning or training is an iterative process. Each time it is presented with an input (the condition of a particular roadway section), the network "guesses" what the output is supposed to be. If the network output differs from the one presented (a section that was not programmed is recommended), the weights of the connections are adjusted. Each training case, with the corresponding modifications of connections, is called a cycle. A set of cycles, made up of one cycle for each training TRB Committee AFD10 on Pavement Management Systems is providing the information contained herein for use by individual practitioners in state and local transportation agencies, researchers in academic institutions, and other members of the transportation research community. The information in this paper was taken directly from the submission of the author(s).
4th International Conference on Managing Pavements (1998)
case, is called an epoch. The weights are modified many times until the network gets an acceptable number of right answers or the number of epochs exceeded a prescribed maximum. It is common that an artificial neural network requires thousands of epochs to learn most of the examples. 4.
DESIGN OF THE ARTIFICIAL NEURAL NETWORK
The design of the artificial neural network included the following steps: 1.
Selection of an artificial neural network scheme.
2.
Data preparation and selection of input and output parameters.
3.
Selection of the most appropriate network architecture and training parameters.
4.
Refinement of the artificial neural network.
4.1.
Artificial Neural Network Scheme
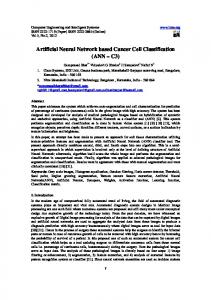
Several types of artificial neural network types were considered, and the use of a commercial software package was weighted against the possibility of developing a specific neural network simulator. Based on the literature reviewed, a backpropagation neural network appeared to be the most appropriate type for this type of application. Fortunately several good simulation software packages were available for this type of networks. After reviewing the various options, the commercial software package BrainMaker was selected. It is a back propagation simulator that works in both DOS and WINDOWS environments, and has very good utilities for data preparation and manipulation (CSS, 1993). Figure 1 shows the scheme of the three-layer back propagation neural network simulator adopted. An input processor program interfaces with the PMS database; it uses the average section characteristics computed by the delineation procedure and stratifies some of the data fields. The outputs of the input processor are a set of values Ii used to activate the artificial neurons in the input layer of the artificial neural network simulator. An Ii is computed for each parameter included in the decision process (roughness, cracking, ADT, etc.). The artificial neural network simulator processes the Ii's corresponding to each section and determines if the section should be recommended or not. It is organized in three layers of neurons, the input neurons, that receive the information from the input processor, the hidden neurons that link the neurons in the other two layers, and the output neurons (only one in this case) that sends the results to the output processor.
TRB Committee AFD10 on Pavement Management Systems is providing the information contained herein for use by individual practitioners in state and local transportation agencies, researchers in academic institutions, and other members of the transportation research community. The information in this paper was taken directly from the submission of the author(s).
4th International Conference on Managing Pavements (1998)
OUTPUT PROCESSOR
ANN
Output Neurons
oo =
ao
i
Io
1 1 + e − Io N
Io = ∑ who ah h =1
wno
w1o
Hidden Neurons
1
2
who ...
h
ah
ah =
...
n
Ih
M
Ih = ∑ wih ai i =1
wih w11
Input Neurons
1 1 + e − Ih
wmh 1
2
...
i
ai
...
Ii
m
ai =
Ii − Imin Imax − Imin
INPUT PROCESSOR
PMS DATABASE Figure 1. Scheme of the Artificial Neural Network Developed. The first step conducted by the neural network simulator is to process the input of each neuron i of the input layer, Ii, to a scale of 0 to 1; this is the activation level, ai, of the neuron i. The scaled values or activation levels are transmitted to all connected neurons in the hidden layer. At the hidden layer, each neuron h computes its input, Ih, adding the level of activation (ai) of all connected input neurons weighted by the weights of the connections (wih). This input Ih is then processed to an activation level, ah, using an activation function, ah = f(Ih). At the output layer, the input for the output neuron, Io, is computed adding the ah 's of the connected hidden neurons weighted by the connection weights (who). This input Io is processed to the output of the network, oo, using the activation formula.
TRB Committee AFD10 on Pavement Management Systems is providing the information contained herein for use by individual practitioners in state and local transportation agencies, researchers in academic institutions, and other members of the transportation research community. The information in this paper was taken directly from the submission of the author(s).
4th International Conference on Managing Pavements (1998)
Finally, the output processor translates the numeric output received from the simulator to a recommendation. In the training examples, a section that was programmed was assigned an output of 1, and one that was not programmed an output of 0. Since the output of the network is not necessarily a 0 or 1, but a number between these two limits, a break-down value of 0.5 was adopted to differentiate between a section that should be recommended and one that should not. If oo is larger than 0.5 the section is recommended for the program. If oo is less than 0.5 the section is not recommended. 4.2.
Data Preparation and Parameter Selection
The Pavement Preservation Programs from 1990 to 1996 were used to prepare the examples for training and testing the neural network. A longer period of time could have been used. However, it was felt that the selection criteria and/or the roadway conditions could have changed significantly. The first step was to create a database with all the projects programmed for 1990 to 1996. Then, the average pavement condition and traffic, at the time the sections were programmed, were compiled for each section in the database. In addition, cracking and roughness 1, 2 and 3 years before the programming year (year when the sections where selected) and the average maintenance cost for the last three years were computed. If no data for a particular indicator was available for any milepost in the section, an average value was assigned trying to avoid any effect on the results. If only a portion of the mileposts in the section had data, the average of the available points was assigned to the whole section. For four-lane divided highways, the averages were computed for each direction and the worst of both directions was considered for each parameter. A summary of the information computed for each section is shown in Table 1. Since the artificial neural network had to "learn" to differentiate sections that required preservation from those that did not, the next step was to select for each programming year, a sample of sections that were not included in the preservation program. All the information needed was obtained for all mileposts that did not have a treatment programmed or constructed for the three years following the programming year. Homogenous sections were delimited using past and programmed project information and the averages for all the considered parameters were computed and recorded for all sections longer than 8 kilometers (5 miles). Finally, an output variable prog was added to the database to indicate if the section was programmed or not. The variable was assigned a value of 1 if it the section was programmed and 0 if it was not. As a result, a total of 418 examples were available for training and testing. Seventy-five percents of these examples were used for training and 25% were reserved for testing. The percentage of testing cases is probably higher than usual, but it was selected to have a good estimate of the capability of the network to generalize. This is very important to ensure a good performance of the network in the future. The training and testing examples were separated randomly. Table 1. Input Variables of the artificial neural network. TRB Committee AFD10 on Pavement Management Systems is providing the information contained herein for use by individual practitioners in state and local transportation agencies, researchers in academic institutions, and other members of the transportation research community. The information in this paper was taken directly from the submission of the author(s).
4th International Conference on Managing Pavements (1998)
Units
Levels for Stratification
Non-Inter.- Interstate
2
Region
Dimensionless Number
3
SN
Dimensionless Number
5
% of Pav. Surface
5
Inches/mile (Maysmeter)
5
Mu-meter Number
4
Inches
4
Patching
% of Pav. Surface
5
Flushing
Dimensionless Number
5
Vehicles per day
5
Dollars
5
Dimensionless Number
5
Variable Classification
Cracking (programming year and 1, 2 and 3 years before) Roughness (programming year and 1, 2 and 3 years before) Skid Rutting
ADT Maintenance Cost Rate
4.3.
Selection of Network Architecture and Training Parameters
The design of the artificial neural network architecture, training and testing were conducted concurrently. A fractional factorial experiment was designed for this purpose. The objectives of the experiment were to identify the neural network design factors that significantly affect the network performance, and the levels at which these factors should be used. 4.3.1. Experiment Design After reviewing the literature available (Lawrence, 1994; CSS, 1993, and Maren et al., 1990), four factors were selected for the experiment: learning constant or learning rate (η), training tolerance, stratification of the input data, and number of neurons in the hidden layer. Table 2 shows the levels selected for the factors considered and their settings for the various experiment runs. Each experiment run consisted of a separate training section, that started with a complete randomized set of connection's weights. The learning rate or constant is the factor used to scale the corrections done to the weights while the network is learning. Since the learning rate is included in the formula to improve the speed of convergence of the network, it could affect the network performance. The training tolerance is the maximum deviation from the actual output accepted to consider a network output correct. Table 2. Selected Levels for the Fractional Experiment Designed.
TRB Committee AFD10 on Pavement Management Systems is providing the information contained herein for use by individual practitioners in state and local transportation agencies, researchers in academic institutions, and other members of the transportation research community. The information in this paper was taken directly from the submission of the author(s).
4th International Conference on Managing Pavements (1998)
Training Session
Learning Rate
Training Tolerance
Stratified Input
Hidden Neurons
1
0.2
0.1
Yes
12
2
1
0.4
Yes
12
3
0.2
0.4
No
12
4
1
0.1
No
12
5
0.2
0.4
Yes
48
6
1
0.1
Yes
48
7
0.2
0.1
No
48
8
1
0.4
No
48
The possibility of stratifying or dividing the input fields into ranges was studied because most neural networks respond better to ranges in input or output than to precise numeric values (CSS, 1993). Two separate sets of training and testing examples were prepared. In the first set the input variables were the numeric values of each field as they were computed (e.g., 5 % cracking). In the second set, the input was coded or stratified by classifying each input item into a maximum of five ranges or categories (low, medium or average, high, very high and extremely high). These categories were represented by integers from -1 to +3. All missing values were assigned a 0. The number of categories used for each item is indicated in Table 1. For example, a pavement section of an interstate highway with a percentage of cracking lower than 1% was assigned a -1, one with cracking between 1% and 5% a 0, one with cracking between 5% and 12% a +1, one with cracking between 12% and 25% a +2, and one with more than 25% cracking a +3. A Yes in Table 2 indicates that the input was coded and No that the actual values (actual percentage of cracking) were used for each item. The number of hidden neurons, or neurons in the hidden layer (only one hidden layer was used) normally affect the performance of a neural network. BrainMaker User's Guide recommends that the number of hidden neurons should be between (CSS, 1993): •
Number of examples/10 - input neurons - output neurons = 12, and
•
Number of examples/2 - input neurons - output neurons = 138.
Lawrence (1994) provides several rules of thumb that can be used for the artificial neural network design. According with these suggestions some two factor interaction could be expected to be significant. Consequently, a resolution IV, one quarter factorial design (24-1 ) was designed using the Alias structure suggested by Montgomery (1991). This experiment design permits evaluating 4 factors in 8 runs, with no two-factor interaction aliased with the main effects. Since there is no unique way to measure the performance of an artificial neural network, several performance statistics were selected as the response variables to be considered in the experiment: TRB Committee AFD10 on Pavement Management Systems is providing the information contained herein for use by individual practitioners in state and local transportation agencies, researchers in academic institutions, and other members of the transportation research community. The information in this paper was taken directly from the submission of the author(s).
4th International Conference on Managing Pavements (1998)
1.
From the network that learned the most training facts: •
Number of facts learned, the average error and the mean squared error (MSE),
•
Percentage of training facts correctly identified with a tolerance of 0.5, and
•
Percentage of the testing facts correctly identified with a tolerance of 0.5.
2.
From the network that correctly identify the most testing facts: •
Percentage of good answers during testing with a tolerance of 0.5.
The number of facts identified correctly must be used with caution because the experimental training sessions have two different training tolerances. It could happen that the runs with the higher tolerance have more facts learned, just because of the looser tolerance. The tolerance of 0.5 was selected because it was the middle value of the range of the predicted variable (from 0 to 1). Using this tolerance, those sections with a prog value larger than 0.5 should be programmed and those with a prog value lower than 0.5 should not be included in the program. Each experimental run consisted of a separate training section that started with a complete randomized set of connections between neurons. All training or learning sections were limited to a maximum of 10,000 epochs, and were set to automatically save every 200 training epochs, and to test every 5 epochs. An epoch is completed when all training examples have been presented to the network that has made the corresponding adjustments. BrainMaker’s default activation function was used. 4.3.2. Results The results of the eight experimental training sections are summarized in Table 3. The first set of data corresponds to the saved network that had the highest number of examples learned. For this network the table shows: 1.
How many epochs were required to reach the corresponding level of training,
2.
Which was the percentage of examples learned at the tolerance of the specific experimental run,
3.
The percentage of right answers with a tolerance of 0.5,
4.
The mean square error of the prediction for all training examples, and
5.
The percentage of correct answers when using the test examples.
The last three columns are the statistics for the best testing network in each experimental run. The table shows: 1.
The number of epochs at which the best testing network was obtained,
2.
The percentage of testing examples correctly identified, and
3.
The mean square error of the predictions for all testing examples. Table 3. Results of the Experiment Runs.
TRB Committee AFD10 on Pavement Management Systems is providing the information contained herein for use by individual practitioners in state and local transportation agencies, researchers in academic institutions, and other members of the transportation research community. The information in this paper was taken directly from the submission of the author(s).
4th International Conference on Managing Pavements (1998)
Exp.
Network that Learned the Most Training Facts
Best Testing Network
Run At Epoch % % Right Average % Right At Epoch % Right MSE Number Learned Train Set Error Test Set Number Test Set Test Set 1
7400
63%
93%
0.108
62%
7730
66%
0.555
2
7200
88%
89%
0.241
63%
6380
68%
0.498
3
6800
68%
71%
0.310
56%
715
58%
0.476
4
6400
59%
60%
0.200
58%
7980
62%
0.589
5
6600
99%
99%
0.047
63%
565
65%
0.534
6
3000
99%
99%
0.039
62%
1240
66%
0.542
7
7400
61%
82%
0.108
62%
740
68%
0.505
8
9600
82%
82%
0.221
61%
5365
66%
0.505
As can be observed from Table 3, the networks that correctly classified the most examples of the training set, in general, did not have the highest number of right predictions using the test set. The most appropriate network architecture would be the one that maximizes the number of right answers of both, the training and testing sets. The statistical significance of the effects of the various factors considered on the performance measurements was analyzed using Analysis of Variance: 1.
The analysis of variance suggests that learning rate has no significant effect on either training or testing.
2.
Training tolerance has a significant impact on the average error of the predictions for the training examples.
3.
The stratification of the data has a significant effect on the number of facts learned and on the MSE for the training set.
4.
The number of hidden neurons appears to be the factor that has the most effect on the network capability to learn. Increasing the number of neurons in the hidden layer increases the capacity of the network to learn the training facts. At the levels used in the experiment, it does not have a significant impact on the testing performance.
Table 4 shows setting of the variables to maximize the number of right answers and minimize the errors. A triple sign indicates an effect significant at a 0.05 significance level, and a single sign indicates that the effect is not statistically significant. A positive sign indicates that the effect should be set at the high level and a negative sign that it should be set at its low level. For example, to maximize the number of facts learned, the input must be coded and the higher number of hidden neurons should be used. Setting the other variables at the higher level may help.
TRB Committee AFD10 on Pavement Management Systems is providing the information contained herein for use by individual practitioners in state and local transportation agencies, researchers in academic institutions, and other members of the transportation research community. The information in this paper was taken directly from the submission of the author(s).
4th International Conference on Managing Pavements (1998)
Table 4. Recommended Settings to Maximize Network Performance. Variable
Training Tolerance
Learning Rate
Stratified Input
Hidden Neurons
Maximum % Learned
+
+
---
+++
% right train set
+
-
---
+++
Average error
---
-
---
+++
-
-
---
+++
+
-
+
MSE % right test set MSE of test
+
-
-
-
Max. % right test set
-
+
-
+
MSE of test
+
-
+
+
The table shows that the most significant factors that affect the artificial neural network performance are the number of hidden neurons and the type of input used. The artificial neural network that would perform the best would be one that uses stratified input, a large number of hidden neurons and a low training tolerance. A low learning rate will probably have more positive than negative effects. 4.4.
Refinement of the Artificial Neural Network
The two factors that have significant effect on the artificial neural network performance were further studied to determine their more appropriate settings. Examples from two more pavement preservation programs, 1997 and 1998, were added at this time. Several network architectures, with variable number of hidden neurons and stratification schemes with different number of levels and break-down values, were studied. An artificial neural network with 27 hidden neurons, using a stratified input with a slightly modified stratification scheme, and trained with a low training tolerance and a low learning rate had the best performance. This network was able to: •
Learn 67 % of the training facts with a training tolerance of 0.1,
•
Correctly identify 99 % of the training facts with a testing tolerance of 0.5, and
•
Predict a correct output for 75 % of testing examples with a testing tolerance of 0.5.
This performance was considered acceptable, especially if we consider that not all the reasons for selecting projects for the pavement preservation program are directly inherited from the information in the PMS database. 5.
IMPLEMENTATION AND TESTING
TRB Committee AFD10 on Pavement Management Systems is providing the information contained herein for use by individual practitioners in state and local transportation agencies, researchers in academic institutions, and other members of the transportation research community. The information in this paper was taken directly from the submission of the author(s).
4th International Conference on Managing Pavements (1998)
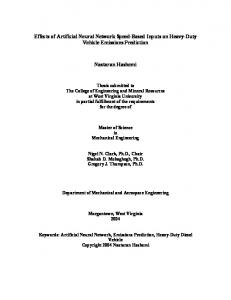
Given the extent of ADOT’s pavement network, the use of the commercial simulator in a section to section basis was considered impractical. To handle the large number of sections efficiently, the simulation of the artificial neural network was implemented through a computer program. Figure 2 shows the scheme for the implemented artificial network simulator.
Prog ¦
Io who
Output Neuron
...
ah Ih
¦ ¦ ...
Connections
wih ai
¦ ¥
Hidden Neurons
Input Neurons ¦ ¦ ¦ ¦ ¦ ¦ ¦ ¦ ¦ ¦ ¦ ¦ ¦ ¦ ¦ ¦ ¦ ¦ ¥
Class. Reg. SN
Cracking
Roughness
Skid Rutt. Patch. Flush. ADT M.C. Rate Thr.
Ii ... Figure 2. Scheme of the Artificial Neural Network Developed For each pavement section, the input processor computes the input values for each field and passes them to the artificial neural network simulator. The simulator uses the neural network architecture defined and computes a prog number for each section in the network. This prog value is then translated to a recommendation. The simulation is repeated for each uniform pavement section in the database to prepare the recommended list of sections for the preservation program. Using the 1994 data, the screening procedure recommended 671 homogenous sections for further evaluation. The average section length was approximately 6.5 kilometers (4 miles). The number of kilometers and sections, recommended is significantly higher than the number of kilometers and sections programmed each year. The candidate sections in this preliminary list are then prioritized and a smaller subset of projects is selected for further consideration. 6.
CONCLUSIONS AND RECOMMENDATIONS
The main conclusions of the research effort are: 1.
Artificial neural networks is an appropriate technique for screening and selecting candidate sections for the preservation program.
TRB Committee AFD10 on Pavement Management Systems is providing the information contained herein for use by individual practitioners in state and local transportation agencies, researchers in academic institutions, and other members of the transportation research community. The information in this paper was taken directly from the submission of the author(s).
4th International Conference on Managing Pavements (1998)
2.
The use of a designed experiment was very useful to determine the most appropriate artificial neural network architecture. Two design factors, number of hidden neurons and stratification of the input, have statistically significant impact on the network performance.
3.
The selected artificial neural network was able to learn 99 % of the training facts and predict a correct output for 75 % of testing examples with a testing tolerance of 0.5. This performance is considered acceptable, especially if we consider that not all the reasons for selecting the projects for the pavement preservation program are directly inherited from the information in the PMS database.
4.
However, the number of kilometers and sections, recommended is significantly higher than the number of kilometers and sections programmed each year. Therefore the candidate sections selected must be further evaluated and prioritized before preparing the final list of recommended projects
Considering the promising results obtained so far, it was recommended to evaluate the possibility of using artificial neural network not only to select the projects, but also to recommend possible preservation treatments. 7.
ACKNOWLEDGMENTS
The authors are grateful to Larry Scofield, manager of the Arizona Transportation Research Center, for his guidance, advice, and support throughout the research. 8.
REFERENCES
AASHTO, 1990, Guidelines for Pavement Management Systems, American Association of State and Transportation Officials, Washington DC. CSS, 1993, BrainMaker, Neural Network Simulation Software, User's Guide and Reference Manual, California Scientific Software, Nevada City, CA. Lawrence J., 1994, Introduction to Neural Networks, Design, Theory, and Applications, California Scientific Software, Nevada City, CA. Maren, A., C. Harston, and R. Pap, 1990, Handbook of Neural Computing Applications, Academic Press, Inc., San Diego California. Montgomery, D.C., 1991, Design and Analysis of Experiments, John Wiley & Sons. Rich, E. and K. Knight, 1991, Artificial Intelligence, McGraw-Hill, Inc. Wang K.C.P., J.P. Zaniewski, and J. Delton, 1994, Analysis of Arizona Department of Transportation's New Pavement Network Optimization System, Transport Research Record 1455, Transport Research Board, National Research Council, Washington DC.
TRB Committee AFD10 on Pavement Management Systems is providing the information contained herein for use by individual practitioners in state and local transportation agencies, researchers in academic institutions, and other members of the transportation research community. The information in this paper was taken directly from the submission of the author(s).