ASGARD - A Graphical Monitoring Tool for Distributed Agent Infrastructures Jakob Tonn and Silvan Kaiser
Abstract Monitoring the runtime behaviour of a distributed agent system for debugging or demonstration purposes provides a challenge to agent system developers. As a lot of the components in such a system are possibly executed on several different physical systems, maintaining an overview over the complete environment is extremely difficult. Methods taken from the development of monolithic software projects such as log files, debug outputs or step-by-step execution of a program do not easily translate to these scenarios due to the distributed nature of the system. In this paper we describe our concept for a graphical monitoring and management tool “ASGARD” (Advanced Structured Graphical Agent Realm Display), which provides an easy-to-use and intuitively understandable method for monitoring and demonstrating Multi Agent System Infrastructures. ASGARD provides a graphical representation of the connected systems using a 3D visualization. The very promising results from empirical evaluation show that an administrator’s overview over such MAS at runtime is vastly improved.
1 Introduction Applications based on Multi Agent Systems (MAS) have gained more and more importance in software development during the recent years. Agent Frameworks such as JIAC V [4] provide a standardized approach for the development and implementation of such systems. Developing distributed MAS is a complex process [6] and requires more effort than developing a non-distributed application. Generally, the Jakob Tonn DAI-Labor, Technische Universit¨at Berlin, Ernst-Reuter-Platz 7, 10587 Berlin, Germany, e-mail:
[email protected] Silvan Kaiser DAI-Labor, Technische Universit¨at Berlin, Ernst-Reuter-Platz 7, 10587 Berlin, Germany, e-mail:
[email protected]
1
2
Jakob Tonn and Silvan Kaiser
development process can be separated into the analysis and design phase, the implementation and the testing stage. Whereas the design process has been made a lot easier with standardized modeling languages and tools, and the process of implementation became partially automated using those models and readily-available libraries and frameworks, the process of monitoring the runtime behaviour of MAS has had far less attention by research projects and industrial solutions. Developers and testers are thus required to either use monitoring methods taken from conventional software development, which are partially suited for the distributed MAS at most, or create their own project-specific methods to indicate the runtime behaviour of their implementation. Another aspect is the demonstration of a distributed MAS in technical discussions. Just showing design documentation and the result of a working implementation usually raises the question of how far the design patterns are connected to the actual implementation. Due to the complex nature of agent systems, this step requires a lot of abstraction in the spectator. These issues can be approached with the concept of software visualization. The idea behind the ASGARD approach is to overcome the “invisible” nature of software by visualizing programs, program artifacts and program behaviour with the goal of making a system easier to understand [1]. With the application of software visualization technologies, autonomous parts of a software system (like agents) can be easily identified, and animated entity representations create a runtime overview on processes and interaction. The ASGARD concept creates a generic solution for administration and demonstration of distributed MAS infrastructures. With the base of an intuitive visualization of MAS applications at runtime, understanding the internal structures, states and interactions takes less effort for both developers and spectators. The concept relies on the basic agent metaphor as used in Agent Oriented Software Engineering and continues this metaphor into the runtime system. Normally a MAS is monitored like a classical object oriented/imperative/petri net/etc. application. With ASGARD agents and their environment can be seen as entities of their metaphors, not only at design time but also inside the running system. Furthermore, developers have access to management functions which help them debug their applications. This is an important utility in the process of finding solutions for runtime problems. The focus of the project lies on visualizing large-scale distributed MAS on one hand and the ability to visualize behaviour in a single entity in detail on the other. This requires a great deal of scalability in the graphical representation, which is provided by the use of 3D technology in ASGARD. Another advantage of a 3D graphical environment over 2-dimensional raster images or scalable vector graphics is the enhanced freedom of placing objects, which allows for better layout of entities and larger systems to be visualized. Users are common to 3D visuals both because of their real-world experiences as well as the increased use of it in recent technology. We believe using 3D technology is the best way to achieve our goal of creating an easy-to-use and intuitive tool. This paper continues by describing the concept of the ASGARD visualization, including some implementation information about the prototype. The underlying technology follows, a short evaluation, state of the art comparison and finally the conclusion containing future work.
ASGARD - A Graphical Monitoring Tool for Distributed Agent Infrastructures
3
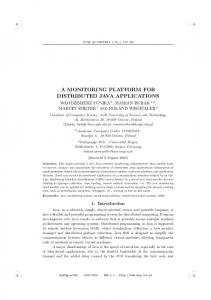
2 The ASGARD Concept The central feature of ASGARD is the visualization of agents and nodes in a distributed MAS Infrastructure employing 3D graphics technologies (see Fig. 1). We chose a 3 dimensional approach for a number of reasons. We live in a 3D environment which gives us a familiar understanding of relations between entities in such an environment. This creates possibilities to use these common relations for displaying system information. Furthermore 3D environments allow to display large numbers of entities that cannot be displayed in 2D without scaling issues. This allows us to communicate more clearly laid out information to a user than other classical 2D concepts in the same display size. The 3D environment in ASGARD both visualizes the hierarchy and structure of the incorporated entities by their placement in space, as well as interaction and processes by using animation.
Fig. 1 ASGARD prototype visualization of several JIAC agentnodes
2.1 Metaphors and Visualization Details A critical point in creating an understandable visualization is the choice of metaphors that represent the different entities. A good representation should enable the spectator to intuitively recognize and classify the entity according to his knowledge [3]. In our case of distributed agent systems, we have to make sure that metaphors make it easy to recognize the concepts known from theory about agent systems. The software agent as a generic actor in an environment already constitutes a strong metaphor in Agent Oriented Technologies (AOT) system design. It is an approach that uses a uniform concept better suited for visualization metaphors than other concepts, e.g. like object oriented or imperative programming entities. Agents are the key entities in an agent framework, as the name already states. In a MAS, agents are the entities where all application-specific functionality is happening. Agents provide the lifecycle for service implementation and are able to perceive information and communicate. As all this defines a kind of human-like behaviour,
4
Jakob Tonn and Silvan Kaiser
a good metaphor would be an abstraction of a human figure. A simple and common metaphor that basically is an abstraction of a human body shape is the one of a play figure from common board games like ‘Chinese Checkers” or “Ludo”. As this metaphor is commonly used in modeling notations for multi agent systems, the use of it furthermore extends the connection between design documents and runtime system structures. Agent Nodes in a MAS are the environments for agents on a single system. They provide the infrastructure required to execute functionality in agents, so that agents can cooperate to realize complex applications. A simple metaphor to represent this function as a base provider to agents is a platform on which the contained agents stand (which can be easily recognized in Fig. 1). The platform can be used to display further information about the node, like the network address as textual representation or security support by applying a texture on the platform surface. Communication is one of the key features of interaction in distributed agent systems. A common metaphor for message communication is a letter envelope. The use of this metaphor raises the problem that a real-time display of the message transport would be way too fast for a human. The solution of artificially slowing down the visualization of a message transfer has proven to be problematic in the use of ASGARD’s predecessor, the JIAC NodeMonitor (see Sect. 5). It created the impression to users less familiar with the implementation of communication that the message transfer feature was painfully slow. Thus, our approach is the use of a combination of two metaphors. The message itself is visualized as a letter moving between the communication partners. To make sure the communication event is visible long enough for the user to catch, a partially translucent line is used as a metaphor to display the communication channel between source and target. This line will slowly dissolve to invisibility if no new messages are transferred, which creates the effect that frequently-used communication channels will appear far stronger than seldomused ones. States of entities can be visualized in an understandable way by colouring parts of the entity representation’s surface. As state is a detail information about a certain entity, visualizing the state as colour is preferable over a shape change [3]. This is made especially well-understandable by picking colours users are common to from their real-life experience. ASGARD uses colours to visualize states is the agent “heads”, which are coloured according to the lifecycle state of the agent, so that a red head indicates a stopped and a green head a running agent. Layout and level of detail As the ASGARD concept is especially targeted at large distributed agent systems, the level of detail displayed in the current view has to be adjusted according to the amount of visible objects. As we are using a first-person perspective view, basing the level of detail displayed on the distance from an object to the camera is a convenient method. It protects ASGARD from overflowing the user with a massive amount of small objects. Further displaying of detail information can be done using tooltip effects and selection of entities.
ASGARD - A Graphical Monitoring Tool for Distributed Agent Infrastructures
5
The layout of the visualized entities (which means their placement in the visual space) can be used to visualize structures and hierarchies in the MAS. An alreadymentioned employment is the placement of agents on Agent Nodes to provide information about the location and hierarchic position of agents. Human-Machine Interaction Human-Machine-Interaction in ASGARD is provided by employing Graphical User Interface (GUI) standards like mouse interaction, drag and drop, popup menus and standard operating system GUI elements. These technologies are used to enhance the level of information provided by the visualization and to create a comfortable and intuitive management interface. Mouse over effects are used to display more information. An object property table GUI component is used to display additional information about entities which are not visualized as metaphoric representations due to either their textual nature or where an intuitively understandable metaphor is not available. Entity selection can be performed by mouse clicks to display an entity’s properties permanently in the property table. Furthermore, object selection is used to control the viewpoint. ASGARD is able to focus the viewpoint on selected objects to overcome the sometimes unintuitive camera controls in a 3D environment. Commonly used camera controls like zoom and rotation are offered as well. A context menu is used to access management functionality for the selected entity.
2.2 Implementation The implementation of ASGARD applies the generic concept of metaphoric visualizations to JIAC V as an existing MAS which is used in various projects. Program Structure To maintain a clean and modular program structure which supports future extensions of the ASGARD concept, a well-thought program structure is required. Model-View-Controller (MVC) patterns have proven to be a good way of modularizing between functionality, graphical rendering and data in GUI developments [10]. Having those aspects in separate units of code helps maintaining a clean implementation and makes adjustments and implementations easy. As the structure of entities in the JIAC framework is a tree hierarchy, it is suitable to use this kind of structure to organize entity objects in ASGARD as well. This is even more convenient as the JME graphics engine (see section 3) organizes visual elements in a scene graph, which is essentially a tree structure as well. Extensions and PlugIns To make ASGARD a versatile, flexible and useful tool, it requires methods to extend it’s functionality. An interface for plugins provides the possibility to adapt the program to the user’s needs. Plugins can access the data from connected JIAC V entities as well as the JMX connectors and thus create additional monitoring and management functions. They can be used to display additional or application-specific data or increase the level of detail in which information are displayed.
6
Jakob Tonn and Silvan Kaiser
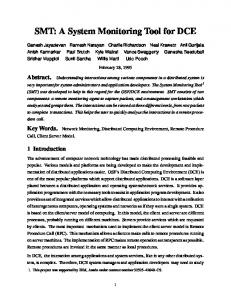
Fig. 2 ASGARD Load Measurement Plugin
The Load Measurement Plugin (see Fig. 2) is an exemplaric concept of an extension plugin for ASGARD. An optional JIAC V agent bean is able to provide information about the current system load. The load measurement plugin is able to read those values over the management interface and use them to create a visualization that shows the current system load of an Agent Node.
3 ASGARD Prototype Technology The functionality of the ASGARD prototype employs several already-existing technologies. JIAC V (Java-based Intelligent Agent Componentware) is a java-based agent framework with particular emphasis on industrial requirements [4]. JIAC combines agent technology with a service-oriented approach, and furthermore provides transparent distribution, security and management features and dynamic reconfiguration in distributed environments. As the latest version of JIAC, JIAC V is used in a broad spectrum of projects, ranging from service delivery platforms to simulation environments, a generic monitoring and debugging tool greatly improves the workflow for JIAC V application developers. For the creation of such a tool for JIAC V the already integrated management interface based on the JMX technology comes at great advance.
Fig. 3 JIAC V basic structure
In the JIAC V basic structure (see Fig. 3), Agents simply provide a lifecycle, any additional features are implemented in Agent Beans. Each Agent Bean provides a special capability in a modular way, and by “plugging” it into an Agent, the Agent gets equipped with the bean’s feature. Agent Nodes provide an execution environment for multiple agents and consist of a Java Virtual Machine (JVM) running the JIAC V agent infrastructure. A Platform consists of multiple distributed Agent
ASGARD - A Graphical Monitoring Tool for Distributed Agent Infrastructures
7
Nodes, connected via a communication infrastructure, and provides the functionality for JIAC V applications. JMX (Java Management Extensions) [13] provide runtime access to Java objects from outside of a Java Virtual Machine for monitoring and management purposes. It has the benefits of requiring only very small changes to an exisiting Java implementation and providing a great level of abstraction to network technologies. These features make JMX an useful technology for all kinds of remote monitoring and management problems. As JIAC V already has a JMX-based management interface implemented, accessing JIAC applications this way is the most convenient method for ASGARD to provide runtime monitoring and management. JME (Java Monkey Engine) [7] is a 3D engine implemented in Java. Although its main purpose is providing a base for java-based games, the provided capabilities make it useful for all kinds of projects that require a three-dimensional graphical visualization. JME is based on the OpenGL [12] interface, which creates the possibility of implementing applications based on JME for various platforms. The binding to OpenGL is realized using native libraries for all supported operating systems so that JME provides a high performance environment for rendering 3D graphics. JME offers functionality like pre-made geometric primitives, import methods for loading common geometric mesh file formats, a scene graph implementation and animation controllers. Thus, the use of this engine greatly reduces the amount of work needed to implement the high-quality graphical visualization ASGARD offers.
4 Evaluation In order to evaluate ASGARD, a first prototype of the concept was implemented. The prototype is able to show a quick perspective on LAN-wide Agent Nodes currently in use, as well as detail information about agents. As the main motivation for the ASGARD concept was to create an easy-to-understand and use visual representation of a MAS, user tests were chosen as the best evaluation method. The prototype was furthermore used in the debugging process of the MAMSplus [9, 14] project. By using ASGARD to visualize the central MAS, developers were immediately able to identify agents that had been stopped without prior notice because of communication issues with a third party API. Those tests showed a demand for introspection and generated requests for more features that should be implemented (see Future Work). This proved that the path proposed in the initial concept is worth extending. The tests also showed the limitation of ASGARD not being able to run over a remote desktop connection due to the use of hardware 3D acceleration, this issue should be taken care of in future. Future evaluation will be done by tests with a larger and more diverse group of users, and the use of ASGARD as monitoring and demonstration tool in other projects.
8
Jakob Tonn and Silvan Kaiser
5 Related Work As the problem of monitoring and managing a complex software infrastructure like a distributed MAS is inherent in the structure of such systems, there are several other approaches, projects and implementations that focus on offering a solution to it by employing software visualization technologies. Shell based application monitoring is probably the most senior and still commonly applied technique for monitoring a running MAS. Generally direct program output and/or log files are written to the console. For distributed MAS this generally means several shell windows, concurrently showing the output of different entities of the MAS. This approach allows a low level insight into running programs but has a range of serious drawbacks. The most prominent being insufficient overview when concurrent events take place on different machines, as well as the lack of support for representing connections between the different events. These connections have to be searched for manually. Typically running program outputs are visually scanned for relevant textual patterns, an approach better suited for retrospective analysis but not for live monitoring. Richter-Peill provides a concept partially similar to ASGARD in his bachelor’s thesis [11]. His concept is focused on creating a 3D visualization of the interaction between agents at runtime in a Java Agent DEvelopment Framework (JADE) [2] MAS. Richter-Peill connects to the agent framework by adding an agent that gathers information and sends them to the visualization renderer. This approach has the disadvantage of changing the current MAS structure, which may lead to side effects in the system’s processes. As Richter-Peill focuses on visualizing interaction, a visualization of the MAS structure is not provided by his solution. This makes it impossible to use his concept to compare an implemented MAS to a design model. The ADAM3D [5] tool is also based on the motivation of making the debugging process of MAS implementations easier by creating a 3D visualization of the MAS. Ilarri et al. chose to use the 3rd dimension as temporal dimension to show the interaction between agents over time, sort of like a 3-dimensional sequence diagram. This approach makes ADAM3D a versatile tool for analysis, but does not provide insights into the structure of the MAS or a management interface. A similar timebased visualization could be added to ASGARD by means of a plugin in future. Ilarri et al. employ log output analysis as the base for their visualization. Whereas this approach has the advantage of working both during runtime as well as on saved output after a system’s run, it may require large-scale adaptions in an already existing MAS application. The JIAC NodeMonitor [8, p. 126] is the predecessor to the ASGARD concept. It provides a visual monitoring and management tool for a single Agent Node. The NodeMonitor provides a 2D visualization of the Agents on the connected Agent Node and features state visualization using icons and animated interaction representation. Furthermore, management of the visualized entities is provided using standard GUI technology like popup menus. Connection to the distributed MAS is established via JIAC V’s JMX management interface.
ASGARD - A Graphical Monitoring Tool for Distributed Agent Infrastructures
9
The NodeMonitor’s limitations are the focus on a single Agent Node and the lack of scalable visualization. When using it to monitor large and especially widely distributed applications, a lot of the entity relations in the system are not shown to the user. The lack of scalable visualization, that is caused by using two-dimensional raster image technology (in this case, Swing and Java2D), further enhances the difficulty of visualizing large-scale systems using the JIAC NodeMonitor.
6 Conclusion Contribution The main achievement of ASGARD is the consequent use of metaphors known from AOT design notations throughout the whole monitoring process. This makes the visualizations intuitively understandable. Thus, MAS have a clear and consistent visualization throughout the whole development lifecycle. The current implementation and structure of a MAS can be directly visualized at runtime using ASGARD and easily be matched and compared with the design concepts. Another important achievement of ASGARD is the ability to provide a quick overview over large-scale systems, and especially over distributed entities in a single application window. ASGARD generates the possibility to identify problems visually at runtime, instead of requiring the developer to analyze large log files after the application has been shutdown. A third aspect is ASGARDs extensibility. The plugin interface allows for extensions that can be goal-specific to an extremely high degree. This makes ASGARD a versatile tool for the debugging process of MAS and provides the possibility to create specific demonstrations of running systems. Summary Our motivation for the ASGARD concept is that a visual monitoring and management tool makes the process of administrating MAS easier and enables to verify implementations against design concepts. The JIAC V management interface forms an ideal base for an implementation of ASGARD. The use of visual metaphors known from the design process ensures easy understandability. As the ASGARD implementation follows a strict MVC pattern, modularity and extensibility through plugins are achieved. Compared to classical monitoring using log output on shells, connections between entities are much better visualized, and problems are much more easy to identify at runtime. Other concepts or tools try to visualize MAS as well, but either do not take the step back to design metaphors (Richter-Peill’s visualization) or are limited in their graphical abilities (JIAC V NodeMonitor), which ASGARD avoids by using highly scalable 3D visuals. Future Work The ASGARD concept with it’s modular structure can easily be extended to a greater range of functionality. In order to visualize running JIAC V systems in depth, visual representations of more structural entities are planned. Identifying Agents: Currently all Agents and Agent Nodes have a uniform appearance showing their individual basic entity types and states. For better orientation in larger platforms ways to distinguish between entities of the same type are
10
Jakob Tonn and Silvan Kaiser
needed. Different approaches, e.g. distinction based on roles, components or owner identities have to be researched. Visualization Plugins: In order to create an in-depth visual representation of a MAS infrastructure, plugins that visualize special aspects in detail, e.g. the entities inside of an Agent, are needed. Extended layouting: The modular concept for layout managers in ASGARD allows for new algorithms for entity layout to be implemented. While our current approach is effective when displaying approximately up to 30 Nodes with a few hundred Agents each, larger platforms require new layout scaling mechanisms for the ASGARD. Entity Selection: Last but not least search & group selection mechanisms are needed when dealing with large numbers of entities in the ASGARD. This will allow focussing and manipulating filtered subsets of the platforms entities.
References 1. Thomas Ball and Stephen G. Eick. Software Visualization in the Large. IEEE Computer, Vol. 29 No. 4:33–43, 1996. 2. Fabio Bellifemine, Agostino Poggi, and Giovanni Rimassa. JADE - a FIPA-compliant agent framework. In Proceedings of the Practical Applications of Intelligent Agents, 1999. 3. Stephan Diehl. Software Visualization - Visualizing the Strucutre, Behaviour and Evolution of Software. Springer, 2007. ISBN 978-3-540-46504-1. 4. Benjamin Hirsch, Thomas Konnerth, and Axel Heßler. Merging Agents and Services — the JIAC Agent Platform. In Rafael H. Bordini, Mehdi Dastani, J¨urgen Dix, and Amal El Fallah Seghrouchni, editors, Multi-Agent Programming: Languages, Tools and Applications, pages 159–185. Springer US, 2009. 5. Sergio Ilarri, Juan L. Serrano, Eduardo Mena, and Raquel Trillo. 3D Monitoring of Distributed Multiagent Systems. In WEBIST 2007 - International Conference on Web Information Systems and Technologies, pages 439–442, 2007. 6. Nicholas R. Jennings, K. Sycara, and Michael J. Wooldridge. A roadmap of agent research and development. Autonomous Agents and Multi-Agent Systems, 1:275–306, 1998. 7. JME Development Team, http://www.jmonkeyengine.com. Java Monkey Engine, 2009. 8. Jan Keiser. MIAS: Management Infrastruktur f¨ur agentenbasierte Systeme. PhD thesis, Technische Universit¨at Berlin, September 2008. 9. Thomas Konnerth, Silvan Kaiser, Alexander Thiele, and Jan Keiser. MAMS Service Framework. In Decker, Sichman, Sierra, and Castelfranchi, editors, AAMAS ’09: Proceedings of The 8th International Conference on Autonomous Agents and Multiagent Systems, pages 1351– 1352, Richland, SC, May, 10– 15 2009. International Foundation for Autonomous Agents and Multiagent Systems. 10. Trygve Reenskaug. Models-Views-Controllers. Technical report, Xerox-Parc, 12 1979. 11. Jarig Richter-Peill. Visualisierung der Interaktion in Multiagentensystemen. Bachelor’s thesis, University of Hamburg, Germany, 10 2005. 12. Mark Segal and Kurt Akeley. The Design of the OpenGL Graphics Interface. Technical report, Sun Microsystems, Inc, 1994. 13. Sun Microsystems, Inc. Java Management Extensions (JMX) Specification, version 1.4, 11 2006. 14. Alexander Thiele, Thomas Konnerth, Silvan Kaiser, Jan Keiser, and Benjamin Hirsch. Applying jiac v to real world problems: The mams case. In Lars Braubach, Wiebe van der Hoek, Paolo Petta, and Alexander Pokahr, editors, Multiagent System Technologies, volume 7 of Lecture Notes in Artificial Intelligence, pages 268–277, Hamburg, Germany, September 2009.