700 Ellicott Street | Buffalo NY, 14203
Tumor mutational burden (TMB) ring study: Comparison of multiple targeted next-generation sequencing (NGS) platforms
The right drug or right trial… For Every Patient
Jeffrey M. Conroy#1,2, Sarabjot Pabla1, Yirong Wang1, Sean T. Glenn1,2, Razelle Kurzrock3, Shumei Kato3, Ryosuke Okamura3, Denis A. Smirnov4, Brad Foulk4, Traci Pawlowski5, Dinesh Cyanam6, Geoffrey M. Lowman6, Blake Burgher1, Jacob Hagen1, Mary Nesline1, Antonios Papanicolau-Sengos1, Felicia L. Lenzo1, Mark Gardner1, Carl Morrison*1,2 OmniSeq, Inc1, Buffalo, NY; Roswell Park Cancer Institute2, Buffalo, NY; UC San Diego Moores Cancer Center3, La Jolla, CA; Janssen Research and Development4, Spring House, PA; Illumina, Inc.5, San Diego, CA; Thermo Fisher Scientific6, Carlsbad, CA #
[email protected]; *
[email protected]
Comparator Platform Study
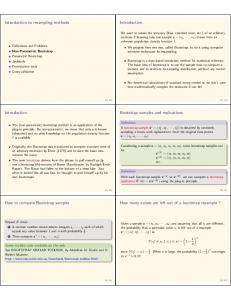
Introduction Tumor mutational burden (TMB), a measurement of the frequency of mutations in tumor cells, is currently being evaluated as a biomarker to predict response to immune checkpoint inhibitors (Figure 1). Whole exome sequencing is considered the gold standard assay, but is inefficient and too costly to run routinely. Consequently, several targeted NGS assays have been designed to measure TMB. In this study, we compared TMB measurements from four targeted NGS assays using a common source of specimens. Concordance and accuracy of TMB values, cutoffs, and clinical interpretations were assessed.
TMB Results
A Approach DNA input (ng) Fragmentation method Targeted panel size (Mbp) Genes/exons Probe length (bp) Probe design Probe number library chemistry Molecular index samples per run NGS instrument Coverage TMB value (mut/Mbp)
OmniSeq 30 none 1.7 409/6602 50-187 amplicon 15,992 AmpliSeq No 16 Ion torrent S5XL > 120x Non-synonymous
ThermoFisher 20 none 1.7 409/6602 50-187 amplicon 15,500 AmpliSeq No 4 Ion torrent S5XL > 500x Non-synonymous
Illumina 40 Sonication 1.9 523/7567 80 hyb-capture 39,759 TruSight Oncology 500 Yes 8 NextSeq DX > 100 MTC Non-synonymous
FoundationOne ≥ 50 Sonication 1.2 315/4557 120 hyb-capture 23,685 Custom No 32 Illumina > 250x Synonymous & Non-synonymous
C
B
Figure 4: TMB distribution and correlation (R) across platforms (left) and majority tumor types (right).
Analytical Performance A
B
Pan Cancer (n = 150*)
Figure 1: CheckMate 227 results demonstrating benefit of nivolumab plus ipilimumab in NSCLC patients with a TMB ≥ 10 mutations/Mb. Hellmann, MD, et. al., N Engl J Med 2018; 378:2093-2104.
NSCLC (n = 14#)
OmniSeq ThermoFisher Foundation Illumina
Methods Figure 3: A) TMB platform features, B) overlap of gene content, and C) cases included in ring study.
TMB testing was completed or first attempted by Foundation Medicine (FoundationOne®), followed by onsite analysis by OmniSeq (Immune Report Card®), Illumina (TruSight Oncology 500™), and ThermoFisher (Oncomine™ Tumor Mutation Load) from a subsequent central DNA isolation. Genomic DNA from 161 FFPE specimens representing 24 tumor types was extracted following anatomical pathologist review (Figure 2). Each laboratory followed its own protocol for reporting TMB values (Figure 3). Pairwise Pearson product-moment correlations (R) were performed to estimate concordance of TMB values between platforms (Figure 4). 150 gold standards were established (7 TMB-high, 143 TMB-low) for which at least three of four platforms were concordant when using a TMB-high cutoff of ≥ 10. Each platform was assessed for TMB interpretation accuracy at this threshold (Figure 5).
Platform Omniseq ThermoFisher FoundationOne* Illumina
Assay Robustness
TP 7 7 5 7
TN 141 138 95 140
FP 2 5 11 3
FN 0 0 0 0
#FM1
*FMI = 111 pan-cancer samples.
Samples Attempted
TMB Resulted
Sample Fail
% Resulted
Illumina (TruSight Oncology 500™)
161
153
8
95%
OmniSeq (Immune Report Card®)
213
202
11
95%
ThermoFisher (Oncomine™ Tumor Mutation Load)
161
154
7
96%
Foundation Medicine (FMI)
NA
177
18
NA
Platform
C
False Positives
Platform Omniseq ThermoFisher FoundationOne# Illumina
TP 3 3 1 3
TN 11 11 6 10
FP 0 0 0 1
FN 0 0 0 0
= 7 NSCLC samples.
Boundary False Positives
No Consensus
Table 1: Performance of TMB platforms across a common set of cases. Figure 5: Analytical performance of 150 pan cancer samples (A) and 14 NSCLC samples (B) using consensus >10 as a gold standard true positives (TP) for TMB-high. C) Plot of false positive (FP), boundary FPs and non-consensus calls at the 10 cutoff. = FP boundary
Conclusions
Figure 2: Tumor types evaluated for TMB using several targeted NGS panels SITC 2018 – P707
Table 2: Assignment and performance of TMB platforms across various TMB ranges
• TMB performance is robust across platforms using a wide range of solid tumor specimens. • There is general concordance between the platforms, but low number of TMB high samples limit statistical analysis. • Pair-wise linear regression model fits did not significantly improve concordance between platforms (p>0.05) • Each platform is highly accurate when using a TMB-high cutoff of ≥10, which improves when restricted to NSCLC. • Majority of FP calls are boundary related to the TMB-high cutoff of ≥10. • Further studies utilizing additional NGS platforms and gold standard samples are required. Copyright 2018 OmniSeq, Inc.