Assessing Band Selection and Image Classification Techniques on HYDICE Hyperspectral Date John A. Marin Department of Electrical Engineering and Computer Science United States Military Academy West Point, New York 10996
[email protected] John Brockhaus Department of Geography and Environmental Engineering United States Military Academy West Point, New York 10996
[email protected] James Rolf Department of Mathematics United States Military Academy West Point, New York 10996
[email protected]
James Shine
U.S. Army Topographic Engineering Center 7701 Telegraph Road Alexandria, VA 22315-3864 jshine @ tecsunl.tec.army.mil Joseph Schafer, Andrew Balthazor Department of Electrical Engineering and Computer Science United States Military Academy West Point, New York 10996
ABSTRACT This report describes some preliminary results concerning the robustness and generalization capabilities of manual (parametric) methods versus machine learning methods in the band selection and subsequent classification of hyperspectral images. We specifically compare a genetic algorithm-based approach to an end-member and spectral unmixing approach in the selection of data used for classification of a HYDICE image. We then discuss and compare the classification of the image using supervised and unsupervised techniques, as well as a backpropagation neural network.
1. Introduction This in an interim report of a multiyear experiment designed to test the robustness and generalization
0-7803-5731-0/99$10.00 01999 IEEE
1-1067
capabilities of manual (parametric) methods versus machine learning methods such as neural networks in the classification of hyperspectral images. The data used for this research is a HYDICE Image depicting a region of Fort Hood, Texas. The HYDICE image consists of 210 bands of data, sliced at lOqm with a 2.5m spatial resolution providing a unique data source to analyze. Reference [l] describes the data set and collection process. In this report we address the topic of data reduction using genetic algorithms versus other software assisted methods requiring the interaction of an analyst. Since a HYDICE image consists of 210 spectral bands of data, then there exists 22’0-1 possible combinations of bands to use in a classification process. Our research indicates that an image may be classified with 11 or fewer bands with little loss of accuracy in the classification process.
The remainder of this paper is organizes as follows. In section 2 we describe the process of band selection. We use both a genetic algorithm and a commercially available software package to assist in the selection of bands for further research and analysis. Section 3 describes the classification processes we used on the resultant bands. These classification processes include manual (parametric) methods and neural networks. In section 4 we describe results and a final section presents a conclusion and areas for further research.
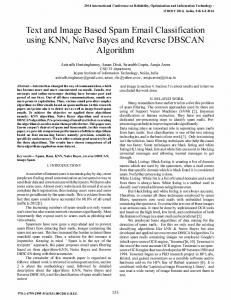
2. Band Selection The process of band selection begins with a cursory examination of the bands for the respective image. Figures I through 4 below depict four different 125 x 125 pixel images of the same area from four different bands of the HYDICE image. In Figure 1, a lake is clearly seen in the center of the image, but this lake is not discernible in Figure 2. However, roads appear brighter in Figure 2. In Figure 3, both the roads and lake are distinguishable. Figure 4 depicts a noisy band that is effectively useless.
Figures 1 and 2: 125 x 125 pixel image of bands 84 and 3 of the HYDICE image
Figures 3 and 4: 125 x 125 pixel image of bands 163 and 106 of the HYDICE image In order to select the bands for a subsequent classification, we used both a genetic algorithm approach and a software assisted end-member selection approach. We devised a training set of 2,816 pixels divided into the following seven categories: bright roads, lighter roads, sparse grass, medium grass, dense grass, trees, and water. The following sections describe both the genetic algorithm and end-member selection approach.
Genetic Algorithm Approach Genetic algorithmic approaches allow machines to simulate nature’s process of natural selection and appear to work on a large class of interesting problems for which no reasonably fast algorithms exist. We plan on employing two separate genetic algorithms systems for this research. One commercially available software package called NeuralSIM [2], and a separate genetic algorithm system we are constructing ourselves. However, the testing of the genetic algorithm system we constructed is incomplete at this time, so the results we describe here were obtained using NeuralSIM. NeuralSIM employs a genetic algorithm to select variables and uses a backpropagation neural network for the subsequent classification or prediction. NeuralSIM uses multiple regression with a SoftMax shaping function [2, 31 as the fitness function for classification problems. Finally, NeuralSIM allows the user to control several parameters effecting the genetic algorithm, such as population size, crossover probability, and parent selection (you can select uniform, fitness, or rank independently for either parent). We employed the genetic algorithm for 10 trials, with a population size and number of generations ranging from 40 to 100. We likewise varied other parameter settings, such as the type of crossover, probability of crossover, and probability of mutation. Finally, we always randomly selected approximately 20% of the original training set of data to be used as a validation set. Results concerning the band selection using the genetic algorithms were quite interesting. The average classification accuracy for all categories in the training and validation set combined was 99.79% and for the validation set alone was 98.15%. Typical results for one trial are depicted below in Table 1 in the form of a confusion matrix. Note the classification results in Table 1 resulted from using 1lof the 210 available bands as recommended by the genetic algorithm. The subsequent classification was carried-out using a backpropagation neural network consisting of eleven nodes in the input layer, one four-node hidden layer, and an output layer with seven nodes.
I -1068
To determine if the bands surrounding band 192 were from similar populations, we computed a two-tailed paired t-statistic and Pearson Correlation Coefficient. The t-statistic would indicate if the means were from the same population while the correlation coefficient would show the covariance relationship between the respective bands.
tree water Total 0
380
0
557
0 321
128 0 0
Table 4 shows the values for the t-statistic using band 192 in comparison to the other bands while Table 5 shows the correlation between band 192 and the other respective bands.
760
361 0 water
I
I
I
I
0
309
309
--
Total 1375 1554 (324 (129 1762 309 2816 363 Table 1: Confusion matrix depicting the : ibseqi ent
I
classification accuracy of the trainin : set bstrac ted from the HYDICE image.
HYDICE Bands (with respect to band 192) I891 1901 1911 I931 1941 195 Roads -4.311 3.771 -3.521 1.111 0.421 -2.30 Grass1 1.531 7.981 -3.581 5.771 13.881 14.481 Trees -112.5 1.96 -119.3 -1O.OOl -2.02 -7.19 Water -125.0 1.34 -124.9 1.341 -124.9 -14.53 means between band 192 and the band indicated in the respective column.
Another interesting result from the genetic algorithm approach was the appearance of two specific bands in the majority of the final solutions. Band 192 was selected in 10 of 10 trials and Band 4 was selected in 8 of 10 trials. Because of the stochastic nature of genetic algorithms, we were surprised that any bands were selected so consistently. We expected clusters of bands to be selected, but not individual bands. Thus, we attempted to deduce why band 192 was always selected through a preliminary data analysis.
I HYDICE Bands (with respect to band 192) I
1891 1901 1911 I931 1941 295 0.9981 0.9981 0.9981 0.995) 0.9941 0.9921 Grass1 0.9461 0.9431 0.9411 0.9221 0.8961 0.928) Trees( 0.9681 0.9681 0.9641 0.9521 0.9541 0.939 Water! 0.8971 0.9941 0.7511 0.9941 0.7511 0.729 Table 5.- Pearson Correlation Coefficient between
I Roads]
I
band 192 and the band depicted in the band indicated in the respective column.
We analyzed the relationship between band 192 and bands 189 through 195. Tables 2 and 3 depict the means and variance of the brightness values (gray levels) of these bands. Note, we limited the number of categories to four for presentation purposes.
Figure 5 below graphically depicts the results of the t-statistic displayed in Table 4. Note the t-statistic values were limited to minus 20 for presentation purposes.
I
t-S tatistic
15.00 10.00
5.00 0.00
Table 2: Mean values for gray levels for selected bands.
-5.00
-10.00
1
HYDICE Bands
-15.00
-20.00
Roads
Grass
Trees
Water
HYUCEBand with respect to band 192
~~
Table 3: Variance of gray levels for bands selected bands
I -1069
Figure 5: Paired t-statistic for equal means between band 192 and other bands for respective terrain category.
It appears that band 192 is indeed different from the other bands. We originally suspected that more homogeneous terrain features like roads would be similar across bands close together. However, our results indicate that water, a very homogeneous feature, is not statistically similar to the bands in the interval 189 to 195 when compared to band 192. Since it is apparent that band 192 is statistically different from nearby bands, it is interesting to try and determine why the genetic algorithm always selected band 192. In examining our results for bright roads, the means from the different bands are statistically equal (see Table 4). The Correlation Coefficient for roads between band 192 and other bands was also high. However, for water, the mean for band 192 and other bands are not the same, and the variance for band 192 was lower than other bands possibly indicating band 192 depicted water more accurately in the classification process. As stated earlier, in order to employ other fitness functions and capabilities typical of genetic algorithms, we constructed our own genetic algorithm system. However, at this time we do not have sufficient data to report results, however, initial results are very similar to reported in this paper.
End-Member Selection and Spectral Unmixing This image analysis technique is based upon the assumption the majority of pixels in an image are mixed. That is, the area encompassed by a pixel will likely contain more than one land cover type. Therefore, rather than assign a pixel to a single land cover type this approach attempts to determine the mixture of land cover types for a given pixel. Linear mixture modeling assumes that a finite number of spectrally pure pixels, referred to as endmembers, exist within an image. Pixels that are not homogenous should, therefore, be a linear combination of these end members. End-member selection is the key to the success of this process. The approach to linear mixture modeling taken in this study was a four step process: 1) spectral data reduction; 2) spatial data reduction; 3) multidimensional visualization of the spatially reduced data and identification of end-members; and, 4) linear mixture modeling and spectral unmixing of individual pixels. We subsequently explain each of these steps. Spatial Data Reduction: Reduction of the spectral dimensionality of the image data is accomplished through the application of a two cascaded principal components analysis referred to as a minimum noise
fraction transformation [4, 51. In the first transformation image noise is decorrelated. A standard principal components analysis follows the noise decorrelation and the inherent dimensionality of the data is determined through an examination of the eigenvalues of the derived images. This procedure allows the analyst to divide the resulting image bands into two sets: 1) bands with large eigenvalues and noise free images; and, 2) bands with near unity eigenvalues that are dominated by noise [6]. In our case, analysis of the eigenvalues and evaluation of the corresponding images allowed us to reduce the inherent dimensionality of the Hydice data set from 210 wavebands to 23 principal component images. Reduction of the spatial dimensionality, that is the total number of pixels to be considered in the selection of endmembers, was performed through the use of a pixel purity index (PPI) algorithm. The PPI algorithm identifies the most spectrally homogenous pixels in an image. This process uses convex geometry and the iterative projection of multidimension scatter plots to identify pixels that repeatedly occur on the extremity of plots [7]. Following the application of the PPI algorithm to the first 23 principal component images, the spatial dimensionality of the data was reduced to 4,315 pixels from the original 409,600 pixels contained in the image. This data reduction required 3,000 iterations of the algorithm and took 33 hours to complete. Multi-dimensional Visualization and EndMember Identification: The multi-dimensional Visualization of the data derived from the PPI is conducted in an attempt to identify homogenous endmembers. This is a subjective process during which the analyst views a rotating multi-dimensional scatter plot of the PPI data. As the data rotates, the analyst selects pixels that are located in the corners of the scatter plot. These pixels represent the unique endmembers that occur within the image. The land cover identity of these endmembers is determined by spatially linking the end-members to a false color composite of the HYDICE imagery and evaluating the land cover types observed at these locations. Linear Mixture Modeling and Spectral Unmixing: End-member digital number vectors and the first 23 principal component images were used in conjunction with a linear mixture model to determine the end-member fractional components of each pixel in the imagery. The resulting classified image was evaluated to identify those pixels that were dominated by a single cover type. A series of seven images, one corresponding to the spatial distribution
I -1070
of each of the seven land cover types being studied, were derived from this analysis.
3. Classification of HYDICE Image Supervised Classification In this classification technique pixels of unknown identity are assigned to classes corresponding to user defined land cover categories. An analyst selects pixels, or groups of pixels, that are representative of the various types of land cover classes occurring within the study site. The digital numbers for these pixels are then used to calibrate a classification algorightm. Once the algorithm is calibrated then each pixel in the image is assigned to one of the defined land cover classes. Unsupervised Classification In this classification technique pixels are clustered into natural groupings based only on digital number statistics. User defined training data representative of land cover classes are not used in this approach. The ISODATA unsupervised clustering algorithm was used to conduct the unsupervised classification of the hyperspectral imagery. In this study 40 clusters of data were identified by the ISODATA algorithm. These clusters were selected using the digital numbers from each of the 210 wavebands for each pixel. Neural Network (Automatic) Methodology Several studies attest to the capability of neural networks to outperform traditional classification methods for feature extraction and classification in multispectral satellite images [8, 9, 101. We used the backpropagation algorithm available with the NeuralSIM software package to train a neural network. This software package builds the network adding nodes to the hidden layer until a degradation in performance is observed on a test set of data. We also used the bands recommended by the genetic algorithm. Manual Classification Results Due to a current lack of reliable ground truth, an exact assessment of the classification method is not possible at this time. Results from each of the manual techniques (supervised, unsupervised, and linear mixture modeling) showed that dirt roads were often confused with the areas containing grass. These roads were visually evident on the imagery. However, it was also clear from the imagery that these roads were used infrequently and that grass was in various stages of re-growth on these sites. In the near infrared wavebands, infrequently used roads showed higher reflectance than dirt roads that were being actively used in training maneuvers. We believe this is due to the presence of the vegetative matter, Thus, the
1-1071
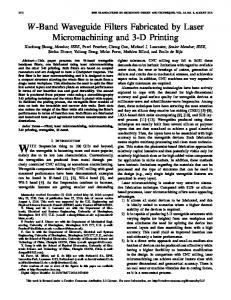
classification algorithms assigned these features to the grass land cover category. Comparison of the classified images with a false color composite of the imagery showed that dirt roads containing little to no vegetative component seemed to be accurately identified by each of the three manual classification algorithms. Pixels assigned to the paved road category by the three manual classification techniques corresponded very closely to the spatial distribution of this feature in the imagery. The two water bodies within the study area were accurately identified using the manual classification techniques. Scattered pixels that were not water were, however, committed to the water category. At first it was felt that these pixels might actually be part of streams meandering in and out of the over-story forest canopy. Further examination of the spatial distribution of these pixels showed that they were in reality shadows of trees. Shadows result in low reflectance across all wavebands causing the classifiers to incorrectly assign these pixels to the water category. Neural Network Classification Results Figure 6 below depicts a 100 x 200 pixel region classified in the seven previously described terrain categories using 11 of the 210 available HYDICE bands. The neural network is the same eleven input, four-node single hidden layer, seven output backpropagation neural network described in the band selection with genetic algorithm section.
Figure 6. Classification of a 100 x 200 pixel region of the HYDICE image using a backpropagation neural network. A visual inspection of the classified image depicted in Figure 2 indicates the bands selected by the genetic
algorithm and subsequent classification by the backpropagation neural network are very accurate. It, it appears this system classified all water bodies correctly, extracted roads and trails, and differentiated correctly between the trees and different levels of grass. Additionally, the neural network did not misclassify the darker unused roads as vegetation. Using a personal computer with two 300 MHz processors, it required less than two hours to select the bands with the genetic algorithm and train the neural network. We feel we could reduce this time significantly through more efficient more efficient coding procedures.
4. Summary and Future Work We have presented an interim report on a multiyear experiment, This experiment is designed to assess the robustness and generalization capabilities of manual (parametric) methods versus machine learning methods such as neural networks in the classification of hyperspectral images. Key features of this research include the application of genetic algorithms to the problem of band selection and subsequent classification of a HYDICE image with a reduced set of bands. This reduction is significant in that we were able to produce very good classifications with eleven or fewer of the 210 bands available. Future work for this project includes applying a genetic algorithm constructed specifically for the problem of band selection. This genetic algorithm will allow the user to employ different fitness functions, such as a minimum distance classifier. Additionally, this genetic algorithm will allow niching strategies and a variety of genetic operators. We plan to test the recommended bands using different HYDICE images to assess the robustness associated with the genetic algorithm-recommended bands. We will also do more testing within the recommended bands to determine if there is a unique relationship amongst these recommended bands. In other words, do certain bands work better together, or are there intervals of bands that are superior. Finally, we plan to broaden our research to include a comparison of classification techniques to estimation techniques such as kneging, and bivariate generalized cross validated thin plate splines. Our goal is to perform a complete analysis of the various data reduction, estimation and classification techniques.
References [ l ] McKeown, D., S. Cochran, S. Ford, C. McGlone, J. Shufelt and D. Yaocum, “Fusion of HYDICE Hyperspectral Data with Panchromatic Imagery for Cartographic Feature Extraction,” IEEE Transactions on Geoscience and Remote Sensing, 37, 1999, pp. 1261- 1278. [2] NeuralSZM, Technical Publications Group, Aspen. Inc., Pittsburgh, PA, 1999. [3] Bishop, C. Neural Networks for Pattern Recognition. Clarendon Press, Oxford, 1995. [4] Boardman, J. W., and F. A. Kruse. “Automated Spectral Analysis: A Geologic Example Using AVIRIS Data, North Grapevine Mountains, Nevada,” in Proceedings, Tenth Thematic Conference on Geologic Remote Sensing, Environmental Research Institute of Michigan, Ann Arbor, MI, 1994. [5] Green, A. A., Berman, M., Switzer, P., and M. D. Craig. “A Transformation for Ordering Multispectral Data in Terms of Image Quality with IEEE Implications for Noise Removal, Transactions on Geoscience and Remote Sensing, v. 26, no. 1,1988, pp. 65-74. [6] Boardman, J. W. “Automated Spectral Unmixing of AVIRIS Data Using Convex Geometry Concepts,” in Summaries, Fourth JPL Airborne Geoscience Workshop, 1993, pp. 11-14. [7] Boardman, J. W., Kruse, F. A., and R. 0. Green. “Mapping Target Signatures Via Partial Unmixing of AVIRIS data,” in Summaries, Fifth JPL Airborne Earth Science Workshop, 1995, pp. 23-26. [8] Bischof, H., W. Schneider, and A.J. Pinz. “Multispectral Classification of Landsat-Images using Neural Networks,” IEEE Transactions on Geoscience and Remote Sensing, 30, 1992, pp. 482-439. [9] Marin, J.A., “An Inductive Approach to the Extraction of Roads from Multispectral Satellite Dissertation, School of Images”, Doctoral Engineering and Applied Science, University of Virginia, Charlottesville, VA, Aug, 1995. [ 101Paola, J., and R. Schwoengerdt. “A Detailed Comparison of backpropgation Neural Network and Maximum-Likelihood Classifiers for Urban Land Use Classification,’’ IEEE Transactions on pp. Geoscience and Remote Sensing, 33, 1995, 98 1-996. ”
I -1072