a variety of low level charge-imparting PTMs, such as deamidation, ..... Asparagine deamidation and aspartic acid isomerization are observed as distinctly.
Assessing Biosimilarity by Monitoring Multiple Critical Quality Attributes of an Intact Monoclonal Antibody Drug Using Orbitrap Native LC-MS Aaron O. Bailey1, Bobby Gamez1, Terry Zhang1, Stephane Houel1, Shanhua Lin2, Guanghui Han3, Katie Southwick1, Wendy Sandoval3, Jonathan L. Josephs1. 1Thermo Fisher Scientific, 355 River Oaks Parkway, San Jose, CA, USA, 95134; 2Thermo Fisher Scientific, 1228 Titan Way, Sunnyvale, CA, USA, 94085; 3Department of Microchemistry, Proteomics and Lipidomics, Genentech Inc., South San Francisco, CA, USA, 94080
ABSTRACT Purpose: To demonstrate feasibility of workflow for monitoring multiple critical quality attributes of a therapeutic protein drug as analyzed in the intact form. Methods: We analyzed proteins using pH-elution ion exchange coupled directly to native ESI-MS. Isoform identification was accomplished using Thermo Scientific™ BioPharma Finder™ software and XIC-based isoform relative abundance measurements were performed using Thermo Scientific™ Chromeleon™ software. Results: We demonstrate that ion exchange native MS provides high precision intact mass measurement of Herceptin® and a trastuzumab biosimilar and that Chromeleon software may be used to measure the XIC-based relative abundances of individual CQA isoforms.
INTRODUCTION Manufacturing of innovator biologics can be successfully mimicked to produce generic “biosimilar” drug products. In order to satisfy safety and efficacy requirements, a biosimilar drug must be reasonably comparable to an innovator. Comparability is directly assessed by measuring a panel of critical quality attributes (CQAs). Recently, a multi-attribute method has been demonstrated to measure several CQAs simultaneously using LC-MS peptide mapping data. Additional CQAs, such as charge variants or size variants (i.e., aggregation/fragmentation), are conventionally monitored at the intact level using ion exchange (IEC) or size exclusion chromatography (SEC), respectively. Native LC-MS approaches, such as SEC-MS and IEC-MS, combine the traditional gold standard chromatographic assays with accurate mass measurement to allow isoform-specific monitoring of multiple CQAs of intact therapeutic proteins.
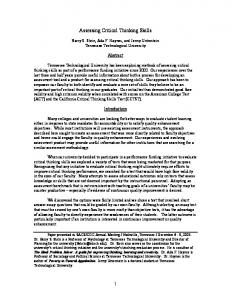
MATERIALS AND METHODS Intact trastuzumab was separated by IEC (Thermo Scientific™ ProPac™ WCX-10 column) directly coupled to MS. Mobile phases consisted of aqueous 50 mM ammonium acetate, using a pH gradient from 6.8 to 10.1. LC-MS was accomplished using a Thermo Scientific™ Vanquish™ H-Class UHPLC system with a variable wavelength detector directly connected to a Thermo Scientific™ Q Exactive™ HF-X Orbitrap™ mass spectrometer. Native LC-MS raw data were analyzed using a time-resolved deconvolution approach utilizing Sliding Window and ReSpect algorithms in BioPharma Finder software. Chromeleon software was used to integrate XIC peak areas and relatively compare CQAs of innovator and biosimilar drug samples. Figure 1. Platform for on-line native IEC-MS method. Essential instrumentation for our platform includes the ProPac WCX-10 weak cation exchange column, the Vanquish Horizon UHPLC, the Q Exactive HF-X Orbitrap mass spectrometer, and BioPharma Finder data analysis software. Chromeleon 7.2.7 software
BioPharma Finder 3.0 software
ProPac WCX-10 column 4 x 250 mm
DEAMIDATION / ISOMERIZATION PATHWAY DOMINATES TRASTUZUMAB CHARGE VARIANT MS PROFILE Deamidation and isomerization isoforms pose challenge of near-isobar heterogeneity Trastuzumab includes several known residues in the light chain and heavy chain sequences, which may undergo deamidation (LC-N30) or isomerization (HC-D102) or both at once (HC-N55). These modified isoforms are considered to be ‘near-isobars’, which exhibit mass differences in the range of 0-2 Da, and pose an issue for accurate mass identification by MS. These deamidation and isomerization isoforms are observed in the charge variant profile and can be observed directly using pH-elution ion exchange coupled directly to Orbitrap native MS. Figure 2. Asparagine deamidation and aspartic acid isomerization are observed as distinctly separated chromatographic peaks in the charge variant profile. These isoforms are nearisobars, ranging in theoretical mass differences of 0-2 Da, making independent intact mass analysis a challenging endeavor. Isoform identities were previously attained by Harris et al., using fractionation and peptide mapping of each LC peak (Reference 1).
%
0
Q Exactive BioPharma Native IEC-MS (“CVMS”) R = 45,000
Sliding Window deconvolution and sequence matching
Low tolerance (3 ppm) • High precision • High abundance species
CQA Targeting XIC relative abundance
7
+1
8
+1
9
10
• High sensitivity • Low abundance species
Modification (isoform)
Main peak ∆M
0
13
2 x Deamidation LC-N30
+2
IsoAspartate HC-N55
+1
Deamidation LC-N30
+1
†!
Deamidation LC-N30 IsoAspartate HC-D102
+1
Relatively unmodified
0
*
! ‼
14
IsoAspartate HC-D102
0
2 x IsoAspartate HC-D102
0
1
1 / 6.6
3/3
Succinimide (from Aspartic Acid)
G0F/G0F vs. G0F/G0F + AspSucc
18 / 118
15 / 15
2
Lysine
G0F/G1F vs. G0F/G0F + Lysine
34 / 224
15 / 15
3
Sialic Acid
G2F/G2F vs. G0F/S1G1F
34 / 224
15 / 15
4
Hexose
G0F/G0F vs. G0F/G1F
162 / 1069
15 / 15
Mean Relative Abundance (%)
Mean Apex RT (min)
148057.95
0.28 / 1.85
3.06 / 20.23
63.53
25.94
Herceptin
1xDeamidation (N),2xA2G0F
148059.36
0.83 / 5.46
3.50 / 23.09
4.76
21.34
Herceptin
1xA2G0F,1xA2G1F
148219.81
0.18 / 1.19
2.86 / 18.89
100.00
25.71
Herceptin
1xDeamidation (N),1xA2G0F,1xA2G1F
148221.33
0.43 / 2.85
3.41 / 22.48
10.63
20.44
Herceptin
2xA2G1F
148381.81
0.39 / 2.59
2.79 / 18.44
70.36
25.49
Herceptin
1xDeamidation (N),2xA2G1F
148383.05
0.99 / 6.55
3.05 / 20.15
5.08
20.58
Trastuzumab Biosimilar 1
2xA2G0F
148058.74
0.15 /1.01
3.87 / 25.55
100.00
26.07
Trastuzumab Biosimilar 1
1xDeamidation (N),2xA2G0F
148060.26
0.30 / 1.95
4.42 / 29.16
7.87
20.67
Trastuzumab Biosimilar 1
1xA2G0F,1xA2G1F
148220.65
0.19 / 1.25
3.71 / 24.50
40.16
25.89
Trastuzumab Biosimilar 1
1xDeamidation (N),1xA2G0F,1xA2G1F
148222.84
0.65 / 4.26
4.95 / 32.67
4.44
20.57
Trastuzumab Biosimilar 1
2xA2G1F
148382.58
0.37 / 2.44
3.58 / 23.62
15.76
25.74
Trastuzumab Biosimilar 1
1xDeamidation (N),2xA2G1F
148383.60
0.91 / 6.00
3.62 / 23.87
0.90
20.32
100
G0F/G0F vs. G0F/G0F + Deamidation
Mean Mass Accuracy vs. Theoretical (Da /ppm)
Trastuzumab biosimilar
0 100 0 100 0 100 0
100
BPC
BPC
0 100
G0F/G0F Deamidation
G0F/G1F Main and Isomerization 0 100
20.586
NL: 6.29E4
25.874
NL: 4.32E5
20.452
NL: 3.57E4
25.608
NL: 4.71E5
2
20.318
NL: 7.62E4
25.672
NL: 4.40E5
3
NL: 4.31E4
25.671
NL: 4.94E5
4
20.384
10
20 30 RT (min)
40 10
20 30 RT (min)
40
1
0 100 0 100 0 100 0
10
G0F/G0F Main and Isomerization BPC
BPC 20.718
NL: 5.52E4
26.072
NL: 5.42E5
20.781
NL: 5.85E4
26.134
NL: 4.87E5
20.651
NL: 6.32E4
26.070
NL: 5.26E5
20.517
NL: 5.69E4
26.001
NL: 5.53E5
20 30 RT (min)
40 10
20 30 RT (min)
Native IEC-MS analysis of intact trastuzumab resulted in a chromatographic profile consistent with previously published data. Time-resolved deconvolution analysis of the innovator drug resulted in identification of several specific isoforms comprised of differential N-glycosylation in combination with a variety of low level charge-imparting PTMs, such as deamidation, C-terminal lysine removal, or sialylation of N-glycans. We confirmed that the main peak consisted of several isoforms corresponding to variable N-glycosylations of the trastuzumab amino acid sequence. When comparing the innovator and biosimilar products, we found marked differences in glycoform profile measured at the main peak. Furthermore we found measureable differences in several charge variant isoforms when comparing innovator and biosimilar. These differences observed were consistent with a comparison of these same two samples via MAM HRAM peptide mapping analysis (data not shown). Figure 4. Glycoform profiles are easily identified using ReSpect and Sliding Window algorithms in Biopharma Finder software. Our “moderate” mass tolerance of 15 ppm is wide enough to detect both deamidated and main peak forms of trastuzumab. We readily observed distinct glycoform profiles for Herceptin and biosimilar trastuzumab samples. Trastuzumab 2xA2G0F 148058.35
Herceptin
100 80
40 100
BPC
0 100
25.940
0 100
147500
148000
148500 Mass
149000
100 NL: 3.79E5
BPC
15
20
25 RT (min)
30
NL: 5.45E5
25.940
NL: 1.10E5
NL: 2.70E5
25.675
5460
5480
5500 m/z
5520
15
20
25 RT (min)
30
35
Average Mass
Modification
Matched Theoretical Mass Error Mass (Da) (ppm)
1xAspSucc,1xA2G0F,1xA2G1F 148202.70 148199.00 1xAspSucc,2xA2G1F 148363.70 148361.06 1xAspSucc,2xA2G0F 148041.88 148036.94
24.9 17.8 33.4
Apex RT
33.9367 33.6723 33.9367
Sialic acid glycoforms (“acidic” RT shift) identified on innovator, Herceptin Modification 1xA2G1F,1xA2S1G1F 1xA2G0F,1xA2S1G1F 1xA2G2F,1xA2S1G1F
Matched Average Theoretical Mass Error Mass Mass (Da) (ppm) 148834.37 148832.22 148674.54 148670.17 148997.35 148994.27
14.5 28.4 20.7
23.7587 23.7587 23.7587
Matched Average Theoretical Mass Error Apex RT Mass Mass (Da) (ppm)
1xLys,2xA2G0F 148188.56 148183.13 1xLys,1xA2G0F,1xA2G1F 148349.36 148345.19 1xLys,2xA2G1F 148513.21 148507.25
36.7 28.1 40.1
70%
50% 40% 30% 20%
0%
1xA2G0F
1xA2G1F
1xA2G0,1x A1G0F
2xA2G0
Herceptin 30 ppm
1.85%
2.52%
2.37%
3.37%
Biosimilar 30 ppm
1.47%
12.94%
4.01%
100% 90% 80% 70% 60% 50% 40% 30% 20% 10% 0%
20
Mass
148500
149000
5500
5520
80
40
0 5480
1xA2G0,1x 1xA2G0F,1 1xA2G1F,1 1xA2G1F,1 1xA2G1F,1 2xA2G0F 2xA2G1F 2xA2G2F A2G0F xA2G1F xA2G2F xA2S1G0F xA2S1G1F 67.28%
100.00%
72.16%
22.84%
100.00%
65.86%
24.00%
8.64%
3.37%
6.39%
4.51%
m/z
Figure 7. Isoform charge state m/z values and RT information can be used to create a processing method with flexible options for XIC integration. We quantified 3–4 charge states for each isoform, which is shown here in an overlay plot shaded for customized integration specific for the main peak and deamidated isoforms of G0F/G0F, extracted at 3, 15, 30, and 45 ppm tolerances.
Main Peak (2xG0F, G0F/G1F, 2xG1F)
C-term Lysine (2xG0F, G0F/G1F, 2xG1F)
Sialic Acid (G0F/S1G1F, G1F/S1G1F)
Succinimide (2xG0F, G0F/G1F, 2xG1F)
Deamidation (2xG0F, G0F/G1F, 2xG1F)
Herceptin 15 ppm
100.00%
0.00%
3.28%
6.44%
12.88%
Biosimilar 15 ppm
100.00%
18.13%
0.00%
1.13%
15.59%
CONCLUSIONS • Method for monitoring multiple CQAs of an intact biotherapeutic compound to allow direct comparison of innovator and biosimilar products. Orbitrap mass analyzer is capable of mass measurements with high (sub-Dalton) precision BioPharma Finder software can be used to manually export mass lists from native ion exchange MS experiments, and m/z values may be targeted and quantified in Chromeleon software.
REFERENCES 1. Harris RJ, Kabakoff B, Macchi FD, Shen FJ, Kwong M, Andya JD, Shire SJ, Bjork N, Totpal K, Chen AB. Identification of multiple sources of charge heterogeneity in a recombinant antibody. J Chromatogr B Biomed Sci Appl. 2001 Mar10;752(2):233-45
Apex RT
C-terminal lysine-retaining isoforms (“basic” RT shift) identified on trastuzumab biosimiliar Modification
80%
10%
Tras 2xA2G1F 148382.57
Figure 5. Screenshots from BioPharma Finder software show that lower-level CQA isoforms such as succinimide conversion from aspartic acid, sialic acid glycoforms, and C-terminal lysine-retaining isoforms are distinctly identified by mass and retention time shift relative to the main peak. Aspartic acid conversion to succinimide (“basic” RT) identified on innovator, Herceptin
90%
Figure 6. BioPharma Finder intact protein analysis results can be curated to determine which species should be monitored as CQAs. Interesting isoforms can be selected (box checked) to mark for export in spreadsheet format. To export the constituent charge states’ centroid m/z values for the isoforms identified by BioPharma Finder software, right-click > “Export Checked” > “All Levels”.
20
0
0
100%
Charge Variant Glycoforms Relative to Main Peak Glycoforms
80
148000
Relative Abundance of Main Peak Glycoforms
60%
60
0 100
40
35
26.072
Figure 8. Intact glycoforms and charge variant CQAs can be simultaneously monitored. Charge variants CQAs are analyzed as groups of glycoforms, which may be useful for comparing innovator and biosimilar drugs. As shown below, we observed the biosimilar trastuzumab to contain decreased levels of succinimide isoforms compared to Herceptin, but to have markedly higher levels of C-terminal lysine retention.
We sought to develop a workflow that performs targeted quantitation of isoform charge states identified by Sliding Window deconvolution of native IEC-MS datasets. We manually exported the centroid m/z values of the charge states of isoforms identified by ReSpect / Sliding Window analysis in BioPharma Finder software. Centroid m/z values were averaged from the 4 replicates and these average values were targeted in Chromeleon.
100
20
0
Quantitative monitoring of protein drugs can be easily accomplished using peptide mapping LC-MS using a so-called Multi-Attribute Method (MAM) (Reference 2). This type of approach allows CQAs to be become characterized and then monitored in a routine fashion. The combination of BioPharma Finder software and Chromeleon software serves as a powerful framework for MAM applications to enable deep protein characterization and further method streamlining for downstream process development.
0
0 100 0 100
80 60
NL: 2.98E5
100
Large scale relative abundance measurements of isoforms identified by BioPharma Finder software
Tras 1xA2G0F, 1xA2G0F 148220.56
60
100
NL: 2.52E5
25.808
Tras 2xA2G0F 148059.09
MONITORING CQA ISOFORMS IN CHROMELEON SOFTWARE
40
20 0
Trastuzumab biosimilar
Trastuzumab 1xA2G0F, 1xA2G1F 148219.80 Trastuzumab 2xA2G1F 148382.52
60
25.741
2xA2G0F
G0F/G1F Deamidation
Deamidation
Avg Mass Standard Dev (Da /ppm)
Confident detection of low-level charge variant CQAs on intact mAb
0 100
Herceptin
Flow rate = 0.3 mL / min
Example of Interfering Isoforms
12
Mean Average Mass (Da) *4 replicates
Herceptin
ReSpect Deconvolution and Sliding Window Mass / Merge Tolerances Needed for Method
11
0
†† ‡ †
Figure 3. High precision measurements show that an approximately 1 Da mass shift is reproducibly measured for abundant glycoforms at the main vs. acidic peaks, which is highly consistent with deamidation.
High tolerance (15 – 45 ppm)
∆M (Da / ppm)
0
‼
We injected 1 µL (20 µg) volumes of trastuzumab samples in formulation buffer and acquired native LC-MS data on a Q Exactive HF-X system. The results were analyzed using ReSpect and Sliding Window algorithms in BioPharma Finder software. We found a reproducible difference (4 replicates per sample) of ~1 Da between the abundant glycoforms corresponding to the acidic (deamidation) and main (relatively unmodified) LC peaks. Interestingly, we also observed a further ~1 Da difference between innovator Herceptin and a trastuzumab biosimilar, which we could not immediately explain.
Buffer A: 50 mM NH4Ac, pH = 6.8 Buffer B: 50 mM NH4Ac, pH = 10.1
Modification
6
+1
!
High precision of Orbitrap mass analyzer is demonstrated by reproducible results.
with BioPharma Option
Discovery data processing
+2
*
∆M (Da)
LOW TOLERANCE SLIDING WINDOW DECONVOLUTION (3 ppm) ALLOWS SUB-Da PRECISION FOR INTACT MASS MEASUREMENT
Q Exactive HF-X Orbitrap MS
Raw data acquisition
†!
time
Sample
Vanquish UHPLC
†
‡
†† 100
Isoform Modification
MODERATE TOLERANCE SLIDING WINDOW DECONVOLUTION (15 ppm) ALLOWS SENSITIVE AND CONFIDENT DETECTION OF LOW LEVEL CQA ISOFORMS
33.9367 33.6723 33.9367
2. Rogers RS, Nightlinger NS, Livingston B, Campbell P, Bailey R, Balland A. Development of a quantitative mass spectrometry multi-attribute method for characterization, quality control testing and disposition of biologics. MAbs. 2015;7(5):881-90. doi: 10.1080/19420862.2015.1069454.
TRADEMARKS/LICENSING © 2018 Thermo Fisher Scientific Inc. All rights reserved. Herceptin is a registered trademark of Genentech, Inc. All other trademarks are the property of Thermo Fisher Scientific and its subsidiaries. This information is not intended to encourage use of these products in any manner that might infringe the intellectual property rights of others.
40 PO65315-EN0518S