Available online at www.sciencedirect.com
Health Professions Education 3 (2017) 118–127 www.elsevier.com/locate/hpe
Assessing How Students Learn in Team-Based Learning: Validation of the Knowledge Re-Consolidation Inventory$ Hyun Seon Ahn⁎, Jerome I. Rotgans, Preman Rajalingam, Jian Jia Rebekah Lee, Ying Yun Juliana Koh, Naomi Low-Beer Lee Kong Chian School of Medicine, Nanyang Technological University, Novena Campus HQ, 11 Mandalay Road, Singapore 308232, Singapore Received 29 September 2017; received in revised form 10 October 2017; accepted 10 October 2017 Available online 17 October 2017
Abstract Purpose: The purpose of the present study was to establish the construct validity of a new instrument to measure psychological learning processes associated with Team-based learning (TBL), the Knowledge Re-Consolidation Inventory (KRCI). The instrument was designed to measure six factors: (1) self-guided preparation, (2) knowledge consolidation, (3) retrieval practice, (4) peer elaboration, (5) feedback, and (6) transfer of knowledge. Method: Two samples were taken, consisting in total of 197 first- and second-year medical students from Singapore. To establish the construct validity of the KRCI, two confirmatory factor analyses were conducted (CFA). First, an exploration sample (N¼90) was taken from the second-year medical students to conduct a preliminary CFA, and it resulted in elimination of items with poor psychometric properties. A confirmatory sample (N¼107) was then taken from the first-year medical students to conduct a second CFA to cross-validate the KRCI with reduced items. Results: From the original 38 items, 16 remained. The resulting model fitted the data well. The second CFA with the crossvalidation sample replicated the findings of the first analysis and supported the factorial structure of the hypothesised six-factor model. Tests of factorial invariance demonstrate that the factorial structure of the KRCI was stable across measurements. Discussion: The results of the study suggest that the KRCI is a valid and reliable instrument capable of measuring the six psychological mechanisms underlying TBL. & 2017 King Saud bin Abdulaziz University for Health Sciences. Production and Hosting by Elsevier B.V. This is an open access article under the CC BY-NC-ND license (http://creativecommons.org/licenses/by-nc-nd/4.0/). Keywords: Construct validity; Confirmatory factor analysis; Team based learning; Knowledge Re-Consolidation Inventory
1. Introduction Since the early 2000s, an increasing number of educational institutions worldwide have adopted Teambased learning (TBL) as their instructional strategy, 1–3 ⁎
Corresponding author. E-mail address:
[email protected] (H.S. Ahn). ☆ Peer review under responsibility of AMEEMR: the Association for Medical Education in the Eastern Mediterranean Region
including a growing number of medical and nursing schools.4 TBL typically consists of three distinct phases.5 The first phase is the preparation phase and it occurs before the actual TBL session. During this phase, students study the assigned learning resources to prepare themselves for the topic to be discussed during the TBL session. The second and third phases are conducted during the TBL session itself when students come together and work in small teams (5 to 7 students). The second phase is referred as the readiness assurance
http://dx.doi.org/10.1016/j.hpe.2017.10.001 2452-3011/& 2017 King Saud bin Abdulaziz University for Health Sciences. Production and Hosting by Elsevier B.V. This is an open access article under the CC BY-NC-ND license (http://creativecommons.org/licenses/by-nc-nd/4.0/).
H.S. Ahn et al. / Health Professions Education 3 (2017) 118–127
phase which allows students to test their knowledge and understanding; first individually by means of an iRAT (individual readiness assurance test, where students attempt the multiple-choice questions individually) and then within the team by means of the tRAT (team readiness assurance test, which is the same as the iRAT but it is discussed within the team). During the tRAT, teams receive immediate computer-based feedback on the correctness of the answers chosen, and the teams engage in a class discussion to clarify the most difficult questions and seek clarification from the teacher. The teacher also provides elaborative feedback to the students. The third phase is the application phase. During this phase, students are presented with case studies or vignettes that deal with real-world problems faced by professionals in the field. Students in their teams have to apply what they have learnt during the first two phases. Answers are then discussed in class and the teacher provides additional explanations and/or a summary of what was learnt. Studies suggest that this instructional approach is capable of expanding students’ conceptual and procedural knowledge,6–8 which contributes to better performance,2,4,9,10 better critical thinking and problemsolving skills,6–8,11,12 and at the same time, improves their interpersonal skills such as communication, teamwork, and leadership skills.8,12,13 Despite the growing popularity of TBL and the emerging evidence that it is an effective instructional approach, little is known about its inner workings. What are the psychological mechanisms that govern TBL and which particular mechanism is conducive for learning? These are questions that have not been empirically addressed. Schmidt and colleagues14 have recently proposed a theoretical framework describing the underlying psychological mechanisms of TBL. They suggest that there are six distinct psychological mechanisms, which coincide with the distinctive phases and features of TBL. These mechanisms are: (1) Guided self-preparation, which corresponds to the preparation for a TBL session (similar to the flipped classroom concept15). Preparation occurs prior to classroom time, where students are provided with pre-reading materials for initial self-directed acquisition of knowledge. The second mechanism is (2) Memory consolidation. Memory consolidation occurs after knowledge encoding, mainly during sleep, whereby the newly acquired memory is stabilised, enhanced, and integrated with pre-existing long-term knowledge networks.16–18 In TBL, students typically have at least 24 hours between preparation and the TBL session and it is assumed that a good night's sleep will allow for memory consolidation at the synaptic level. The third
119
mechanism is (3) Retrieval practice, which corresponds to the iRAT. Retrieval practice is the act of retrieving information from long-term memory,19 which occurs when students attempt the iRAT during TBL as they have to retrieve what they have learnt previously when they prepared for the session. Research has shown that having an opportunity to retrieve knowledge from memory enhances learning because it enhances the extent to which knowledge is embedded (and reembedded) in memory.19–21 The fourth mechanism is (4) Peer elaboration, which corresponds to the tRAT. Peer elaboration refers to “collaborative and co-operative” learning in which students’ engage in mutual teaching and learning within peer groups,22,23 discernibly improving learning and understanding.24 This occurs during tRAT when students in TBL discuss the answer options to the iRAT. The fifth is (5) Feedback, which corresponds to burning questions after tRAT (also referred to as “written team appeal”). Receiving feedback that is specific and timely has been shown to have a positive effect on learning because it helps to clarify misconceptions and stimulate deeper processing of information.25 It also encompasses positive reinforcement.26 The sixth mechanism is (6) Transfer of knowledge, which corresponds to the application exercises. Transfer is broadly referred to as applying one's knowledge to new, unfamiliar contexts.27,28 This is encouraged during TBL when students engage with the application exercises. During these exercises, students have to apply what they have learnt to new contexts and situations to solve novel problems. Although Schmidt et al.14 provide a first account of the psychological basis for TBL, it should be noted that their proposal is theoretical in nature; currently there is only limited empirical evidence available for the knowledge re-consolidation theory that stems directly from TBL research. What is needed at this point is an instrument that is capable of adequately measuring these six psychological mechanisms. This would not only enable testing the knowledge re-consolidation theory, but also provide deeper insights into the inner workings of TBL. Reviewing the TBL literature in search of suitable instruments, it becomes apparent that there are not many instruments available. We were only able to find two validated instruments in the Web of Science database. Vasan and his colleagues29 developed a 15item questionnaire to measure medical undergraduate students’ perceptions of TBL and teamwork. Eight of the items assess perceptions of TBL, (e.g., TBL helped me prepare for course examinations) and the other seven items assess perceptions of teamwork (e.g., I
120
H.S. Ahn et al. / Health Professions Education 3 (2017) 118–127
contributed meaningfully to the TBL discussions). This questionnaire was recently cross-validated with a different sample of medical students.30 In addition, Mennenga31 also developed a questionnaire for use in nursing education, known as the Team-Based Learning Student Assessment Instrument. This instrument was designed to measure students’ preference for TBL, their satisfaction with TBL, and accountability to prepare for and participate in TBL.31,32 This instrument consists of 33 items (e.g., I enjoy team-based learning activities; During traditional lectures, I often find myself thinking of nonrelated things; and Team-based learning makes me accountable). Examining the sub-scales and items of these instruments, it becomes apparent that they were designed, not to measure specific psychological processes underlying TBL, but rather to measure generic attitudes towards TBL, such as students’ satisfaction with TBL and how they feel accountable for learning in TBL. None of these questionnaires and their sub-scales measure relevant psychological mechanisms that we are interested in, such as retrieval practice or transfer of learning. Therefore, these questionnaires cannot be used as measures of the knowledge re-consolidation theory. To address this issue, the objective of the present study was to devise a new rating scale, the Knowledge Re-Consolidation Inventory (KRCI), and to validate it for use in TBL. We chose a top-down approach, which required generating items from the six psychological mechanisms proposed by the knowledge re-consolidation theory. Subsequent construct validity of the KRCI was established in two stages involving two cohorts of medical students. The first stage involved conducting a confirmatory factor analysis (CFA) with all items that had been generated for the KRCI (n¼ 38). The intent of this stage was to identify and exclude items with poor
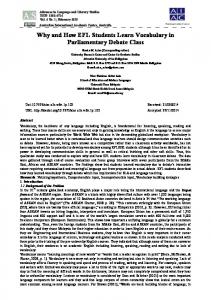
psychometric properties (Study 1). The objective of the second stage was to cross-validate the derived factor structure of the KRCI during phase 1 by means of a second CFA with a different sample (Study 2). For Study 1 and 2, the KRCI was administered during actual TBL sessions. More precisely, each subscale was administered after a distinctive TBL activity (e.g., retrieval practice after the iRAT, see Fig. 1 for details). The purpose of this was to adequately capture the psychological mechanisms as they happen. For Study 2, we also administered the KRCI retrospectively, at the end of the TBL session. This enabled us to explore if the factorial structure of the KRCI is invariate between these types of administrations, which adds to the validity of the instrument. 2. Study 1: exploration study In the present study, we applied a top-down approach to questionnaire construction.33–35 This entailed using the knowledge re-consolidation theory to generate items that are intended to measure each of the six factors. As the main objective of Study 1 was to find the best items and the best fitting measurement model for KRCI, substantially more items were generated for the scale in this study as it would allow for elimination of items with poor psychometric properties. 2.1. Method 2.1.1. Participants Ninety second-year medical students from the Lee Kong Chian School of Medicine in Singapore participated (57 male, 33 female). Ages ranged between 19 and 22 years, with an average age of 20 years (SD¼ .90). This particular medical school uses TBL as its main
Fig. 1. An overview of the TBL and KRCI administration processes for Study 1 and 2.
H.S. Ahn et al. / Health Professions Education 3 (2017) 118–127
pedagogical approach for the year 1 and year 2 medical students. On average, students had to attend two TBL sessions per week. All students were required to use a tablet or laptop during the TBL session. 2.1.2. Knowledge Re-Consolidation Inventory (KRCI) The KRCI was derived from the knowledge reconsolidation hypothesis and resulted in an initial pool of 38 items. There were six guided self-preparation items, six knowledge consolidation items, six retrieval practice items, seven peer elaboration items, seven feedback items, and six transfer of knowledge items. See Appendix A. Students responded to the survey items on a 5-point Likert scale ranging from 1 (strongly disagree) to 5 (strongly agree). 2.2. Procedure All participants were informed about the purpose of the study. Participation was voluntary and responses were anonymous. The survey was administered during a regular TBL class over the duration of one day. As shown in Fig. 1, participants were instructed to complete the sub-scales of the KRCI at critical points during the TBL class and not at the end, as it is typically done. The reasoning behind this approach was that we wanted to measure the psychological mechanisms as they unfold in the situation and not retrospectively. For instance, the retrieval practice subscale was administrated to students after they had completed the individual readiness assessment test (iRAT). By doing so, it was expected to increase accuracy for the measurement. All survey items were written in English and were administered online via Qualtrics. The institutional review board of Nanyang Technological University had approved the study. 2.3. Analysis A confirmatory factor analysis (CFA) was conducted to examine whether the data fitted the hypothesised factor structure, which consisted of six latent variables with its indicator variables. To determine the model fit, Tucker-Lewis index (TLI) and comparative fit index (CFI) values greater than .90, and a root mean square error of approximation (RMSEA) less than .06 were taken as indicators of adequate model fit.36 Values from the Akaike information criterion (AIC) and chi-square difference test were also used to compare the relative fit of the different models. These values are used especially in comparisons of factor structure between six-factor and single-factor solution. A lower AIC value indicates a
121
better trade-off between fit and complexity.37 The analysis was conducted using IBM SPSS AMOS 21.0. The reliability of the measure was determined by calculating Hancock's coefficient H.38 The coefficient H is a construct reliability measure for latent variable systems that represents a relevant alternative to the conventional Cronbach's alpha. According to Hancock and Mueller,38 the usefulness of Cronbach's alpha and related reliability measure is limited to assessing composite scales formed from a construct's indicators, rather than assessing the reliability of the latent construct itself as reflected by its indicators. The coefficient H is the squared correlation between a latent construct and the optimum linear composite formed by its indicators. Unlike other reliability measure, the coefficient H is never less than the best indicator's reliability. In other words, a factor inferred from multiple indicator variables should never be less reliable than the best single indicator alone. Hancock and Mueller38 recommended a cut-off value for the coefficient H of .70. In addition to conducting the CFA, we examined to which extent the six latent variables were correlated. The correlations provide important information because if the correlations are low, it indicates that there are six distinct factors with little conceptual overlap. A more advanced statistical test is to examine whether the sixfactor model results in a significantly better model fit as compared to a one-factor model in which all remaining items load on one single factor. If the six-factor solution results in a significantly better model fit, it is supportive evidence that the instrument and its items measure six distinct constructs. 2.4. Results and discussion An initial six-factor CFA model with all 38 items produced a poor model fit, χ2 (650, N¼ 90) ¼ 1154.47, p o .001 (CFI ¼ .68, TLI ¼ .65, RMSEA ¼ .09). Items with large modification index, non-significant factor loadings, or factor loadings of less than .70 were removed. After deleting the initial set of items, the CFA model with the remaining 16 items produced acceptable fit indices: χ2 (90, N ¼ 90) ¼ 129.22, p o .01 (CFI¼ .94, TLI ¼ .92, RMSEA ¼ .07). The 16-item model resulted in a significantly better fitting model as compared with the initial 38-item model: Δχ2 (560, N¼ 90) ¼ 1025.25, p o .001. See Appendix A for more details about the standardized factor loadings for the final set of items in the six-factor model. To test the reliability of the KRCI, we generated the coefficient H for each subscale. The coefficients H were
122
H.S. Ahn et al. / Health Professions Education 3 (2017) 118–127
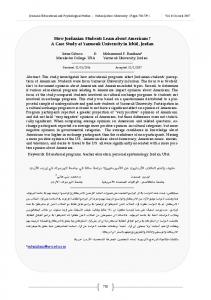
.81 for guided self-preparation, .90 for knowledge consolidation, .88 for retrieval practice, .81 for peer elaboration, .91 for feedback, and .72 for transfer of knowledge. Overall, these values suggest that the KRCI is a reliable instrument. Next, we explored the correlations between the six KRCI sub-scales. See Table 1 for details. Except for the guided self-preparation and knowledge consolidation, all psychological mechanisms of KRCI sub-scales had weak to moderate correlational relationships with each other (.28 r r r .76). The low to moderate correlation between six KRCI sub-scales indicate that six subscales are distinguishable and measure different constructs.
To further test whether there are six distinct factors, we compared the model fit between a six-factor and the single-factor model (see Table 2). Using the chi-square difference test, the single-factor model in which all 16 items loaded on one factor was compared to the initial six factors model. The results of the difference in chisquare test revealed that the six-factor solution resulted in a significantly better model fit than the one-factor model χ2 (14, N ¼ 90) ¼ 331.12, p o .001. This suggests that the six factors are distinguishable and measure different psychological mechanisms. Taken together, the results suggest that the 16-item KRCI is a valid and reliable instrument to measure the six psychological mechanisms as proposed by the knowledge re-consolidation theory.
Table 1 Descriptive statistics and correlation coefficients among latent variables for Study 1.
3. Study 2: confirmation study 1 2 3 4 5 6
Guided self-preparation Knowledge consolidation Retrieval practice Peer elaboration Feedback Transfer of knowledge M SD Hancock's coefficient H
1
2
– −.05 .08 .07 .11 .01 3.45 .64 .81
– −.10 −.19 .12 .09 2.86 .88 . 90
3
– .28 .21 .37 4.04 .54 .88
4
– .44 .76 4.13 .53 .81
5
– .51 3.79 .58 .91
6
– 3.92 .55 .72
Note. Correlation coefficients greater than .21 in absolute value are significant at the .05 level. Response scales ranged between 1 and 5 for the six psychological mechanisms of TBL.
In Study 1, we used an explorative approach to find the best factor structure for the measurement model of the KRCI. However, it is not sufficient to merely establish an adequate model fit, by means of a CFA, with the same data used for the exploration. Instead, one has to cross-validate the derived factor structure with an independent sample.39 This comes down to conducting a second CFA with a new set of data to examine if equally good model fit statistics can be generated. Conducting this confirmation study was the objective of Study 2.
Table 2 Model fit and model comparison for Study 1 and Study 2. Model
Description
χ2
df
CFI
TLI
RMSEA [90% CI]
AIC
Δχ2 (Δdf)
Study 1 (N¼ 90) 1 2
Six-factor modela Single factor model
129.221 460.336
90 104
.94 .50
.92 .36
.07 [.04, .10] .20 [.18, .22]
221.22 524.34
331.12(14)***
Study 2: Administration during TBL (N ¼ 107) 1 Six-factor model 2 Single factor model
164.358 511.563
89 104
.91 .52
.88 .44
.09 [.07, .11] .19 [.18, .21]
258.36 575.56
347.21(15)***
Study 2: Administration after TBL (N ¼107) 1 Six-factor model 2 Single factor model
142.120 350.496
89 104
.94 .73
.92 .69
.08 [.05, .09] .15 [.13, .17]
236.12 414.50
208.38(15)***
306.477 322.632
178 188
.93 .92
.90 .90
.06 [.05, .07] .06 [.05, .07]
– –
16.16(10)
Measurement invariance comparison Study 2: During TBL vs. After TBL Baseline 2-group model, no constraints Factor loadings constrained to be equal across occasions a
Error variance of the item indicator (e.g., “I prepare well for this session.”) was fixed to .10 for the six-factor model in Study 1. po .001
***
H.S. Ahn et al. / Health Professions Education 3 (2017) 118–127
123
3.1. Method
3.2. Procedure
3.1.1. Participants One hundred and seven first-year medical students participated (70 male, 36 female, 1 unknown). Age ranged between 18 and 21 years, with an average of 19 years (SD ¼ .94).
The same procedure as in Study 1 was applied to participants in Study 2 (see Fig. 1). The survey was administered at a regular TBL class via Qualtrics. However, different to the administration in Study1 was that we administered one additional KRCI at the end of the TBL session with the instruction to think back of their experiences during this session when responding to the questionnaire. This was done to explore if the factor structure of the KRCI is consistent during different administrations (i.e., during and after TBL). If it is invariate, it demonstrates that the KRCI is a valid instrument that can be administered both during or after TBL.
3.1.2. KRCI scale The 16-item KRCI scale, which was validated in Study 1, was used in this study. The final items for each sub-scale were as follows: (1) Self-guided preparation (2 items; “I prepare well for this session”, “I was thorough in my preparation for this session”); (2) Knowledge consolidation (3 items; “I was well-rested when I came to this session”, “I did not get enough sleep”, “I feel tired going into this session”); (3) Retrieval practice (2 items; “I had regular opportunities to test my knowledge during this session”, “I was quizzed regularly during this session”); (4) Peer elaboration (3 items; “I regularly engaged in discussions with my peers during this session”, “I had opportunities to discuss difficult concepts with other students”, “I could ask other students questions about the topics we learnt”); (5) Feedback (4 items; “The teacher provided feedback that was useful for my understanding”, “The teacher reinforced important concepts”, “Feedback from the teacher helped me learn”, “The teacher clarified misconceptions”); and (6) Transfer of knowledge (2 items; “My knowledge was often stretched to solve novel problems”, “I used my acquired knowledge to solve complex problems”). Students responded to the survey items on a 5-point Likert scale ranging from 1 (strongly disagree) to 5 (strongly agree).
3.3. Analyses We first conducted a CFA with IBM SPSS AMOS 21.0 to cross-validate the KRCI with a different sample. Hancock's coefficient H was also generated to test the reliably of the sub-scales. In addition, multi-group confirmatory factor analysis was conducted to test the measurement invariance of the KRCI scale across the two different times of scale administration (i.e., during and after TBL). The invariance test was conducted by comparing the difference in chi-square value between an unconstrained and constrained model in relation to the difference in degrees of freedom. Models are constrained by equating the factor loadings between the KRCI during TBL and KRCI after TBL. If the chisquare test is not significant, it suggests that the factorial structure between both measurements is invariate.39
Table 3 Descriptive statistics and correlation coefficients among latent variables for Study 2.
1 2 3 4 5 6
Guided self-preparation Knowledge consolidation Retrieval practice Peer elaboration Feedback Transfer of knowledge M SD Hancock's coefficient H
1
2
3
4
5
6
M
SD
Hancock's coefficient H
– .38 .55 .47 .45 .59 3.60 .91 .85
.32 – .42 .25 .33 .49 3.01 .97 .83
.35 .15 – .77 .86 .93 4.17 .56 .88
.30 .19 .40 – .77 .78 4.40 .54 .86
.10 .27 .44 .56 – .83 4.15 .60 .89
.46 .13 .53 .60 .63 – 4.17 .61 .64
3.46 2.83 4.29 4.44 4.21 4.32
.87 .99 .60 .62 .56 .56
.80 .82 .83 .91 .91 .80
Note. Correlation coefficients for after TBL administration are presented below the diagonal; those for during TBL administration are presented above the diagonal. Means, standard deviations, and Hancock's coefficients H for after TBL administration are presented in the horizontal rows; those for during TBL administration are presented in the vertical columns. Correlation coefficients for both TBL administrations greater than .24 in absolute value are significant at the .05 level. Response scales ranged between 1 and 5 for the six psychological mechanisms of TBL.
124
H.S. Ahn et al. / Health Professions Education 3 (2017) 118–127
3.4. Results and discussion In order to cross-validate the KRCI, we conducted a second CFA with the new data set (see Table 2). Consistent with findings of Study 1, the CFA produced acceptable fit indices: χ2 (89, N¼ 107) ¼ 164.36, p o .01 (CFI ¼ .91, TLI ¼ .88, RMSEA ¼ .09) and χ2 (89, N ¼ 107) ¼ 142.12, p o.01 (CFI ¼ .94, TLI ¼ .92, RMSEA ¼ .08). Also, the reliability was within acceptable levels (average coefficient H ¼ .83), see Table 3 for details. The correlations between the six sub-scales of the KRCI were weak to moderate (.27 r r r .63 and .25r r r.93, see Table 3 for details). Analogous to Study 1, we conducted a chi-square difference test to examine if a six-factor model resulted in a significantly better model fit than a one-factor model that had all items loaded on one factor. The results confirmed that a six-factor model showed better fit indices than a singlefactor model, Δχ2 (15, N ¼ 107) ¼ 347.21, po .01. See Table 2 for details. Similar to our findings in Study 1, this outcome suggests that the six factors are distinguishable and measure different psychological mechanisms. As a next step in our analysis, we tested whether the factorial structure of the KRCI administered during and after TBL was invariate. See Tables 2 and 3 for details. The outcome of the factorial invariance test revealed that this was the case, the chi-square test was not significant: Δχ2 (10, N¼ 107) ¼ 16.16, p¼ .10. This outcome suggests that the factorial structure of the KRCI did not significantly differ between the administration during and after TBL. Thus, the KRCI can reliably be used during a TBL session or after, when students respond to it retrospectively.
4. General discussion The objective of the present study was to develop and validate a questionnaire, the Knowledge ReConsolidation Inventory (KRCI), which is capable of measuring six psychological mechanisms of TBL that were proposed by the knowledge re-consolidation theory put forward by Schmidt and colleagues.14 The six mechanisms are: (1) Guided self-preparation (TBL preparation); (2) Memory consolidation (rest period between preparation and TBL); (3) Retrieval practice (iRAT); (4) Peer elaboration (tRAT); (5) Feedback (burning questions/appeal); and (6) Transfer of learning (application exercises).
For each proposed mechanism, a corresponding subscale was devised with items. Two studies were conducted. The first constituted a CFA and had the purpose of trimming items that had poorer psychometric characteristics. The aim was to retain a questionnaire with the least possible number of items, yet yielding high validity and reliability. This resulted in an item-reduction from 38 to 16 items. In Study 2, the questionnaire consisting of 16 items, was then cross-validated by means of a CFA with an independent sample. In both studies, the data fitted the model well. The outcomes of the CFAs, together with relatively high reliability values for each subscale, suggest that the KRCI is a valid and reliable instrument to measure the six psychological mechanisms underpinning TBL. As mentioned before, we administered the subscales of the KRCI during critical moments of a TBL session. For instance, retrieval practice after the iRAT. This was done with the intent to better capture the psychological mechanism that was expected to unfold at that point in time and to explore if each sub-scale can be used independently. However, if the KRCI is to be used routinely in TBL, it can be impractical administering sub-scales of the questionnaire throughout a session. It is often preferred to administer a questionnaire only once, say at the end of a TBL. To explore if a single administration yielded similar results, we administered the KRCI in its entirety at the end of the TBL session of Study 2. It was then compared, by means of a factorial invariance test, whether the KRCI administered during and after the TBL session was identical in factorial structure. The results of the test revealed that this was indeed the case; the factorial structure between the two KRCI administrations was identical. In fact, an additional factorial invariance test was carried out to compare the factorial structure between Study 1 and Study 2. Results suggest that the factorial structure was invariate across these measurements as well: Δχ2 (10) ¼ 12.24, p ¼ .27. The fact that the factorial structure of the KRCI was invariate across the data sets is testimony to the robustness and versatility of the KRCI. The study has also limitations that need to be highlighted. First, the samples used for the analyses were rather small. Typically, CFAs should be conducted with larger samples.39 However, our access to participants was restricted since there are a relatively small number of students who are admitted to medical school each year. This is different in other disciplines, where typically larger numbers of students enrol.
H.S. Ahn et al. / Health Professions Education 3 (2017) 118–127
Related to this, our findings are limited to TBL in the medical context. Further research is needed to explore whether the KRCI is equally valid for TBL in other domains, such as engineering or business administration. Lastly, the present study constituted an internal validation procedure, exploring model-fit statistics and factorial structures. Although this is an essential and necessary step in every line of survey research, only the future studies that use the KRCI will provide more informative insights in the inner workings of TBL. As a next step, it is important to explore how the sub-scales of the KRCI are related to external measures and other constructs. Only then, it can be explored how the
125
underlying psychological mechanisms of TBL influence each other and predict outcomes.
Disclosure Ethical approval IRB Nanyang Technological University, Singapore.
Other disclosure N/A.
Appendix A. Items and factor loadings of the knowledge Re-Consolidation Inventory (KRCI) Standardized Factor Loading Self-guided preparation 1 I prepare well for this session.* 2 I could have done more to prepare myself for this session. 3 The preparation materials provided were relevant for this session. 4 I did not have adequate time to prepare for this session. 5 I was thorough in my preparation for this session.* 6 I studied for this session. Knowledge consolidation 1 I was well-rested when I came to this session.* 2 I did not get enough sleep.* 3 I feel drowsy or sleepy during the day. 4 My concentration in the day suffers because of sleepiness. 5 I feel tired going into this session.* 6 I feel energetic going into this session. Retrieval practice 1 I had regular opportunities to test my knowledge during this session.* 2 I was quizzed regularly during this session.* 3 My knowledge was not regularly tested during this session. 4 I was tested appropriately on content covered in the preparation materials. 5 The questions were inappropriate for the preparation materials I was given. 6 I was able to remember the important concepts that was presented earlier. Peer elaboration 1 I had regular opportunities to elaborate with my peers during this session. 2 I regularly engaged in discussions with my peers during this session.* 3 I explained my understanding of concepts to other students.
.88 – – – .67 –
/ / / / / /
.74/ .82 –/– –/– –/– .86/ .89 –/–
.89 –.90 – – –.66 –
/ / / / / /
.72/ .75 –.82/ –.60 –/– –/– –.76/ –.87 –/–
.83 .89 – – – –
/ / / / / /
.76/ .93 .89/ .70 –/– –/– –/– –/–
– .61
/ –/– / .71/ .75 / –/–
126
H.S. Ahn et al. / Health Professions Education 3 (2017) 118–127
4 Other students explained their ideas to me. 5 I had opportunities to discuss difficult concepts with other students.* 6 I could ask other students questions about the topics we learnt.* 7 There was a high level of engagement in my group discussions. Feedback 1 I received feedback from the teacher to clarify my understanding during this session. 2 During this session, I did not receive feedback from the teacher that helped me clarify my understanding. 3 The teacher provided feedback that was useful for my understanding.* 4 The teacher reinforced important concepts.* 5 Feedback from the teacher helped me learn.* 6 I think feedback from the teacher about my learning is important. 7 The teacher clarified misconceptions.* Transfer of knowledge 1 I had many opportunities to apply what I had learnt to different contexts. 2 My knowledge was often stretched to solve novel problems.* 3 I did not have many opportunities to apply my knowledge to novel problems during this session. 4 I used my acquired knowledge to solve complex problems.* 5 The problems were not relevant to the knowledge I had acquired. 6 I appreciate the applicability of the knowledge I have learnt.
Note. Standardized factor loadings from the CFA in Study 1 are presented first, followed by standardized factor loadings from during and after TBL administration CFA of Study 2. For clarify of presentation, the CFA of the 16 final items of KRCI were performed. Items marked with an asterisk (*) indicate the final set of items.
8.
9.
10.
References 1. Burgess AW, McGregor DM, Mellis CM. Applying established guidelines to team-based learning programs in medical schools: a systematic review. Acad Med 2014;89(4):678–688. 2. Koles PG, Stolfi A, Borges NJ, Nelson S, Parmelee DX. The impact of team-based learning on medical students' academic performance. Acad Med 2010;85(11):1739–1745. 3. Michaelsen LK. Getting started with team learning. In: Michaelson LK, Knight AB, Fink LD, editors. Team-Based Learning: A Transformative Use of Small Groups. Portsmouth, NH: Greenwood Publishing Group; 2002. p. 3–26. 4. Conway SE, Johnson JL, Ripley TL. Integration of team-based learning strategies into a cardiovascular module. Am J Pharm Educ 2010;74(2):35. 5. Haidet P, Levine RE, Parmelee, DX, et al. Perspective: guidelines for reporting team-based learning activities in the medical and health sciences education literature. Acad Med 2012;87(3):292–299. 6. McInerney MJ, Fink LD. Team-based learning enhances longterm retention and critical thinking in an undergraduate microbial physiology course. Microbiol Educ 2003;4:3–12. 7. Kim HR, Song Y, Lindquist R, Kang HY. Effects of team-based learning on problem-solving, knowledge and clinical perfor-
11. 12.
13.
14.
15.
16.
17.
18.
–/– .94/ .88 .80/ .75 –/–
.85 .74
/ / / /
–
/ –/–
–
/ –/–
.82 .84 .90 – .78
/ / / / /
– .61 –
/ –/– / .68/ .72 / –/–
.82 – –
/ .87/ .65 / –/– / –/–
.84/ .84 .78/ .72 .91/ .79 –/– .68/ .85
mance of Korean nursing students. Nurse Educ Today 2016;38: 115–118. Currey J, Eustace P, Oldland E, Glanville D, Story I. Developing professional attributes in critical care nurses using Team-Based Learning. Nurse Educ Pract 2015;15(3):232–238. Behling KC, Kim R, Gentile M, Lopez O. Does team-based learning improve performance in an infectious diseases course in a preclinical curriculum?. Int J Med Educ 2017;8:39–44. Zgheib NK, Simaan JA, Sabra R. Using team-based learning to teach pharmacology to second yearmedical students improves student performance. Med Teach 2010;32(2):130–135. Michaelsen LK, Sweet M. The essential elements of team-based learning. New Dir Teach learn 2008;2008(116):7–27. Levine RE, O’Boyle M, Haidet, P, et al. Transforming a clinical clerkship with team learning. Teach Learn Med 2004;16(3): 270–275. Park HR, Kim CJ, Park JW, Park E. Effects of team-based learning on perceived teamwork and academic performance in a health assessment subject. Collegian 2015;22(3):299–305. Schmidt HG, Rotgans JI, Rajalingam P, Low-Beer N. A psychological foundation for team-based learning: Knowldge reconsolidation. Under Review; 2017. Balan P, Clark M, Restall G. Preparing students for flipped or team-based learning methods. Educ þ Train 2015;57(6): 639–657. Marshall L, Born J. The contribution of sleep to hippocampusdependent memory consolidation. Trends Cogn Sci 2007;11(10): 442–450. Diekelmann S, Wilhelm I, Born J. The whats and whens of sleepdependent memory consolidation. Sleep Med Rev 2009;13(5): 309–321. Stickgold R, Walker MP. Sleep-dependent memory consolidation and reconsolidation. Sleep Med 2007;8(4):331–343.
H.S. Ahn et al. / Health Professions Education 3 (2017) 118–127 19. Roediger HL, Butler AC. The critical role of retrieval practice in long-term retention. Trends Cogn Sci 2011;15(1):20–27. 20. Roediger HL, Karpicke JD. Test-enhanced learning: taking memory tests improves long-term retention. Psychol Sci 2006;17(3):249–255. 21. Dobson JL. Retrieval practice is an efficient method of enhancing the retention of anatomy and physiology information. Adv Physiol Educ 2013;37(2):184–191. 22. Secomb J. A systematic review of peer teaching and learning in clinical education. J Clin Nurs 2008;17(6):703–716. 23. Smith MK, Wood WB, Krauter K, Knight JK. Combining peer discussion with instructor explanation increases student learning from in-class concept questions. CBE Life Sci Educ 2011;10(1): 55–63. 24. Smith MK, Wood WB, Adams, WK, et al. Why peer discussion improves student performance on in-class concept questions. Science. 2009;323(5910):122–124. 25. Harden RM, Laidlaw JM. Be FAIR to students: four principles that lead to more effective learning. Med Teach 2013;35(1): 27–31. 26. Haidet P, Levine RE, Parmelee, DX, et al. Perspective: guidelines for reporting Team-Based Learning activities in the medical and health sciences education literature. Acad Med 2012;87(3):292–299. 27. Lauder W, Reynolds W, Angus N. Transfer of knowledge and skills: some implications for nursing and nurse education. Nurse Educ Today 1999;19(6):480–487. 28. Carpenter SK. Testing enhances the transfer of learning. Curr Dir Psychol Sci 2012;21(5):279–283. 29. Vasan NS, DeFouw DO, Compton S. A survey of student perceptions of team-based learning in anatomy curriculum: favorable views unrelated to grades. Anat Sci Educ 2009;2(4): 150–155. 30. Lein Jr DH, Lowman JD, Eidson CA, Yuen HK. Cross-validation of the Student Perceptions of Team-Based Learning Scale in the United States. J Educ Eval Health Prof 2017;14(15):1–6. 31. Mennenga HA. Development and psychometric testing of the team-based learning student assessment instrument. Nurse Educ 2012;37(4):168–172. 32. Nation LM, Tweddell S, Rutter P. The applicability of a validated team-based learning student assessment instrument to assess United Kingdom pharmacy students' attitude toward team-based learning. J Educ Eval Health Prof 2016;13(30):5. 33. Biggs J. What do inventories of students' learning process really measure? A theoretical review and clarification. Br J Educ Psychol 1993;63(1):3–19. 34. Dyne A, Taylor P, Boulton-Lewis G. Information processing and the learning context: an analysis from recent perspectives in cognitive psychology. Br J Educ Psychol 1994;64(3):359–372.
127
35. Entwistle NJ, Waterston S. Approaches to studying and levels of processing in university students. Br J Educ Psychol 1988;58(3): 258–265. 36. Kline RB. Principles and Practice of Structural Equation Modeling, 2nd ed., New York, NY: Guilford Press; 2005. 37. Kline RB. Principles and Practice of Structural Equation Modeling, 3rd ed., New York, NY: Guilford Press; 2011. 38. Hancock GR, Mueller RO. Rethinking construct reliability within latent systems. In: Cudeck R, Du Toit S, Sorbum D, Joreskog KG, editors. Structural Equation Modeling: Present and Future A Festschrift in Honor of Karl Jöreskog. Lincolnwood, IL: Scientific Software International; 2001. p. 195–216. 39. Byrne BM. Structural Equation Modeling with Amos: Basic Concepts, Applications and Programming. Mahwah, NJ: Lawrence Erlbaum Assoc Inc; 2001.
Hyun Seon Ahn is a Postdoctoral Research Fellow at Lee Kong Chian School of Medicine, Nanyang Technological University, Singapore.
Jerome I. Rotgans is an Assistant Professor of Medical Education Research at Lee Kong Chian School of Medicine, Nanyang Technological University, Singapore.
Preman Rajalingam is a Deputy Director, Head of Educational Department and TBL Facilitation at Lee Kong Chian School of Medicine, Nanyang Technological University, Singapore.
Jian Jia Rebekah Lee is an undergraduate medical student at Lee Kong Chian School of Medicine, Nanyang Technological University, Singapore.
Ying Yun Juliana Koh is a Research Assistant at Lee Kong Chian School of Medicine, Nanyang Technological University, Singapore.
Naomi Low-Beer is Professor and Vice-Dean (Education) at Lee Kong Chian School of Medicine, Nanyang Technological University, Singapore.


![Read [PDF] How Students Really Learn: Instructional ... - Google Sites](https://m.moam.info/img/260x300/read-pdf-how-students-really-learn-instructional-g_647880ba097c474e708ce245.jpg)
