dependable officers. Responsiveness is willingness to respond to the wishes or needs of the customers' support and fast services. It includes the rapid airport ...
MATEC Web of Conferences 68, 06003 (2016)
DOI: 10.1051/ matecconf/20166806003
ICIEA 2016
Assessing Service Quality: A Combination of SERVPERF and ImportancePerformance Analysis Dyah R. Rasyida, M. Mujiya Ulkhaq, Priska R. Setiowati and Nadia A. Setyorini Department of Industrial Engineering, Diponegoro University, Semarang 50275, Indonesia
Abstract. Service providers in this highly competitive market are demanded to find ways to attract new customers, retain existing customers, and pursue customers’ loyalty. The quality of the service which has to deliver to the customers has been considered as a critical factor for the success of the service providers by a reason of its close connection to customer satisfaction. This paper aimed to assess the service quality of the service firms and identify what dimensions they have to prioritize to attain the customer satisfaction. SERVPERF model was employed to achieve the first objective while importance-performance analysis was utilized for the second objective. A case study was conducted in Ahmad Yani International Airport, Indonesia, to demonstrate the applicability of the method.
1 Introduction Service quality currently has been considered as a strategic tools for positioning and means of attaining operational efficiency, improving business performance [1], as well as a key factor for the success of service providers. The improvement of service quality will result in the satisfaction improvement of service customers [2]– [4]. Furthermore, tremendous service precedes customers’ retention and leads to repeat customers purchase behaviour [5] which can increase the service provider’s market share and generate high incomes [6]. Although assessing service quality is challenging due to service’s unique characteristics, such as intangible, heterogeneous, inseparable, and perishable, there are numerous researchers in the field of service quality and the number is still growing. Among them, perhaps SERVQUAL by [7] and SERVPERF model by [8] are the most popular ones. In SERVQUAL model, service quality is linked to the concepts of disconfirmation or gap between customers’ perceptions and expectations. Even though it is intuitively appealing and conceptually sensible, the ability of these scores to provide additional information beyond that already contained in the perception component is under doubt. While the perception is definable and measurable in a straightforward manner as the customers’ belief about service is experienced, expectation is subject to multiple interpretations and as such has been operationalized differently by different researchers [9]– [11]. It is argued that the conceptual basis of the SERVQUAL scale is confusing with the service satisfaction and suggested to leave the perception alone [8]; hence the SERVPERF model plays its role.
This research attempted to combine the SERVPERF model with importance-performance analysis (IPA) technique by [12]. IPA technique can be used to prioritize the service attributes based on the importance and the performance, which are the results of SERVPERF model. To exhibit the applicability of the method proposed, a case study was conducted in Ahmad Yani International Airport (AYIA) which is located in Semarang, Indonesia. Even if there are several areas of service that this method can be applied, however, investigation into airport service have remained rather limited. Perhaps this is due to conventionally perceived notion that airports are natural monopolies, and have often been seen as a take-it-or leave-it proposition [13]. The absence of competition among airports makes the quality of the services become less noticed. Customers often do not have a choice among airports, regardless of the price and the quality levels of the service. Even if one found the parking arrangements poor, the terminal facilities somewhat puzzling, the restaurants and retail outlets high-priced, or the ground transportation facilities congested, the customers are forced to accept the situation offered by airport authorities [14]; or at least this somewhat happened in the developed countries. The objectives of this research are twofold. The first is to show how to assess the service quality using the SERVPERF model. It may provide some insights on how patrons rate the service quality; hence enabling the managers to position their service quality in accordance to their competitors and to discover dimensions of service that they need to improve. The second is to identify the service firms’ selection attributes perceived as important to offer strategic implications that should be pursued to boost their competitiveness and attract more customers.
© The Authors, published by EDP Sciences. This is an open access article distributed under the terms of the Creative Commons Attribution License 4.0 (http://creativecommons.org/licenses/by/4.0/).
MATEC Web of Conferences 68, 06003 (2016)
DOI: 10.1051/ matecconf/20166806003
ICIEA 2016 management. Attributes that were rated low in both importance and performance were put in the third quadrant: low priority, which is located in the south-west corner. The last is possibly overkill, where there were unnecessary attributes that need to be maintained by the management due to having low importance but high performance rating.
2 Research method SERVPERF model consists of five service dimensions: tangibles, reliability, responsiveness, assurance, and empathy, with two sets of 22 item statements for the importance and perception sections of the questionnaire. Tangibles is about physically visible aspects. It could be viewed from the cleanliness of washroom, car parking facilities, waiting lounge comfort, and the appearance of the employees. Reliability is the ability to provide reliable service immediately and accurately. It relates to the adequacy of flight information, such as information display regarding baggage location and the availability of dependable officers. Responsiveness is willingness to respond to the wishes or needs of the customers’ support and fast services. It includes the rapid airport access, as well as effective and efficient security clearance. Assurance includes the knowledge, courtesy, skills, and trust-worthiness of the employees, as well as free from danger, risk, or doubt. The last dimension, empathy, means the ease of relationships, good communication, personal attention, and understand the need of customers. It can be observed from the availability of waiting time for check-in and immigration inspection and reclaim service for every single customer. The item statements to assess the performance of the service quality can be seen in Table 1. Service quality is measured by multiplying the weights with the perception scores:
Table 1. Dimensions and item statements of SERVPERF Dimensions
Tangible (4 items)
Reliability (5 items)
k
SQi � � Wij � Pij ,
(1)
Responsiven ess (4 items)
j �1
where SQj is the service quality of item statement j, Wij is the weighting factor of item statement j to an individual i, and Pij is perception of individual i with respect to the performance on item statement j. The weighting factors is the normalized importance score: Wij �
I ij � Min Max � Min
,
Assurance (4 items)
(2)
where Iij is the importance score obtained from the questionnaire, Min is the minimum score and Max is the maximum score of the importance score. The 22 item statements then were used to analyse the differences between the importance and performance in AYIA selection attributes: the IPA technique [12]. It is the two-dimensional state space where the vertical axis described the importance of the selection attributes, while the horizontal axis described how well the service firm is performing the service. The IPA’s two-dimensional state space were categorized into four quadrants: concentrate here, keep up with the good work, low priority, and possible overkill. The first quadrant, i.e. concentrate here, which is located in the north-west corner, had the attributes that become the priority of the management due to having high importance but indicates low performance ratings. The second quadrant: keep up with the good work, identified that both importance and performance of the customers already high rated and should be maintained well by the
Empathy (5 items)
Item Statements Q1: Service firm has up-to-date equipment Q2: The physical facilities are visually appealing Q3: The employees are well dressed and appear neat Q4: The appearance of the physical facilities is in keeping with the type of services provided Q5: When the employees promise to do something by a certain time, it does so Q6: The employees are sympathetic and reassuring when customers have problems Q7: The employees are dependable Q8: The employees provide their services at the time they promise to do so Q9: The employees keep their records accurately Q10: The employees are expected to tell customers exactly when services will be performed Q11: It is realistic for customers to expect prompt service from the employees Q12: The employees are expected to always help the customers Q13: It is a problem if the employees are too busy to respond to customers’ requests promptly Q14: The customers can trust the employees Q15: The customers are able to feel safe in their transactions with the employees Q16: The employees are polite Q17: The employees should get adequate support from the service firm’s management to do their jobs well Q18: The employees are expected to give customers individual attention Q19: The employees are expected to give customers personal attention Q20: It is expected that the employees know what the needs of their customers are Q21: It is expected that the employees have their customers’ best interests at heart Q22: The employees are expected to have operating hours convenient to all their customers
3 Case Study The first aim of this research is to investigate the performance of the service quality using the SERVPERF model. A case study was conducted in AYIA which is located in Semarang, Indonesia. The airport was opened for commercial flights on 31 August 1966 and gained its
2
MATEC Web of Conferences 68, 06003 (2016)
DOI: 10.1051/ matecconf/20166806003
ICIEA 2016 must improve its performance using the information shown in the SERVPERF analysis.
international status in August 2004 with its inaugural flight from Semarang to Singapore. A hundred participants were randomly selected from various sources to guarantee a diversity of opinions on the service quality of the airport. The participants include students, lecturers, business people, housewives, employees, and civil servants, indicates plenty diversity for the purpose of the research. In addition, participants were required to be over 18 years of age and have been experienced in getting benefit and perceiving the service from AYIA within the previous six months. Potential participants were first approached and asked if they wished to participate in the survey. All item statements were measured on a 7-point Likert-type scale, ranging from 1 which is indicated strongly disagree to 7 for strongly agree. The reliability test was conducted to check whether or not the respondents’ scores on any item statement tends to be related to their scores on the others. The Cronbach’s alpha for each dimension are computed using PASW Statistics 17.0; the results are shown in Table 2. Note that all of the dimensions have the value of Cronbach’s alpha [15] more than 0.6, indicated that the questionnaire being utilized is reliable [16]. The average values are then computed for each item statement throughout all respondents. The results are shown in Table 3, respect to each item statement and each section: importance and perception. The weighting factors are calculated using Equation (2) and the performance of service quality is computed using Equation (1). The attributes with the highest score of importance for each dimension are: Q1 of tangibles, Q5 of reliability, Q12 of responsiveness, Q16 of assurance, and Q20 of empathy; whereas reliability has the largest average score, i.e. 6.616. It seems that customers expected more on the reliable and accurate service. On the other hand, the attributes with the lowest score of importance for each dimension are: Q2 of tangibles, Q8 of reliability, Q10 of responsiveness, Q14 of assurance, and Q19 of empathy; while empathy has the lowest average score, i.e. 4.470. The customers did not seek so much for personal attention and good communication from the employees. It is evidenced that the Q18, i.e. the employee should not be expected to give customers individual attention, has the lowest score of importance. In the perception section, assurance has the highest average score which is 4.492. The attributes with the highest score are: Q3, Q9, Q11, Q16, and Q20 of tangibles, reliability, responsiveness, assurance, and empathy respectively. It looks the airport has the knowledgeable, skilled, and trustworthy employees as being the best among the other dimension. Q16 is considered as the highest score which implies that the airport has polite employees. Contrarily, the dimension which has the lowest average score is tangibles, i.e. 3.924. The attributes with the lowest score for each dimension are: Q2 of tangibles, Q6 of reliable, Q12 for responsiveness, Q17 of assurance, and 22 of empathy. The attribute which is considered as the worst performance of the airport is the appearance of the physical facilities, Q2, i.e. airport’s physical facilities should be visually appealing. It is a signal that the airport
Table 2. Cronbach’s alpha for each dimension of SERVPERF Dimensions Tangible Reliability Responsiveness Assurance Empathy
Cronbach’s Alpha 0.886 0.853 0.638 0.794 0.649
Table 3. Questionnaire result Dimensions Q1 Q2 Tangible Q3 Q4 Q5 Q6 Reliability Q7 Q8 Q9 Q10 Q11 Responsiveness Q12 Q13 Q14 Q15 Assurance Q16 Q17 Q18 Q19 Empathy Q20 Q21 Q22 Average
Ij 6.505 6.091 6.354 6.162 6.758 6.586 6.606 6.546 6.586 5.000 5.687 6.010 5.374 4.808 5.748 6.700 6.141 3.869 3.828 5.293 4.616 4.748 5.727
Wj 0.876 0.773 0.785 0.721 0.939 0.862 0.869 0.848 0.862 0.667 0.737 0.835 0.729 0.635 0.791 0.899 0.857 0.478 0.471 0.659 0.603 0.549 0.748
Pj 3.707 3.505 4.444 4.040 4.303 4.263 4.535 4.566 4.687 3.700 3.889 3.424 3.748 4.343 4.626 4.707 4.293 3.950 4.010 4.505 3.929 3.545 4.124
SQj 3.247 2.709 3.489 2.913 4.041 3.675 3.941 3.872 4.040 2.468 2.866 2.859 2.732 2.758 3.659 4.232 3.679 1.888 1.889 2.969 2.369 1.946 3.088
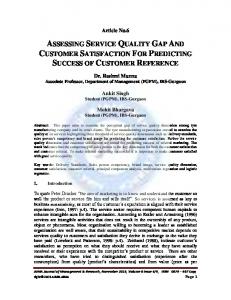
The average score of 3.088 indicated that the AYIA is slightly lack of capability for providing the “best” service for the customers and must do something in order to achieve customer satisfaction. The IPA technique can be employed to build strategies to attain it based on the importance and the performance from the customers’ point of view. The average score for each item statement were then plotted in the two-dimensional state space. The horizontal axis refers to the perception or how well the airport is performing its activity, i.e. providing the service to the customers; while the vertical axis refers to the importance of the activity. The IPA of service quality of AYIA is depicted in Figure 1. The item statements belong to the first quadrant are the ones with low performance but importantly perceived by the customers. Therefore, the attributes should receive the most investment to boost the customers’ satisfaction. It is suspected to bring the maximum effect with the minimum investment. The item statements belong to this quadrant are Q1, Q2, and Q4, all belong to the tangibles dimension. It is recommended to the management to improve the physical appearance with the latest equipment and remove the distraction that could interfere the customers’ attention toward the physical facilities.
3
MATEC Web of Conferences 68, 06003 (2016)
DOI: 10.1051/ matecconf/20166806003
ICIEA 2016 customers; the customers are feel safe in their transaction in the airport. All item statements belong to reliability dimension are in this quadrant, designated that the airport can provide reliable service immediately and accurately. In summary, the management must maintain these aspects to keep and maintain the customers.
Several item statements are embraced in the second quadrant: Q3, Q5, Q6, Q7, Q8, Q9, Q12, Q15, Q16, and Q17, means that the attributes are considered important and customers are fond with the performance of the management. It indicates that: the employees of AYIA have well-dressed and appear neat and are willing to help
Figure 1. Importance-performance analysis of service quality of AYIA.
conceptualization and operationalization, they proposed a measurement scale called SERVQUAL. It establishes an important milestone in the service quality literature and has been extensively applied in several service settings. However, SERVQUAL has been criticized on both theoretical and operational grounds. Some major issues regards with the use of disconfirmation model or the gap scores, length of the questionnaire, predictive power of the instrument, and the validity of the five-dimensions structures [8]–[11], [17], [18]. Cronin and Taylor were among the researchers who levelled maximum strike on the SERVQUAL scale. They though that expectation can be discarded and the performance can be used alone. They proposed what is referred to as the SERVPERF scale and provided an empirical evidence across four industries: banks, pest control, dry cleaning, and fast food to corroborate the superiority of their performance-only instrument over disconfirmation-based SERVQUAL scale. The SERVPERF can be considered suppress over the SERVQUAL scale. When it is applied in conjunction with the SERVQUAL scale, the SERVPERF has outperformed the SERVQUAL scale [8], [11], [18], [19]. It is also able to explain greater variance in the overall service quality measured through the use of single-item scale [20]. Although the application is still lagging behind the SERVQUAL, researchers have increasingly started utili-zing the performance-only measure of service quality. Due to the superiority of the SERVPERF scale to the SERVQUAL, this research applied the SERVPERF scale to assess the service quality and then combined it with the
The low priority quadrant identifies that the attributes belongs here are performing adequately but customers perceive them as less important when compared with other airport attributes. This quadrant consists of the attributes from responsiveness and empathy dimensions: Q11, Q13, Q18, Q19, Q20, and Q21. Although the result showed that both responsiveness and empathy dimensions did not perceived importantly, this does not mean that the management should reduce their efforts to improve the service. The management could give a reward to the employees who are able to maintain their responsiveness and empathy skills to the customers. If the customers are satisfied with the quality of the attributes, such satisfaction will lead them to spread favourable word-of-mouth publicity. The attributes in the possible overkill quadrant are considered less important by the customers and felt too excessive, so that need to be reduced due to the excessive investment. If these attributes are applied to other areas, it is suspected to bring better results.
4 Discussion Parasuraman, Zeithaml, and Berry were among the earliest researchers to put interest on the service quality assessment. One main contribution of their works was to provide a concise definition of service quality as a global judgment, relating to the superiority of the service, and explained it as involving evaluations of the outcome and process of service act. It is a difference between customers’ expectations of what they want and their perceptions of what they get. According to these
4
MATEC Web of Conferences 68, 06003 (2016)
DOI: 10.1051/ matecconf/20166806003
ICIEA 2016 the result from the IPA techniques, we suggest the management to immediately improve the service quality. All aspects of service quality, including service efficiency, politeness and friendliness, as well as assurance should be maintained and consistently reviewed to see whether any improvements are required. The physical facilities should be improved in order to reach customer satisfaction. For instance, in-house training programs could be arranged to improve employee courtesy, helpfulness, understand ability, language skills, appearance, and service skills. Furthermore, the management should ensure that all employees are required to become involved in setting quality standards, and should realize that maintaining service quality is part of their jobs.
IPA technique. Because the IPA consists of two aspects: importance and performance, consequently, to combine with the SERVPERF, we used weighted version. SERVPERF which stands alone does not comprise the importance aspect thus it cannot be merged with the IPA technique. The result came from the SERVPERF model can assist the managers to identify where the performance improvement can best be targeted. The performance improvement in some attributes would be addressed for the lowest score. Rather, if some attributes have high scores, the managers could review whether they may be “over-supply” the particular features. The IPA technique used the scores form SERVPERF questionnaire and then plotted it into the two-dimensional state space. IPA is considered simple; it is used to understand customer satisfaction and prioritise areas for improvement. It has been widely used in service industries, see for example: [21], [22]. In short, this IPA evaluation tool is used to prescribe the prioritisation of attributes for improvement and it can also provide guidance for strategic development [23]. In previous case study, several attributes have been plotted in the certain quadrant of IPA. This could help the managers to find out attributes that are doing well and attributes that essentially to be improved. It has to be pointed out that IPA is not a tool for final decisions; it is a tool for problem conceptualization and initial analysis. It does not, and will not, yield quantitative information that should be the basis for final decisions. Rather, it assists to limit options thereby identifying which studies of scale, scope, benefits, etc. are needed to determine if resources should be expended on particular actions.
References 1. 2. 3. 4. 5. 6. 7. 8. 9. 10. 11.
5 Conclusion The research has demonstrated the assessment of service quality using weighted SERVPERF and identified the attributes of the service providers that perceived important by the customers and its performance. A case study was managed in the airport service, a capital intensive establishment. The SERVPERF model which consists of importance and perception aspects has been found to provide a relative simple and inexpensive means of doing service quality assessment. The results indicated that the assessment of service quality has many potential benefits for airport managers. Identifying customers’ perceptions of service quality for a particular establishment allows management to better tailor its marketing efforts to ensure patrons’ expectations are met. This includes identifying, prioritizing and improving areas of service weakness and ensuring that valuable resources are allocated in the most effective areas. In addition, promotional messages can be refined so that customers have realistic expectations of the service offered. Based on the overall performance scores, it was found that the service quality is low. Customers do not perceived high performance service delivered by the service provider. Combining the performance score and
12. 13. 14. 15. 16. 17. 18. 19. 20. 21. 22. 23.
5
S. C. Mehta, A. K. Lalwani, S. L. Han, Int. J. Retail Distrib. Manag. 28, 62–72 (2000) A. Parasuraman, V. A. Zeithaml L. L. Berry, J. Marketing 49, 41–50 (1985) G. R. Gilbert, C. Veloutsou, J. Serv. Marketing 20, 298–308 (2006) I. H. Chow, V. P. Lau, T. W. Lo, Z. Sha, H. Yun, Hosp. Manag. 26, 698–710 (2007) R. Ladhari, I. Brun, M. Morales, Int. J. Hosp. Manag. 27, 563–573 (2008) X. Luo, C. Homburg, J. Marketing 71, 133–149 (2007) A. Parasuraman, V. A. Zeithaml, L. L. Berry, J. Retailing 64, 12–40 (1988) J. Cronin, S. A. Taylor, J. Marketing, 56, 55–67 (1992) K. R. Teas, J. Marketing 57, 18–34 (1993) K.R. Teas, J. Marketing 58, 132–139 (1994) P. A. Dabholkar, D. C. Shepherd, D. I. Thorpe, J. Retailing 76, 139–173 (2000) J. A. Martilla, J. C. James, J. Marketing 41, 77–79 (1977) M. S. Sohail, A. S. Al-Gahtani, Int. J. Serv. Stan. 1, 482–493 (2005) D. Rhoades, B. Waguespack, S. Young, Managing Serv. Qual. 10, 257–262 (2000) L. J. Cronbach, Psychometrika 16, 297–334 (1951) J. Nagpal, A. Kumar, S. Kakar, A. Bhartia, J. Assoc Phys. India 58, 295–304 (2010) P. Asubonteng, K. J. McCleary J. E. Swan, J. Serv. Marketing 10, 62–81 (1996) E. Babakus G. W. Boller, J. Bus. Res. 24, 253–268 (1992) S. K. Jain, G. Gupta, Vikalpa 29, 25–37 (2004) M. K. Brady, J. Cronin, R. R. Brand, J. Bus. Res. 55, 17–31 (2002) M. J. Enright, J. Newton, J. of Travel Res. 43, pp. 339–350 (2005) J. E. Blose, W. B. Tankersley, L. R. Flynn, Qual. Manag. J. 12, 7–24 (2005) M. S. Wong, N. Hideki, P. George, J. Theor.. Elec. Commer. Res. 6, 17–30 (2011)