ASSESSING WEB SERVICE QUALITY DIMENSIONS: THE E- SERVPERF APPROACH Godwin J. Udo, University of Texas at El Paso,
[email protected] Kallol K. Bagchi, University of Texas at El Paso,
[email protected] Peeter J. Kirs, University of Texas at El Paso,
[email protected]
intentions. Adding to the challenges of managing e-customers, it has become crucial to understand how individual customer differences, in terms of their information technology (IT) skills, influence their online experience, behavior and attitudes. Some studies [1, 7] have indicated that individual differences can influence IT acceptance and satisfaction with IT use. E-service quality, as defined by Santos [25], is the overall customer perceptions, judgments and evaluations of the quality of service obtained from a virtual marketplace. Several authors [29, 25] have developed diverse instruments to measure e-service quality. Since these instruments have a little in common, exploratory studies are needed to derive a common instrument that can effectively evaluate e-service quality. Rowley [22] has further asserted that since research endeavors in e-service are still in their infancy more efforts are needed to obtain the correct definition and measure of e-service quality. Several studies on service quality in physical encounters have concluded that some factors are responsible for customers’ perceptions of quality which are likely to lead to customer satisfaction and which, in turn, may lead to behavioral intensions to purchase. Some authors [30, 31] have pointed out that behavioral intentions may predict behavior, implying that behavioral intention constructs are relevant to customer service. Given that satisfied customers are more likely to stay with a company for long periods, behavioral intentions directly impact company profitability. In this study, we review e-service related literature in order to identify the dimensions of e-service quality and to subsequently develop and test their constructs. The purpose of the present study is to:
ABSTRACT This study examines the dimensions of web service quality based on e-customer’s expectations and perceptions. We develop operationalized web service quality constructs, and analyze their relationships with customer satisfaction and behavioral intentions in an e-business environment. The three identified dimensions of web service quality are perceived risk, web content and service convenience. Although perceived risk may lead to a favorable perception of web service equality, it does not necessarily translate to customer satisfaction or positive behavioral intentions. Individual PC skill sets may affect perception of service convenience but seems to have no influence on how customers assess web service quality, customer satisfaction or behavioral intentions to use the e-service. The indirect or mediating influence of satisfaction on web service quality and behavioral intentions is as strong, if not stronger than, as the direct influence of web service quality and behavioral intentions. INTRODUCTION Computer-aided services have grown in number and significance in proportion to the rapid growth of Internet adoption. E-service growth, also known as web-based self-service, has further magnified the importance of service sector roles in modern economies. As commonly reported in the news media, service sectors in world economies continue to expand while manufacturing sectors are experiencing shrinkage, especially in the U.S. as electronic business environments post a new set of challenges to companies. One such new challenge is the quality of the electronic service (e-service) provided by company web sites and other electronic media. The quality of enterprise web sites has become a key indicator of how well a company is likely to satisfy its customers. Another new challenge is the rapid increase in the expectations and level of sophistication of the e-customers. In recent years, research efforts have been directed at understanding how e-customers perceive the quality of e-service as well as how these perceptions translate into customer satisfaction and behavioral VOL IX, No. 2, 2008
1. 2.
3.
313
understand e-customer expectations and perceptions of web service quality, develop and test an instrument that captures the constructs influencing the dimensions of web service quality based on noteworthy related studies, and investigate the relationship between web service quality, e-customer satisfaction and behavioral intentions to purchase.
Issues in Information Systems
Assessing Web Service Quality Dimensions: The E- Servperf Approach
We further advance some propositions to test these posits with respect to electronic customers. The remaining sections of this paper address the underlying concepts of e-service quality, research methodology, data collection, data analysis, and discussion of results.
PROPOSED RESEARCH MODEL 1) Perceived Risk. Risk, as perceived by the e-customer, has been identified as one of the major barriers to online shopping and thus major e-business firms have taken steps to address risk concerns with security technologies, awareness campaigns, and assurance policy statements. Perceived risk is also often denoted by such terms as personal risk, privacy risk, economic risk, psychological risk, technological risk [31, 13]. Since system failure is part of perceived risk and is often associated with a loss, it is easy to understand how perceived risk can impact e-service quality and e-customer satisfaction. Gefen et al. [8] concluded that perceived risk influences e-window shopping and e-purchasing intensions: the higher the perceived risk, the less likely an e-customer’s intention to purchase. Perceived risk evokes good or bad feelings which may in turn affect beliefs, attitudes and behavioral intensions [21]. Zhang and Prybutok [31] concluded that perceived risk has a significant influence on e-customer perceptions of e-service quality and as well as satisfaction.
CONCEPTS OF SERVICE QUALITY AND E-SERVICE QUALITY Consensus generally exists that service quality is a distinct construct, but there are discrepancies regarding service quality measurement. The SERVQUAL instrument proposed by Parasuraman et al. [18] focuses on computed disconfirmation, in which the difference between customer expectation and the actual performance (both measured after the service is performed) is calculated. An alternative approach, SERVPERF, is concerned only with customer perceptions of service performance [9, 6]. The increasing body of research in this area overwhelmingly supports the ‘perceptions only’ approach to measure service quality [6, 30]. Accordingly, we adopt the ‘perception only’ or SERVPERF approach. Parasuraman, et al. [20] suggest eleven dimensions of e-service quality, some of which are identical to the dimensions proposed as factors impacting service quality in physical service encounters. They define e-service quality as “the extent to which a website facilitates efficient and effective shopping, purchasing and delivery”. Yoo and Donthu [28] developed a four-dimension instrument comprised of nine items to measure site quality: ease of use, aesthetic, design, processing speed and security. Zhang and Prybutok [31] posit that the two prominent dimensions of web service quality are perceived risk and service convenience. Analysis of e-service literature has led us to conclude that there are several similarities and differences between service quality and e-service quality dimensions and constructs. E-service quality research borrows from the existing literature on service quality while at the same time accounting for the differences between the two concepts [25]. In an effort to add to this body of research, we propose a conceptual model of web service quality consisting of service convenience (moderated by individual PC skill differences), perceived risk, and web content. As shown on Figure 1, this study proposes that web service quality, convenience of service and perceived risk can lead to e-customer satisfaction which in turn can influence customer behavioral intensions.
VOL IX, No. 2, 2008
2a) Convenience of Service. One of the major benefits of online shopping is convenience of service in terms of access, information availability, lack of time or geographical barriers, and anonymity. Some studies indicate that online customers often cite convenience as a major reason for conducting business online [27]. According to Kim et al. [11], customer satisfaction is positively affected by the convenience of an online marketplace. Other authors [14] have found that service convenience has a significant influence on perceived service quality as well as on customer satisfaction. In contrast, Zhang and Prybutok [31] found no significant influence of service convenience on either perceived service quality or customer satisfaction. It has further been speculated that service convenience is determined by an individual’s knowledge and skill with various information technologies. Zhang and Prybutok [31] investigated the impact of individual differences in PC skills on how e-customers perceive service convenience. The aim of this study is to investigate the effect of service convenience on perceived e-service quality and satisfaction and how it affects an e-customer’s behavioral intensions. The next section is a discussion of the effect of individual differences in information system skills as it affects convenience of service. 2b) Individual IT Skill Difference. One difference between traditional service encounters and e-service experiences is that the e-customer relies entirely on his or her ability to use technology to obtain the service.
314
Issues in Information Systems
Assessing Web Service Quality Dimensions: The E- Servperf Approach
The customer thus becomes a partner in the delivery of the e-service. Ford et al [7] establish a strong relationship between individual differences and behavior in Internet search. Rowley [22] argues that increasing a customer’s knowledge and skill sets with a service process is a key organizational strategy for managing customer satisfaction. She maintains that firms need to go beyond simply providing good web site design and clear navigation instructions to implementing learning processes which will help their e-customers become more skillful when engaging in e-service encounters. Zhang and Prybutok [31] developed a five-item instrument to measure individual differences in IT skills and then investigated the effect of individual PC skills on service convenience. In our study, we used the Zhang and Prybutok instrument to capture e-customer PC skill levels in order to test its impact on service convenience.
Proposition P1: a)
b)
4) Web Service Quality (SQ). Since all e-service encounters are via web sites, some authors have emphasized the importance of web service quality as antecedents of e-customer satisfaction [14]. Web service quality is crucial not only because it is the primary asset that e-customers look for, but also because it shapes their initial impression of a web site’s value and determines whether they will continue their present and future searches on the web site. Wolfinbarger and Gilly [26] posit that e-customers’ quality judgment, satisfaction and loyalty are positively influenced by the design quality of the firm’s web site. Cho and Park [4] studied 435 e-customers in order to develop a user satisfaction index, and found that web service quality has a dominant influence on e-customer satisfaction. Loiacono et al. [14] developed a web service quality instrument (WebQual) consisting of 12 dimensions which were found to be significantly related to e-customer satisfaction. In the present study, we propose that a web site’s content plays a major role in determining web service quality. Unlike Zhang and Prybutok’s [31] study, we investigate the impact of web site content on perceived web service quality. We maintain that a commercial web site with better content is more likely to be perceived as having a higher service quality by e-customers.
3) Web Site Content. Web site content can be defined as the presentation and layout of the information and functions that captures the overall firm presence and its public image, and is assumed to affect how a customer perceives web service quality. The dimensions of web site content include: information quality, appropriateness of the amount of information, types of media, presentation mode and even size of the images. Content quality can be compromised by too little, or too much, information or the appeal it presents to the visitor. A combination of pictures and graphics can be used to augment text in order to improve the quality of website content. Yang et al. [27] identified six dimensions of e-service quality, four of which were content-based: (1) content on the Web site, (2) accuracy of the content, (3) aesthetics, which includes site attractiveness, and (4) pictures and graphics. Koernig [12] argues that effective web site content can positively influence customer attitudes toward the quality of web-based service they receive and hence can lead to behavioral intensions to continue to use the services of the website. Effective web content can make web-based service more ‘real’ and experiential to the e-customer. Size and style of graphs can be used to influence the perceptions of online shoppers. Researchers have also shown that the size and style of graphs not only influence perceptions but can also attract and retain e-customers [16]. Montoya-Weiss et al. [15] also confirm that graphic styles, among other dimensions of web site content, can influence online channel use and overall satisfaction.
5) Customer Satisfaction (SAT). Several studies conclude that satisfaction is an affective, rather than cognitive, construct [31, 26]. Rust and Oliver [23] define satisfaction as the “customer’s fulfillment response” which is an evaluation as well as an emotion-based response. It is an indication of the customer’s belief of the probability of a service leading to a positive feeling. While Cronin et al. [5] assessed service satisfaction using items that include interest, enjoyment, surprise, anger, wise choice, and doing the ‘right thing’, we employ three items that have been used in previous studies [31]. The items are: “I am satisfied with my previous online shopping experience.” “Online shopping is a pleasant experience.” and “Overall, I am satisfied with my e-service experience.”
The above discussion leads us to our first proposition:
VOL IX, No. 2, 2008
In the e-business environment, the dominant dimensions of web service quality will include: Perceived Risk, Service Convenience, and Web Site Content. In the e-business environment, Perceived Risk has a significant impact on Customer Satisfaction and behavioral Intentions.
315
Issues in Information Systems
Assessing Web Service Quality Dimensions: The E- Servperf Approach
6) Behavioral intentions (BI). According to a model presented by Zeithaml et al. [30], behavioral intentions can be captured by such measures as repurchase intentions, word of mouth, loyalty, complaining behavior, and price sensitivity. High service quality (as perceived by the customer) often leads to favorable behavioral intentions while a low service quality tends to lead to unfavorable behavioral intentions. Zeithaml et al. [30] further emphasized that behavioral intentions are relevant to a customer’s decision to remain with or leave a company. Zhang and Prybutok [31] concluded that customer experiences are related to behavioral intentions. The more positive the customer’s experience, the more likely he or she is willing to reuse the service. Again, we used three of Zhang and Prybutok’s [31] items to capture respondents’ behavioral intentions: “I intend to use the e-service”, “I intend to use the e-service frequently”, and “In the future, I intend to use the e-service whenever I have a need”.
METHODOLOGY AND DATA Based on the literature review, three factors were identified that could affect how customers perceive web service quality: service convenience, perceived risk, and web site content. Individual IT skill difference was also identified as a factor that could influence service convenience. All the items used in each measurement were selected from previous studies but some were modified to suit an e-business environment. As in previous studies, A seven-point Likert scale was used. Each of the constructs are shown in Table 1 and discussed below. Perceived Risk: This construct refers to how the e-customer perceives such concerns as privacy, security and credit card information. This measure captures the possible harm or loss that e-customer’s fear as a result of an online shopping experience. The four items used to measure this construct were taken from two previous studies [31].
Interrelationships among SQ, SAT, and BI. The literature is somewhat confusing about the causal ordering of service quality (SQ) and satisfaction (SAT) and which of the two constructs is a better predictor of behavioral intentions (BI) [6]. One group of researchers upholds that satisfaction is antecedent to service quality. Another group of researchers believes that service quality is antecedent to satisfaction since service quality is a cognitive evaluation. However, many authors conclude that both service quality and satisfaction have direct links to behavioral intentions [5, 6]. If the mediating effect is significant, an additional issue is whether the direct effect of service quality on behavioral intentions (i.e., SQ Æ BI) is statistically significant when SQ Æ SAT Æ BI is also simultaneously examined in the same conceptual model. This leads us to our second proposition:
Service Convenience: The three items that measure service convenience construct were developed and used by thee previous studies including Zhang and Prybutok [31, 11]. The items measure the customer’s perceived level of comfort and saving of effort and time as a result of online shopping when compared to physical shopping. Individual IT Skill Differences: This construct consists of five items developed and used by Algahtani and King [2] and Zhang and Prybutok [31]. Individual IT skill differences are based on personal computer (PC) skills using the most popular software applications: Microsoft Excel, Power Point and Internet browser. The general belief is that the more technologically skillful a customer is the better he or she can handle e-service technology.
Proposition P2: a)
b)
Web Site Content: This construct includes such dimensions as: information quality, appropriateness of the amount of information, types of media, presentation mode, size and types of the images, and the overall appeal of the web site. The six items that make up the construct of this measure were taken from previous studies and modified to suit the e-business environment [15, 26].
E-Customer Satisfaction plays a significant mediating role between Web Service Quality and Behavioral Intentions in the context of e-business environment. Both the direct effect (i.e., SQ Æ BI) and the mediating effect (i.e., SQ Æ SAT Æ BI) will provide a good explanation of e-customers’ behavioral intentions in the context of e-business environment.
VOL IX, No. 2, 2008
Web Service Quality: This set of measures has been addressed by several authors in recent years since it is been shown that the quality of web services influences the e-customer’s perception of satisfaction and even intentions to purchase [31]. The five items for this measure were taken verbatim from the previous studies
316
Issues in Information Systems
Assessing Web Service Quality Dimensions: The E- Servperf Approach
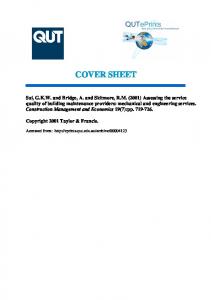
and root-mean-square error of approximation index (RMSEA = 0.092). Values greater than 0.9 are desirable for IFI, RFI, CFI, NFI and NNFI [3]. Moreover, a value smaller than 0.1 is acceptable for standardized RMSR and RMSEA [3]. The results show strong validity and reliability as well as strong fit indices provide support for proposition P1a: In the e-business environment, the dominant dimensions of web service quality will include: Perceived Risk, Service Convenience, and Web Site Content. The R2 value for Web Service Quality is 0.36 while that for satisfactions is 0.86. Preposition P1b: In the e-business environment, Perceived Risk has a significant impact on Customer Satisfaction and behavioral Intentions, was not supported by the results. The paths on Figure 1 are labeled with standardized regression coefficients most of which are statistically significant at p < 0.05. According to the findings, Perceived Risk has no relationship with either satisfaction or Behavioral Intentions. Furthermore, Perceived Risk does not influence how e-customers perceive web service quality. This result is interesting and contradictory to some previous research and will be further discussed later.
[31] and have been used in many other previous studies to measure the quality of web service. The items reflect ease of navigation, responsiveness, assurance, currency of information and other design qualities. Satisfaction and Behavioral Intentions: Three seven-point items (with endpoints strongly disagree/strongly agree) were used to measure customer satisfaction. Customer’s behavioral intentions were captured using three seven-point items with endpoints, namely: intention to use e-service frequently; intention to use e-service; and intention to use e-service in the future whenever there is a need. These items are taken from previous studies including Zhang and Prybutok [31] and Olorunniwo, et al. [17]. Sample and Data Analysis: A total of 211 completed questionnaires were used in the analysis. The respondents were senior business administration students at a large public university in the southwest US. Fifty-one percent of the students were female and 49% were males. In terms of their ages, 68.2% of the respondents were 24 years or younger, 20.4% were between 25 and 35 years of age, and only 8.3% were older than 35 years. With respect to salaries, 82.3% earned $30,000 or less per year, 9.4% earned $50,000 or less, and 8.3% earned over $50,000. In terms of online shopping frequency, 7.8% of the participants shopped two times or less in the last year, 16.6% shopped about three to six times, and 75.6 % shopped over six times. The participants were asked if they ever opted out of a web site during online shopping encounter, and 83.1% answered in the affirmative while only 15.9% answered in the negative. The reasons given for aborting or opting out included slow speed (11.9%), privacy or security (20.4%), price including shipping and handling cost (28%), and other reasons including doubts about quality, change of mind, payment options (19%). Table 2 provides the correlations among the study variables.
Insert Figure 1 Here To test proposition P2, we constructed a conceptual model where web service quality has both a direct effect (SQ Æ BI) and an indirect effect (SQ Æ SAT Æ BI) on behavioral intentions (see Figure 1). The R2 value for Behavioral Intentions is 0.92. As expected, the hypothesized paths between web service quality, customer satisfaction and behavioral intentions are all positive and significant, thus supporting the proposition P2. The standardized coefficients from web service quality to customer satisfaction and from customer satisfaction to behavioral intentions are 0.36 and 0.46, respectively. This highlights the important role of customer satisfaction in the context of online shoppers. The path between web service quality and behavioral intentions is also statistically significant with a standardized regression coefficient of 0.25. The implication is that although the direct effect of service quality on behavioral intentions is significant, the indirect effect of web service quality on behavioral intentions (via customer satisfaction) seems to be slightly stronger for customer behavioral intentions to use the e-service again.
Insert Table 2 Here To verify the dimensionality of the modified items used, a confirmatory factor analysis (CFA) was conducted. This technique provides a more rigorous interpretation of dimensionality than is provided by an exploratory factor analysis. The CALIS procedure of SPSS was used as the analytical tool for the estimation of the measurement and AMOS was used to create the structural equation models discussed below. Fit indices included in the present study are the incremental fit index (IFI = 0.97), relative fit index (RFI = 0.95), comparative fit index (CFI = 0.97), normed fit index (NFI = 0.96), non-normed fit index (NNFI or TLI = 0.97), root-mean-square residual index (RMSR = 0.10), VOL IX, No. 2, 2008
DISCUSSION AND CONCLUSION
317
Issues in Information Systems
Assessing Web Service Quality Dimensions: The E- Servperf Approach
research is also needed to verify the role of perceived risk on web service quality, satisfaction and behavioral intentions.
As the world economy becomes more web-based, the importance of web service quality research becomes more crucial. The purpose of the present study is threefold: (1) understanding the e-customer’s expectations or perception of web service quality, (2) developing and testing an instrument that captures the constructs of the dimensions of web service quality, and (3) investigating the relationship between web service quality, e-customer satisfaction and behavioral intentions to purchase. The web service quality scale was developed and tested using the data from college seniors. Three subscales were identified as first order dimensions of web service quality: ‘Service Convenience,’ ‘Perceived Risk,’ and ‘Web Site Content.’ Service Convenience was found to be influenced by individual PC skill differences. The more skillful the customers, the more convenience they perceived the e-services to be. Similarly, service convenience and content both have a significant influence on how customers perceive web service quality. Perceived risk did not influence web service quality. The findings also indicate that perceived risk did not influence either satisfaction or behavioral intentions, contrary to traditional findings in the literature [8, 7, 13]. It could be that improved security mechanisms are increasingly implemented, thus reducing the influence of perceived risk. It could also be that undergraduate students perceive risk to be less influential than practicing business professionals, or that this is a cultural belief of students of this particular region of the country. More research is needed to explore this fact. The findings indicate that while web service quality is an important driver of behavioral intentions, its indirect effect through customer satisfaction is equally, if not more, important in causing favorable behavioral intentions. The results of this study agree with the service quality literature which points to the fact that while service quality has a significant direct impact on behavioral intentions, customer satisfaction acting as a mediator between service quality and behavioral intentions, appears to make the impact of web service quality on behavioral intentions to be equally strong. E-Service managers need to devise operations strategies that focus on the dimensions of service quality that enhance customer satisfaction, which in turn can lead to positive behavioral intentions. Some limitations of this study include the use of students for survey data collection, and non-use of web service typology. Further empirical research is needed to investigate the effect of service quality construct on the web service quality and its relationship with customer satisfaction and behavioral intentions. The present study concludes the insignificant role of perceived risk which seems illogical. Additional
VOL IX, No. 2, 2008
REFERENCES 1.
Agarwal, R. and Venkatesh, V. (2002), “Assessing a firm’s web presence: a heuristic evaluation procedure for the measurement of usability”, Information Systems Research, Vol. 13, No. 2, pp. 168-186. 2. Al-Gahtani, S.S. and King, M. (1999) “Attitudes, satisfaction and usage: factors contributing to each in acceptance of information technology”, Behavioral Information Technology, Vol. 18, No. 4, pp. 277-297. 3. Anderson, J.C. and Gerbing, D.W. (1988), “Structural equation modeling in practice: a review and recommended two-step approach,” Psychological Bulletin, Vol. 103 No. 3, pp. 411-423. 4. Cho, N. and Park, S. (2001), “Development of electronic consumer user – consumer satisfaction index (ECUSI) for internet shopping,” Industrial Management and Data Systems, Vol. 101 No. 8, pp. 400-5. 5. Cronin J.J., Brady, M.K. and Hult, T.M. (2000), “Assessing the effects of quality, value, customer satisfaction on consumer behavioral intentions in service environment,” Journal of Retailing, Vol. 76 No. 2. pp. 193-216. 6. Cronin, J.J., and Taylor, S.A. (1992), “Measuring service quality: a reexamination and extension,” Journal of Marketing, Vol. 56 No. 3, pp. 55-68. 7. Ford, N., Miller, D. and Moss, N. (2001), “ The role of individual differences in internet searching : An empirical study,” Journal of American Society of Information Science and Technology, Vol. 52, No. 12, pp. 1049-1066. 8. Gefen, D., Karahanna, E. and Straub, D. (2003), “Trust and TAM in online shopping”, MIS Quarterly, Vol. 27, No. 1, pp. 52-85. 9. Gronroos, C. (1990), Service Management and Marketing, Lexington, MA: Lexington Books. 10. Kaiser, H.F. (1960), “The application of electronic computers to factor analysis,” Educational and Psychological Measurement, Vol. 20, pp. 141-151. 11. Kim, M., Kim, J. and Lennon, S.J. (2006), “Online service attributes available on apparel retail web sites: an E-S-QUAL approach,” Managing Service Quality, Vol. 16, No. 1, pp.51-77. 12. Koernig, S.K. (2003), “E-scapes: the electronic physical environment and service tangibility”,
318
Issues in Information Systems
Assessing Web Service Quality Dimensions: The E- Servperf Approach
13.
14.
15.
16.
17.
18.
19.
20.
21.
22.
23.
24. Sanchez –Franco, M.J. and Roldan, J.L. (2005), “Web acceptance and usage Model”, Internet Research, Vol. 15 No. 1, pp. 21-48. 25. Santos, J. (2003), “E-service quality – a model of virtual service dimensions”, Internet Research, Vol. 15, No. 1, pp. 21-48. 26. Wolfinbarger, M.F. and Gilly, M.C. (2001), “Shopping online for freedom, control and fun”, California Management Review, Vol. 43, No. 2, pp. 34-55. 27. Yang, Z., Peterson, R.T. and L. Huang, L. (2001), "Taking the Pulse of Internet Pharmacies." Marketing Health Services, Summer, pp. 5-10. 28. Yoo, B. and Donth, N. (2001), “Developing a scale to measure perceived quality of an Internet shopping site (SITEQUAL)”, Quarterly Journal of Electronic Commerce, Vol. 2, No. 1, pp. 31-46. 29. Zeithaml, V.A. (2002), “Service excellent in electronic channels”, Managing Service Quality, Vol. 12, No. 3, pp. 135-138. 30. Zeithaml, V.A., Berry, L.L. and Parasuraman, A. (1996), “The behavioral consequences of service quality,” Journal of Marketing, Vol. 60 No. 2. (April) pp. 31 – 46. 31. Zhang, X. and Prybutok, V.R. (2005), “A consumer perspective of e-service quality”, IEEE Transactions on Engineering Management, Vol. 52, No.4, pp. 461-477.
Psychology & Marketing, Vol. 20 No.2, pp.157-67. Liebermann, Y. and Stashevsky, S. (2002), “Perceived risks as barriers to internet and e-commerce usage,” Qualitative Market Research: An international Journal, Vol. 5, No.4, pp. 291-300. Lociacono, E., Watson, R.T. and Goodhue, “WebQual: measure of web site quality”, Marketing Educators Conference: Marketing Theory and Applications, Vol. 13, pp. 432-437. Montoya-Weiss, M., Voss, G. and Grewall, D. (2003), “Determinants of online channel use and overall satisfaction with a relational multichannel service provider”, Journal of the Academy of Marketing Science, Vol.31 No.4, pp. 448-58. Nitse, P., Parker K., Krumwiede, D. and Ottaway, T. (2004), “The impact of color in the ecommerce marketing of fashions: an exploratory study,” European Journal of Marketing, Vol. 38 No. 7, pp. 898-915. Olorunniwo, F., Hsu, M.K. and Udo, G.J. (2006), “Service quality, customer satisfaction, and behavioral intentions in the service factory”, Journal of Services Marketing, Vol. 20, No. 1, pp. 59-72. Parasuraman, A., Zeithaml, V.A. and Berry, L.L. (1988), “SERVQUAL: a multiple-item scale for measuring consumer perceptions of service quality,” Journal of Retailing, Vol. 64 (Spring), pp. 12-40. Parasuraman, A., Zeithaml, V.A. and Berry, L.L. (1994), “Reassessment of expectations as a comparison standard in measuring service quality: implications for further research,” Journal of Marketing, Vol. 58. pp. 111-124 Parasuraman, A., Zeithaml, V.A. and Malhotra, A. (2005), “ES-QUAL: a multiple-item scale for assessing electronic service quality”, Journal of Science Research, Vol. 7, No. 3, pp. 213-234. Pavlou, P.A. (2003), “Consumer acceptance of electronic commerce: integrating trust and risk with the technology acceptance model,” International Journal of Electronic Commerce, Vol. 7, No. 3, pp. 101-134. Rowley, J. (2006), “An analysis of the e-service literature: towards a research agenda,” Internet Research, Vol.16, No. 3, pp. 339-359. Rust, R.T. and Oliver, R.L. (1994), “Service quality: insights and managerial implications from the Frontier”, in : Rust R.T., Oliver R.L. editors: Service Quality: New Directions in Theory and Practice, Sage Publications, Thousand Oaks, CA; pp 72-94.
VOL IX, No. 2, 2008
319
Issues in Information Systems
Assessing Web Service Quality Dimensions: The E- Servperf Approach
.81* V4 Perceived Risk
.68* V5
.84*
V6
.87*
V7 V12
V11
.05
.57* V14 V15 V16
.87*
.68*
.59*
.88*
-.001
.76*
.50* V19
.80*
Web Service Quality
.25* .36*
.74*
.46* Satisfaction
V13 .23*
.34
.77*
V20
.81*
.86* V8
Service Convenience
.84* V9
SA1
.81*
SA2
.76*
SA3
.71*
V10 V1 V2
V3
.14*
.54*
*Indicates significance at p < .05 level
.36*
.97*
PC Skill Diff Figure 1: Study Model with Path Coefficients
VOL IX, No. 2, 2008
320
BI3
.67* .88*
.64* .55*
Web Site Content
BI2
-.08
V17 V18
BI1
Issues in Information Systems
Behavioral Intentions
Assessing Web Service Quality Dimensions: The E- Servperf Approach
Table 1. The Survey Instrument Please rate your skill in the following computer applications: 1 = low skill; 7 = high skill) Individual IT Skill Difference Low____________________High V1. Rate your skill in Microsoft Excel V2. Rate your skill in Microsoft Power Point V3. Rate your skill in using the Internet
1___2___3___4___5___6___7 1___2___3___4___5___6___7 1___2___3___4___5___6___7
[N/A] [N/A] [N/A]
Perceived Risk V4. I worry about credit card information being stolen. V5. I worry about the product quality on the Internet. V6. I worry about safe transaction on line. V7. I worry about how my personal information might be used when I buy online. Convenience of Service V8.Using the Internet makes it easier for me to shop. V9. Online shopping is convenient. V10. Shopping on line saves time compared to going to traditional store. Web Site Design Quality V11. It is easy to navigate on this site. V12. The information about the products for your needs/interest is sufficient to make a purchase decision. V13. The information about the products/services is adequate. V14. The vendor gives prompt service to customers. V15. It was easy to find what you were looking for. V16. The site seems to be up to date. Web Site Content V17. The website has an ideal amount of images/graphics. V18. The graphics on this website are appealing. V19. The contents of this website are useful for my purpose. V20. I am kept well informed of the developments at this website. Customer Satisfaction SA1. I am satisfied with my previous online shopping experience. SA2. Online shopping is a pleasant experience. SA3. Overall, I am satisfied with my e-service experience. Behavioral Intentions B11. I intend to use e-service frequently. B12. I intend to use e-service.
VOL IX, No. 2, 2008
321
Issues in Information Systems
Assessing Web Service Quality Dimensions: The E- Servperf Approach
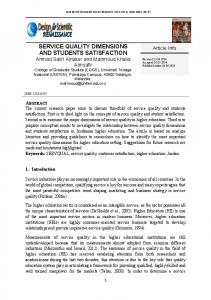
Table 2. The Correlation matrix for all exogenous and endogenous variables
IndivPCSkill Service Convenience P-Risk Web Content Web Service Quality Satisfaction Behavioral Intentions
INDIVPCSKILL 1.00 0.17* -0.21** -0.05 0.10 0.15* 0.12
S-CONV
P-RISK
W-CONT
WSQUAL
SAT
BI
1.00 -0.15* 0.09 .29** 0.86** 0.49**
1.00 -0.11 -0.16* -0.16* -0.07
1.00 0.55** 0.32** 0.35**
1.00 0.68** 0.65**
1.00 0.58**
1.00
** Indicates significance at p < .01 level; * Indicates significance at p < .05 level
VOL IX, No. 2, 2008
322
Issues in Information Systems