Soil & Water Res., 3, 2008 (3): 98–112
Assessing the Stream Water Quality Dynamics in Connection with Land Use in Agricultural Catchments of Different Scales Petr Fučík, Tomáš Kvítek, Martin Lexa, Pavel Novák and Alena Bílková Research Institute for Soil and Water Conservation, Prague, Czech Republic
Abstract: The ecological status of many surface waters in the Czech Republic is poor, mainly due to still relatively high discharges of N substances especially from agriculture. High nitrate values in the streams situated particulary in basins of drinking water reservoirs invoke the neccesity for the precise detection of diffuse pollution areas to enable the setting of the appropriate land management strategies or relevant measures. We introduce a simple method for estimating the changes of nitrate concentrations in surface waters regarding the land use modification. Stream and drainage water nitrate concentrations in prevailingly agricultural catchments of three different scales located in the Crystalline complex of the Czech massif were included in this study. Water quality samples were collected through the years 1992–2006 at monthly and bi-monthly intervals. For the catchment land use analysis, the satellite images LANDSAT 7 (CORINE Land Cover) and digitised cadastre maps of the land register were processed using ESRI ArcMap GIS; both sources corrected by field survey. We demonstrate on three different basin – scale studies a strong relation between the arable land ratio within a catchment and the coherent stream water nitrate concentration. The results acquired from all the evaluated catchments showed that every 10% decrease of ploughed land proportion in a catchment lowers the nitrate concentration C90 value (90% probability of non-exceedance) in average by 6.38 mg/l. Keywords: nitrates; land use; drinking water reservoir basins; GIS
The EU Water Framework Directive was launched in 2000 and so far is it the most important piece of water legislation in EU member states, requiring all inland and coastal waters in EU member states to have reached a good ecological status by 2015. High nitrate values in the streams situated particulary in basins of drinking water reservoirs are still a challenge. Hence, nitrogen and especially nitrate – nitrogen pollution in surface waters is still a prestigious theme of many scientific studies worldwide. Not surprisingly – nitrate in waters is considered to be the most ubiquitous and serious contaminant (Haygarth & Jarvis 2002). Nitrate
concentration, its origin in waters, seasonality, trends, and potential linkages to many various parameters are under investigation by a number of diverse methods. In each basin, the nitrate transport depends on a huge range of factors, which include specific agricultural and industrial management, landscape morphology, meteorological and hydrological conditions, biogeochemical processes in soil, sediments, and surface water as described by e.g. Burt et al. (1993), Thornton and Dise (1998), Haygarth and Jarvis (2002), Doležal and Kvítek (2004), Gardi (2004), Stålnacke et al. (2003). The idea and demonstration
Supported by the Ministry of Agriculture of the Czech Republic, Project No. MZE0002704901.
98
Soil & Water Res., 3, 2008 (3): 98–112 of the relation of nitrate concentration in water to the land use (portion of arable land) has been realised, modelled and pretty well documented by many scientific studies (e.g. Correl et al. 1980; Neill 1989; Whitmore et al. 1992; Burt et al. 1993; Haycock 1995; Pekárová & Pekár 1996; Worral & Burt 1999; Pionke et al. 2000; Ferrier 2001; Lenhart et al. 2003; Matejicek et al. 2003; Buck et al. 2004; Doležal & Kvítek 2004; Oenema et al. 2004; Poor et al. 2007; Krause et al. 2008). Higher nitrate amounts washed out of arable and together drained land (in comparison to other agricultural land use types) have several possible causes and explanations. In short – evident and illustrated are bigger fertiliser rate applications to ploughed areas and subsequent higher nitrate concentrations and losses in outflowing waters (Burt et al. 1993; Petry et al. 2002). On the other hand, although the amounts of fertilisers had greatly decreased during the last twenty years in the Czech Republic, no appropriate decrease of nitrates in waters has been observed (Lexa et al. 2006). On the arable land (compared to meadows and forests), usually no crops are present for the whole year which may utilise nitrogen and other nutrients (Kvítek & Doležal 2003; Kladivko et al. 2004). On ploughing the grassland, the soil organic matter decomposes more rapidly and the surplus nitrogen in it experiences accelerated mineralisation and nitrification (Svobodová 1981; Magid et al. 1994). In the case that artificial drainage is incidental beneath the ploughed parcels, it makes together the soil environment more aerobic, because the soil air ventilation and oxygen diffusion is easier when the soil is drier (Kulhavý et al. 2007). The idle nitrate is washed out from freshly drained and ploughed soils in large amounts ( Janeček 1981; Švihla 1992). So the tile drainage water, having ploughed districts as source areas and with high nitrate content, is now discharged directly into streams and frequently makes their water quality unacceptable even for a long time (Kvítek & Doležal 2003; Doležal & Kvítek 2004; Lexa et al. 2006). A not negligible share on surface water nitrate concentration may represent point pollution sources as well as atmospheric deposition of S and N (Novotny & Olem 1994; Thornton & Dise 1998). During the period 1994–2005, the mean annual DIN deposition in bulk precipitation ranged from 5.4 to 31.9 kg/ha/year as measured in the GEOMON catchments within the Czech
Republic (Oulehle et al. 2008). The total average N atmospheric deposition between the years 1998–2004 ranged from 11.6 to 8.95 kg/ha/year and remains rather stable. Contrary to N, S deposition has decreased substantially across Europe since the late 80’s. (Hůnová et al. 2004). Thornton and Dise (1998) investigated the relations between the selected catchment characteristics, atmospheric deposition, and stream water quality parameters of 55 streams in Lake Districts (England) by multiple regression analysis. They concluded that significant associations between N atmospheric deposition and nitrate loss via streams are disputable especially for agriculture– dominated catchments. Novotny & Olem (1994) declare that considerable uncertainty remains as to the importance of atmospheric source of nitrogen, especially for agricultural ecosystems. Concerning the point pollution sources, almost all the investigated catchments, except the majority of Kopaninský stream subcatchments, contain (to a greater or lesser extent) some spots of N pollution (scattered dwellings, waste water treatment plants). Kronvang et al. (2005) examined and quantified the sources apportionment of nutrient loads for the whole Želivka (Švihov) river basin in the period 1993–2000. All the N point sources made up together on around 15% average of annual total nitrogen loss. Our study did not incorporate the possible impact either of point pollution sources or of atmospheric deposition on surface water quality, since there was a lack of reliable data for all the catchments, especially concerning the point pollution sources. Within the context of proper management implementation or remedy arrangements adoption in a catchment a question arises – do we know how the water nitrate concentration can change in real units (milligrams, percentages) due to a modification of the catchment land use or, rather, arable (ploughed) land proportion? During the two last decades, great progress has been achieved in the area of the development of the systems simulating hydrological processes and hydrochemical responses of a catchment. However, not unfrequent seems to be the trouble with a serious lack of the required data sets, especially in the sphere of basin management practice. This study attempts to explore the relationships between N concentrations (expressed as C90 NO 3– value in accordance with the actual Czech legislation and standards; the government regulation No. 229/2007, the Czech 99
Soil & Water Res., 3, 2008 (3): 98–112
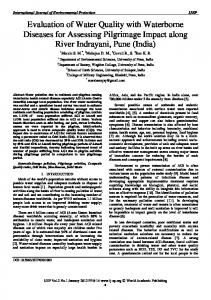
Figure 1. Placement of studied catchments within the Czech Republic
technical norm No. 75 7221 – Water quality – Classification of Surface Water Quality) and the arable land proportion in three catchments of different scales to examine the possible effects of lowering nitrate contents in surface waters due to a reduction of ploughed parcels portion in a catchment. Material and Methods Study areas Three scale different groups of catchments were included in this study; small subcatchments of the Kopaninský stream catchment, selected profiles and inherent catchments in the Želivka (Švihov)
river basin, and selected profiles and catchments of certain Czech drinking water reservoir basins; see Figure 1 for their placement within the Czech Republic. The Kopaninský stream catchment
The Kopaninský stream catchment is located in the Bohemo-Moravian Highland, Pelhřimov district, close to the Velký Rybník village and lies within the Švihov drinking water reservoir basin (on the Želivka river). It represents a typical local small agricultural catchment with a locally typical land use and locally typical soil types and distribution, and with built agricultural tile drainage systems (11.6% of the whole catchment area). The catchment is situated in the Czech crystalline complex and is
Table 1. Basic characteristics of the Kopaninský stream catchment Latitude
N 49°29’20.35’’
main channel length (km)
4.2
Longitude
E 15°18’24.61’’
average slope (%)
2.6
Altitude min–max 478–620 (m a.s.l.)
average annual precipitation (mm)
665 (Humpolec, 1905–1950)
Area (km2)
average annual temperature
7.0 ( Humpolec, 1905–1950)
100
7.1 (to the outlet profile T7U)
Soil & Water Res., 3, 2008 (3): 98–112 predominantly underlined by paragneiss; other parent rocks encountered are granite, orthogneiss and quartzite; sporadically sandy and loamy eluvium occures. The shallow aquifer is created by quaternary porous sediments, weathered zones of the basement crystalline rocks or shallow faults (Olmer et al. 1990). The dominant soil types are modal Cambisols and gleyic Stagnosols (Planosols). The information on the soil types classification and distribution was taken from the Czech soil valuation units database BPEJ (= VSEU – valuated soil-ecological units, 1:5000), which was created and is managed and updated by RISWC. Some other basic characteristics of the catchment are
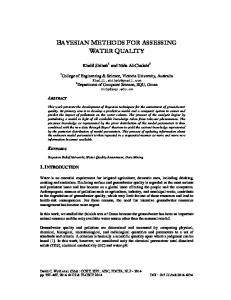
mentioned in Table 1, the catchment is illustrated in Figure 2. The experimental catchment is characterised by locally typical land use; 45% arable land, 37% forests (spruce production type predominantly), 13% meadows and pastures, 3.5% other surface (usually idled areas or wetlands), 1% orchards and gardens, and less than 1% of built up areas and water ponds. The upper and middle parts of the catchment slopes (especially flat hill tops) are usually ploughed except for the sites, mainly afforested, where the soils are too shallow or infertile (Doležal & Kvítek 2004). The study area consists of several subcatchments with vari-
Figure 2. Overview map of the Kopaninský stream catchment topography, land use and monitoring profiles included in this study; black point in the upper small map shows the catchment placement within the Czech Republic
101
Soil & Water Res., 3, 2008 (3): 98–112 Table 2. Land use characteristics within the studied Kopaninský stream subcatchments (D – tile drained catchment) Land use type Sub-catchment
Garden
Built-up
Water
Other
Meadow
Forest
Ploughed l.
% in a catchment T3
0.82
0.22
0.14
2.69
17.04
46.68
32.55
P33 (D)
0.00
0.00
0.01
0.76
17.03
4.97
77.23
P3
0.14
0.12
0.01
1.13
6.39
37.67
54.53
P21
10.97
5.64
2.04
18.51
26.34
4.60
31.90
P22
3.64
1.84
1.34
7.32
22.97
15.58
47.30
P41
0.78
0.11
0.00
3.35
12.00
15.42
68.34
P42
0.54
0.07
1.17
2.85
11.37
29.80
54.20
P51
0.00
0.00
0.00
0.00
0.00
100.00
0.00
P52
0.64
0.68
0.27
1.57
3.01
64.19
29.64
P6 (D)
0.00
0.00
0.00
0.42
2.40
0.00
97.19
T7U
0.95
0.62
0.53
3.50
13.08
36.66
44.67
P7 (D)
0.10
0.28
0.66
1.47
0.32
7.94
89.22
ous soil and land use properties, see Table 2 for details. Catchments within the Švihov drinking water reservoir (on the Želivka river)
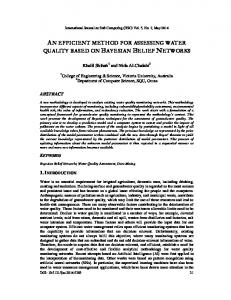
The drinking water reservoir Švihov on the Želivka river is the largest surface water supply pond in the Czech Republic. It is located in the north-east part of the Bohemo-Moravian Highland. From the soil types occurred modal to dystric cambisols upon the metamorphosed crystalline rocks (gneiss, paragneiss) in the flood plains and bottom lands planosols, fluvisols and gleysols. More Želivka river basin characteristics are noted in Table 3; the placements of the evaluated catchments and profiles are depicted in Figure 3. The Švihov drinking water reservoir has been an objective of many studies and scientific works, more information concerning the basin, dam, reservoir, and water quality dynamics can be found in e.g. Forejt (1996), Hejzlar et al. (1996, 2001), Kvítek 1999, Kvítek et al. (2003). Drinking water reservoir basins
The Research Institute for Soil and Water Conservation has been designing proposals for protective zones of drinking water reservoir basins for the Vltava river basin state enterprice manager (Povodí 102
Vltavy, státní podnik – in Czech) since 1994. The proposal documentation of twelve drinking water reservoir basins has been processed and submitted since then. Within the frame of the solved proposals, suitable river basins were selected for this study. Due to the lack of access to necessary data, only ten catchments of four basins were included; namely the basins of the drinking water reservoirs Lučina, Nýrsko, Římov, and Žlutice; the basin placement within the CzechRepublic is shown in Figure 1. From the geological point of view, a majority of the evaluated catchments belong mostly to the Moldanubical region (granite, biotite micaschist, Table 3. Basic characteristics of the Želivka (Švihov reservoir) river basin Basin area (km2)
1178.29
Altitude min–max (m a.s.l.)
318–765
Average annual precipitation (mm) 3
Average long time discharge (m /s)
671 6.927
Arable land (%)
55
Grassland and pasture (%)
12
Forest (%)
28
Water (%)
2
Build-up area (%)
3
Soil & Water Res., 3, 2008 (3): 98–112 Figure 3. Overview map of the Želivka river catchment monitoring profiles included in this study
quarcit, and biotite or cordieritical gneiss) except the reservoir Žlutice on the Střela river, whose geological environment is formed mainly of Permocarboniferous sediments and volcanics of the Doupov stratovolcano. Detailed description of all the analysed reservoirs and related catchments is mentioned in Kvítek et al. 2004. Data collection, processing, and statistical methods employed The Kopaninský stream catchment
The data on the water quality processed in this study were collected between the years 1992 (4)–2006 by manual sampling once a fortnight. The analyses were carried out in the certified laboratory in the Research Institute for Soil and Water Conservation, in accordance with proper
methodology and in conditions ensuring the quality of the data. Chemical analyses of water samples were besides NO 3– focused also on NO 2– and NH 4+. The measured levels of ammonia and nitrites were negligible and made together up to 5% on average of total inorganic nitrogen concentration. Except the water quality, stream and drainage water levels were measured here continuously by ultrasound sensors on V-notches (Thomson type). For each sub-catchment land use, analysis was performed using digital cadastre map of the land register corrected by the field survey. No meaningful land use modification was noted throughout the monitoring period in any of the evaluated Kopaninský stream sub-catchments. Watershed divides of the sub-catchments were generated upon contour lines (regular elevation step 2m) acquired from the Czech base map survey (ZABAGED in Czech), of the scale 1:10 000. There are two small 103
Soil & Water Res., 3, 2008 (3): 98–112 Table 4. Basic characteristics of the processed catchments located in the drinking water reservoir basins Water reservoir Nýrsko
Lučina
Římov Žlutice
Catchment number
Catchment area (ha)
Evaluated period
Úhlava, km 0.2
1-10-03-003
7012075.75
1999–2000
4.87
0.00
Zelenský s., km 97.2
1-10-03-006
15537274.72
1999–2000
6.33
0.00
Ševcovský s., km 0.3
1-10-01-007
9642029.67
2000–2001
11.47
8.45
Mže – obora km 98.8
1-10-01-006
6591537.79
1998–1999
9.30
2.27
Lužní s., km 0.1
1-10-01-013
30165897.69
2000–2001
13.78
20.86
Sklářský s., km 0.1
1-10-01-011
6118446.32
2000–2001
11.21
2.52
Velešínský s., km 0.2
1-06-02-038
5120597.43
1999
49.62
61.63
Malše – Sedlce, km 30.75
1-06-02-035
21148544.83
1999
11.96
22.3
Zvíkovský s., km 0.1
1-06-02-036
7071572.04
1999
39.00
41.53
Střela – Kojšovice
1-11-02-011
8408227.99
1999–2000
19.94
50.96
villages and several solitary settlements within the catchment, all without an evident influence on the water quality. Catchments within the drinking water reservoir Švihov basin
In the 90’s, concentrations of nitrate were monitored in selected small water streams of the Švihov drinking water reservoir basin on the Želivka river in the Bohemo-Moravian Highland by the Agriculture Water Management Authority (AWMA), state allowance organisation, the small water courses executive authority in the Czech Republic. This study presents the results from 36 analysed profiles. The frequency of extractions was once per month, the period analysed was from June 1993 to June 2002. Unfortunately, not all the profiles contain unbroken data series; the monitoring programme underwent a couple of revisions mainly due to the unstable amount of available money. Neither water discharges nor water levels were measured. To the end of 2000, the land use evaluation all over the catchments took place using the classification of the LANDSAT 7 images with 30 × 30 m resolution. A GIS coverage was created and subsequently actualised by the field survey. Selected Czech drinking water reservoir basins
The data from surface water quality monitoring, taken in monthly intervals and obtained from the Vltava river basin state enterprise manager, were 104
C90 NO3– (mg/l)
Profile name
Ploughed land ratio (%)
analysed as well as the land use within the selected profiles catchments. Water quality samples data were acquired and processed only for the period 1998–2001, depending on the data availability. Similarly as in the case of the Želivka basin catchments, the water levels were not measured. The land use and land cover evaluation (grassland, arable land, forest, urban areas and water) came out of the only attainable GIS coverage for each river basin area – CORINE, true to 1:100 000 scale. This coverage was compounded under the supervision of the Czech Ministry of Environment on the basis of satellite images (LANDSAT) with 25 × 25 meters resolution. For all data sets evaluation, standard statistical methods were employed for descriptive statistics and revealing possible relations (regressions – linear and exponential), using MsExcel and QcExpert 2.5 software. The water quality data were first plotted to provide a general overview of the possible courses and trends and concurrently tested for the distribution (Kolmogorov-Smirnov test of normality, outliers). C90 NO 3– values (90% percentile, 90% probability of non-exceedance) were used as dependent variables, as the independent characteristic served the ploughed land proportion within a catchment. Regrettably, since no discharge data sets were available for the majority of profiles, no flow adjustment was conducted to model relations between concentrations and flow rates. All testings and analyses were carried out at
0.02
16.53 15.95
0.02 0.03
10.72 4.78
–0.01 0.28
17.12 20.09
–0.07
51.07
–0.04
76.00 94.00 51.00 19.00 84.00 216.20
67.00
68.56 84.00 44.56 16.00 79.56 179.32
62.96
41.00 61.00 29.00 10.00 60.00 110.00
50.00
45.00 63.00 31.00 10.00 58.00 104.00
42.00
46.18 63.99 31.89 10.51 55.20 109.47
41.16
111.00 116.00 92.00 29.00 142.00 261.00
90.00
9.20 17.00 1.20 0.50 1.00 1.00
341 315
– statistically insignificant
32.00
0.18 –0.02
12.34 10.85
– –
11.22 9.16
–0.01 Linear trend
Mean square root error
134.00 67.00 50.00 46.00 C95
58.00
114.00 62.00 44.56 41.00 C90
51.00
44.00 49.00 20.00 32.00 Mode
39.00
58.00 49.00 29.00 32.00 Median
37.00
66.78 49.07 29.82 31.66 Mean
37.53
185.00 87.00 61.00 82.00 Max
77.00
1.10 5.80 3.10 2.50 0.50 Min
304 341 Count
341
340
06/92–10/06 Monitoring period
the significance level under the null hypothesis α = 0.05. Regression diagnostics were made next to classical regression summary statistics (R 2, F value) also for the residuals; Scott multicolinearity criterion, Cook-Weisberg test of residuals heteroscedasticity, Jarque-Berr test for normality distribution of residuals, and Durbin-Watson test for residuals autocorrelation were performed to ensure that all the regressions achieved were correct and statistically confirmative at the selected significance level. To ascertain how tight and cogent the regression was made, we constructed confidence (C.I.) and prediction (P.I.) intervals according to standard methods (Helsel & Hirsch 2002) for the conditional mean and for individual estimates of y, respectively. C.I.s and P.I.s are displayed around all the estimated slopes of the regression lines. The meaning of the (1 – α) × 100% confidence interval is that, in repeated collection of new data and subsequent regressions, the frequency with which the true y (mean) value would fall outside the confidence interval is α. Results and Discussion
341
NO3– (mg/l)
341
P41 P33 (D) 05/94–10/06 P3 06/92–05/05 P22 P21 T7U(T7) T3 Profile
Table 5. Statistical evaluation of Kopaninský stream catchments (D – tile drained catchment)
4.50
341 340
341
06/92–10/06
P42
P51
P52
P6 (D)
341
P7 (D)
Soil & Water Res., 3, 2008 (3): 98–112
A comprehensive statistical analysis of all data acquired was performed; detailed results are shown in the Tables 4–7. Nitrate concentrations in prevailing profiles are of about a typical seasonal sine behaviour with the highest peaks usually in the spring and lowest values during late autumn and winter. Concerning the longtime trends, no statistically significant linear trend in the surface and drainage nitrate concentration at the significancy level 0.05 was discovered within the subcatchments of the Kopaninský stream, except two sub-catchments repeatedly fertilized by very high amounts of pig slurry. Those two profiles were bypassed in the final regression (Figures 4 and 5). The final R2 coefficient reaches nearly 88% after linear (the best representative one) flowline fitting and so the possible average decrease of the C90 nitrate concentration value is 6.47 mg/l with every 10% arable land proportion reduction within the catchment. Confidence and prediction intervals constructed suggest that all the y values from the regression would meet the span of the P.I. belt, thus the attained regression formula could be pronounced valid for the whole span of the assessed data. The stable trend of nitrates (neither increasing nor 105
Soil & Water Res., 3, 2008 (3): 98–112
Min
Max
Mode
Median
Mean
C90
NO3– mg/l
Mean root square error
Linear trend
Catch- Ploughed Profile Evaluated period ment land number (month/year) area (ha) ratio (%)
Count
Table 6. Overview and statistical evaluation of the Želivka river profiles
201-13
5/1993–3/2001
1449.55
65.43
93
5.98 239.05 49.14 43.83 49.08 79.51
28.69 –0.19
304-01
3254.19
43.73
59
0.22 56.66 40.73 32.32 31.36 48.61
14.05
0.33
1307.33
68.13
89 14.17 81.45 39.84 44.71 45.5
63.92
13.86
–
5395.85
50.18
6.64 68.62 18.59 28.77 30.27 48.69
13.19
–
454.34
64.87
55 20.36 108.9 35.41 55.34 57.09 85.08
19.45
–
1901.59
61.95
85 10.62 94.29 78.8
18.8
304-07
6/1993–4/1998 6/1993–4/1998 + 1/2000–6/2002 6/1993–4/1998 + 1/1999–6/2002 6/1993–12/1997 6/1993–4/1998 + 5/2000–6/2002 6/1993–5/1995
127.37
65.06
24 11.51 85.44 15.94 31.65 40.08 64.72
20.78
304-08
6/1993–4/1998
875.73
54.97
59 15.94 71.71
42.5 38.96 39.45 52.41
11.69
–
304-09
6/1993–4/1998
764.57
42.24
59
8.41 57.55 30.99 30.54 30.32 43.91
10.69
0.14
304-10
6/1993–12/1997
453.59
68.45
55 16.38 81.45 48.69 46.48
46.1 66.93
14.52
–
304-11
6/1993–5/1995
257.13
52.15
24
0.35 51.35 16.82 21.25 24.07 44.22
14.44
1.10
304-12
6/1993–6/2002
3726.49
49.76
109
304-14
6/1993–4/1998
1524.72
35.18
59
4.43 47.81 33.64 27.45 27.06 38.58
304-15
6/1993–12/1997
409.38
42.4
55
4.87 74.81 16.82 35.86 34.53 55.51
304-16
6/1993–12/1996
443.73
83.51
43
9.3 73.04 20.36 38.96 40.14 62.59
15.64
–
304-18
6/1993–4/1998
690.11
63.88
59
7.53 55.34 32.32 32.76 33.39 46.13
9.33
–
304-19
6/1993–5/1995
72.13
88.4
24
6.2 71.71 26.56 34.53 38.68 63.66
18.94
1.33
304-21
6/1993–12/1999
1848.68
62.8
79 12.84 72.6
13.95
–
304-22
6/1993–3/2001 + 2548.57 4/2002–6/2002
50.28
94
23.8 40.59
12.22
–
304-23
6/1993–4/1998
1000.89
37.88
59 11.07 43.83 27.45 30.54 30.53 39.13
6.65
–
304-24
6/1993–12/1997
371.47
22.62
55 11.51 55.34 32.76 27.89 29.68 40.11
9.13
–
304-25
6/1993–12/1997
94.27
63.75
55
4.43 84.99 30.99 43.38 43.12 60.47
14.07
–
304-26
6/1993–4/1998
770.73
73.24
59 14.17 95.18 26.56 47.37 49.89 80.39
22.04
–
304-27
6/1993–6/2002
2945.02
51.52
109
304-28
6/1993–12/1999
590.42
65.05
79
304-29
6/1993–5/1995
219.36
73.81
24 19.48 81.45 35.41
304-39
6/1993–12/1997
284.1
57.25
55
7.97 59.32
304-40
6/1993–4/2000 + 4247.81 4/2002–5/2002
49.41
85
8.41 59.32 13.28
304-41
6/1995–4/1998
483.56
54.9
35
4.43 57.99 34.97 31.87 31.74 45.51
10.96
304-42
6/1995–4/1998
576.16
62.17
35
4.43 64.63 44.71 43.83 42.91 59.85
13.87
–
304-43
6/1995–4/1998
566.91
46.96
35
4.43 78.35 66.84 46.92 47.93 70.47
17.03
0.52
304-44
6/1995–12/1998
1376.88
43.42
43 13.72 50.91 26.56 31.87 31.92 42.05
7.93
–
304-45
6/1995–4/1998
490.98
66.28
35 15.05 73.04 46.48
42.5 43.07 64.45
15.08
–
304-46
1/1997–12/1998
1080.66
46.19
24
9.52 10.62 19.21
6.94 –0.40
304-47
1/1997–12/1998
480.98
42.61
24 12.84 75.7
48.25 30.54 33.55 48.25
13.85 –0.71
304-50
2/1999–3/2001
1331.36
37.41
26 15.94 39.4
24.79 25.45 27.51 37.85
304-02 304-04 304-05 304-06
– statistically insignificant
106
101
2.21 46.04 30.1
53.12 52.58 76.58
26.12 25.48 37.27
34.97 42.05 44.64 63.39
5.31 52.24 12.4
21.25
–0.05 1.52
9.82 –0.05 9.49
0.20
17.16 –0.25
5.75 90.75 11.51 37.23 38.58 68.79
21.76 –0.06
3.98 98.72
22.9
4.43 34.09
9.74 26.12 30.65 62.15
–0.21
42.5 46.63 71.18
17.98
1.19
9.74 24.35 26.59 45.06
14.81
–
4.43
30.1 30.12 47.99
13.84 –0.21
6.61
–
–
Y – C90 NO 3– (mg/l)
Soil & Water Res., 3, 2008 (3): 98–112
X – ploughed land ratio in a catchment (%)
Figure 4. Relation between C90 (NO3–) values and ploughed areas proportion in selected Kopaninský stream subcatchments; encircled values (slurried plots) were omitted
decreasing) within all these data agrees also with the dependence founded, with regard to the data series lenght and bearing in mind the absence of point pollution sources and a stable trend of atmospheric nitrogen deposition. For the analysed Švihov basin catchments, similar but not so clearly conclusive results concerning the correlation between nitrates and catchment ploughed land portions were obtained. The final correlation (R2 = 0.44) indicates that 10% decrease of arable land portion in a catchment can reduce C90 nitrate water concentration value by 7.01 mg/l on average, see Figure 6. After the construction of C.I.s and P.I.s for this regression, it was revealed that this dependence is not so unambiguous as in the previous case. The C.I.s for the mean response were not reached in 17 cases, approximately equally for the lower as for the upper confidence interval. Once however, the P.I. width was not reached; it was in the case of the data from the profile no. 304-46, which was monitored only for a 2-year period (January 1997–December 1998). Data from this profile are being the most apparent „outlier“ within all the data set, but were not omitted from the processing since even with this profile data included all the data group follows
the normal distribution. Statistically significant linear trends (both increasing and decreasing) were identified in the case of 17 profiles, but mostly in the shortly monitored ones or in the catchment with a considerable point pollution source. Profiles monitored for a longer time, a meaningful decreasing trend within the data was revealed (201-13, 304-28, 304-40). This could be explained by a decrease of point pollution sources influence within these catchments (mainly due to the increase of the number and efficiency improvement of sewage works), as generally reported for the whole Želivka catchment by Kronvang et al. (2005). Based on the evaluated data, generally no meaningful changes were discovered in surface water nitrate concentrations in the Švihov (Želivka river) reservoir basin. In the case of the processed drinking water basins catchments, the best fitted flowcurve appeared to be a linar one with R 2 = 0.76. The apparent exponential fitting proved not to be statistically significant and was not correct also due to the autocorrelation and heteroscedasticity of the residuals. Confidence intervals for the conditional mean and prediction intervals for individual estimates of y for this relation slope showed a pretty 107
Soil & Water Res., 3, 2008 (3): 98–112 120
CI - lower
110
CI - upper
100
PI - upper
PI - lower –
C90 NO3 3
–
Y - C90 NO3 (mg/l) –
Y – C90 NO 3 (mg/l)
90
– Linear reg. (C90 NO3-) 3)
80 70 60
y = 0.6474x + 23.371
50
R 2 = 0.8747
40 30 20 10 0
0
10
20
30
40
50
60
70
80
90
100
X - ploughed land ratio in a catchment (%)
Figure 5. Final relation between C90 (NO3–) values and ploughed areas proportion in selected Kopaninský stream subcatchments, 95% confidence (C.I.) and prediction (P.I.) intervals
good confidence range of the acquired regression, in spite of not so many profiles included and a rather shorter monitoring period for the majority of profiles. The realised regression says that ten percentage decline of arable land proportion within a catchment can reduce the nitrate concentration value C90 by approximately 5.65 mg/l, see Figure 7 for details. Unfortunately, the only data obtained came from short periods, not enabling to assess whether a trend course appeared. Similar relationships between nitrate concentration and arable (or agricultural) land portion in a catchment was reported by Correl et al. (1980), who mention 89% variation between nitrate concentrations on the basis of land use differences between the investigated basins. Neill (1989)
reports a direct relationship between river nitrate concentrations and the percentage of land area ploughed in the river catchment. He estimated that the mean nitrogen loss from land to rivers in the region was 2.0 kg/ha/year N for unploughed land compared to 76 kg/ha/year for ploughed land. Darby et al. (1988) showed that the amounts of nitrogen released upon the ploughing of temporary grassland was between 100–200 kg N/ha, depending on the length of time it had been under grass, in comparison to losses of 4 t N/ha over a 20 year period for permanent pasture. Thornton and Dise (1998) investigated 55 streams draining the central English Lake District, Cumbria, prevailingly on granitic bedrock, and found strong relationships using a multiple regression analysis between percentage
Table 7. Final estimation of possible C90 NO3– value decrease in the studied catchments Study area C90 (NO3– mg/l) value lowering with every 10% arable land proportion decrease
108
Kopaninský stream Catchments within drinking catchment water reservoir basins 6.47
5.65
Želivka river catchments
Mean
7.01
6.38
Soil & Water Res., 3, 2008 (3): 98–112 –
120
C90ȱNO3Ȭ 3 CIȱ–ȱlower
110
CIȱ–ȱupper
Yȱ–ȱC90ȱNO3–ȱ(mg/l)
100
PIȱ–ȱlower
90
PIȱ–ȱupper
80
– Linearȱreg.ȱ(C90ȱNO3Ȭ) 3)
70 60 50 40 30
y ȱ=ȱ0.7006x ȱ+ȱ16.07
20
R 2ȱ=ȱ0.4357
10 0 0
10
20
30
40
50
60
70
80
90
100
Xȱ–ȱploughedȱlandȱratioȱinȱaȱcatchmentȱ(%)
Figure 6. Relation between C90 (NO3–) values and ploughed areas proportion in selected Želivka river basin catchments, 95% confidence (C.I.) and prediction (P.I.) intervals
of agricultural land and nitrate concentrations (R2 = 0.40). Wade et al. (1998) showed that the conversion of upland with agricultural capability would have a direct impact on stream water quality in Scotland. They used the strong relationship between stream NO3-N levels and the percentage of agricultural land cover to show that mean concentrations and annual fluxes were likely to treble and double, respectively, if agricultural land increased from 2 to 10% of the catchment area. Obviously, statistically the tightest relationship between ploughed land parcels proportion and NO3– concentrations was revealed for the Kopaninský stream subcatchments; the regression found could be considered as a very truthful one, because
of quite a long data record and almost no point pollution sources. For the two other data groups; the acquired regressions are weaker (especially for Želivka catchments data group), and it is obvious that the data from a longer monitoring period would give a better and more accurate assessment of the anticipated relation, see Table 8 for comparison. Apparently, the amount of ploughed land proportion related better to nitrate concentrations in small catchments; the local land use and variation might be of greater importance for the catchments of analogous scale (several km2). Water quality in larger streams and catchments would be evidently better predicted by incorporating more factors to the analyses (e.g. fertiliser use, stock
Table 8. Table of acquired regressions diagnostics Data group Subcatchments of the Kopaninský stream catchment Catchments within the Želivka river basin Catchments within the selected drinking water reservoirs river basins
Regression formula
R2
F value
0.6474x + 23.371
0.88
55.82
0.701x + 16.07
0.44
26.25
0.57x + 5.85
0.76
25.62
109
Soil & Water Res., 3, 2008 (3): 98–112 80
–
C90 NO33
CI – lower 70
CI – upper PI – lower PI – upper –
Linear reg. (C90 NO3-) 3) 50 y = 0.5651x + 5.8509
-
– YY- – C90 NONO C90 3 (mg/l) 3 (mg/l)
60
40
R 2 = 0.762
30 20 10 0 0
10
20
30
40
50
60
70
80
X - ploughed land ratio in a catchment (%)
Figure 7. Relation between C90 (NO3–) values and ploughed areas proportion in selected catchments of certain drinking water reservoir basins, 95% confidence (C.I.) and prediction (P.I.) intervals
numbers, point pollution sources), as mentioned by Buck et al. (2004) and Neill (1989). Conclusion The linkages between the land use, especially ploughed land and stream water quality, are relatively well established, but not too many of the conducted research works covered up more basins of various extents. This paper introduces a simple estimation for surface water nitrate concentration changes in connection with the land use modification for catchments of different scales; together for very small subcatchments of tens of hectars, catchmets with the area from hundreds to thousand hectars, and for quite large catchments of the extent in hundreds to thousands km2. It was shown that nitrate concentration (expresed as C90 value) is strongly dependent on the land use, namely the arable land portion in a catchment. It was found that every 10% ploughed land ratio decline within a catchment can cause a drop of surface water nitrate concentration, expresed as C90 value, on average by 6.38 mg/l, see Table 7 for details. The study takes into account the results of analyses of selected water quality indices obtained partly during the 110
research and partly from the national monitoring programme carried out by the state water management services. Of course, the land use information alone may not suffice for an accurate estimation of the nutrient export from a catchment. In addition, the problems with nitrate may become more important as nitrogen deposition increases. Acknowledgements. The results presented were attained within the scope of several research and contract projects: Research program No. MZE0002704901 financed by the Czech Ministry of Agriculture, Designing the proposals of the drinking water basin protective zones for the Vltava river basin state enterprice manager (Povodí Vltavy, státní podnik in Czech) and cooperation with the Agriculture Water Management Authority (ZVHS in Czech), state allowance organisation, the small water courses executive authority in the Czech Republic. We would like to thank all of them as well as all the colleagues who willingly helped with related fieldwork.
References Buck O. et al. (2004): Scale-dependence of land use effects on water quality of streams in agricultural catchments. Environmental Pollution, 130: 287–299.
Soil & Water Res., 3, 2008 (3): 98–112 Burt T.P., Heathwaite A.L., Trudgill S.T. (1993): Nitrate Processes, Patterns and Management. Wiley, Chichester. Correl D.L. et al. (1980): Relationship of nitrogen discharge to land use on Rhode river watersheds. AgroEcosystems, 6: 147–159. Darby et al. (1988): The effects of increasing length of ley on the growth and yield of winter wheat. Rothamsted report I, 101–102. (As cited in Worral F. et al. 1999) Doležal F., Kvítek T. (2004): The role of recharge zones, discharge zones, springs and tile drainage systems in peneplains of Central European highlands with regard to water quality generation processes. Physics and Chemistry of the Earth, 29: 775–785. Ferrier R.C. (2001): Water quality of Scottish rivers: spatial and temporal trends. The Science of the Total Environment, 265: 327–342. Forejt K. (1996): Historical survey of water quality in the reservoir. In: Proc. Želivka – Drinking Water Reservoir Basin – Water Quality Problems. The Czech Technical-scientific Society, Prague, 43–50. Gardi C. (2004): Land use, agronomic management and water quality in a small Northern Italian watershed. Agriculture, Ecosystems and Environment, 87: 1–12. Haycock N.E. (1995): Landscape management strategies for the control of diffuse pollution. Landscape and Urban Planning, 31: 313–321. Haygarth P.M., Jarvis S.C. (2002): Agriculture, Hydrology and Water Quality. CABI Publishing. Oxon, New York. Hejzlar J., Čížek V., Forejt K., Knesl B., Kavalír P., Mutl S., Růžička M., Tesař M. (1996): The influence of diffuse pollution on drinking water quality in the Želivka supply system. In: Rijtema P.E., Eliáš V. (eds): Regional Approaches to Water Pollution in the Environment. Kluwer Academic Publishers, Dordrecht, 283–312. Hejzlar J. (ed.) et al. (2001): The Svihov Drinking Water Reservoir Basin – Results from Water Quality Monitoring in the Year 2000, Hulice, Pražské vodovody a kanalizace a.s., závod Želivka. (in Czech) Helsel D.R., Hirsch R.M. (2002): Hydrologic analysis and interpretation. In: Statistical Methods in Water Resources. Techniques of Water-Resources Investigations of the United States Geological Survey, Book 4, U.S. Department of the Interior, USGS. Hůnová I., Prošková J., Hesoun R., Kurfürst P., Ostatnická J. (2004): Atmospheric deposition in the area of the Czech Republic. In: Air Pollution in the Czech Republic. CHMI, Praha. (in Czech) Janeček M. (1981): Influence of tile drainage on water quality effluent from an agriculural catchment. Sborník UVTIZ – Meliorace, 17: 2–26. (in Czech)
Kladivko E.J. et al. (2004): Nitrate leaching to subsurface drains as affected by drain spacing and changes in crop production system. Journal of Environmental Quality, 33: 1803–1813. Krause S. et al. (2008): Assessing the impact of changes in landuse and management practices on the diffuse pollution and retention of nitrate in a riparian floodplain. Science of the total Environment, 389: 149–164. Kronvang B., Larsen S.E., Jensen J.P, Andersen H.E., Hejzlar J. (2005): Catchment 525 Report: Zelivka, the Czech Republic, Trend Analysis, Retention and Source Apportionment. [526 EUROHARP Report 17-2005, NIVA Report SNO 5086-2005.] Norwegian Institute for Water Research (NIVA), Oslo. Kulhavý Z., Doležal F., Fučík P., Kulhavý F., Kvítek T., Muzikář R., Soukup M., Švihla V. (2007): Management of agricultural drainage systems in the Czech Republic. Irrigation and Drainage, 56: 141–149. Kvítek T. (1999): Course of nitrate concentrations and analysis of agricultural catchment steadiness in the Svihov reservoir basin. Plant and Soil, 3: 107–111. (in Czech) Kvítek T., Doležal F. (2003): Water and nutrients regime of the Kopaninský stream catchment in the Bohemo-Moravian Highland. Acta Hydrologica Slovaca, 2: 255–264. (in Czech) Kvítek T. et al. (2004): Management Principles for the Differentiated Protective Zones Utilization by Grasslands within the Drinking Water Reservoir Basins. Research Institute for Soil and Water Conservation, Prague. (in Czech) Lenhart T. et al. (2003): Effects of land use changes on the nutrient balance in mesoscale catchments. Physics and Chemistry of the Earth, 28: 1301–1309. Lexa M., Kvítek T., Hejzlar J., Fučík P. (2006): Relation among tile drainage systems, waterlogged soil covered by grassland, and nitrate in brooks of the Švihov (Želivka) drinking water reservoir basin. Water Mangement, 8: 246–250. (in Czech) Magid J. et al. (1994): Vegetation effects on soil solution composition and evapotranspiration potential impacts of set-aside policies. Agriculture, Ecosystems and Environment, 49: 267–278. Matejicek L. et al. (2003): Ecological modelling of nitrate pollution in small river basins by spreadsheets and GIS. Ecological Modelling, 170: 245–263. Neill M. (1989): Nitrate concentrations in river waters in the south-eats of Ireland and their relationship with agricultural practice. Water Research, 11: 1339–1355. Novotny V., Olem H. (1994): Water Quality – Prevention, Identification, and Management of Diffuse Pollution. Van Nostrand Reinhold, New York.
111
Soil & Water Res., 3, 2008 (3): 98–112 Oenema O. et al. (2004): Effects of lowering nitrogen and phosphorus surpluses in agriculture on the quality of groundwater and surface water in the Netherlands. Journal of Hydrology, 304: 289–301. Olmer M., Kessl J. et al. (1990): Groundwater Zones. Work and Study – Book 176. Water Research Institute Prague-Podbaba, Praha. (in Czech) Oulehle F., Mc Dowell W.H., Aitkenhead-Peterson J.A., Krám P., Hruška J., Navrátil T., Buzek F., Fottová D. (2008): Long term trends in stream nitrate concentrations and losses across watersheds undergoing recovery from acidification in the Czech Republic. Ecosystems, 11: 410–425. Pekárová P., Pekár J. (1996): The impact of land use on stream water quality in Slovakia. Journal of Hydrology, 1-4: 333–350. Petry J. et al. (2002): Hydrological controls on nutrient concentrations and fluxes in agricultural catchments. The Science of the Total Environment, 294: 95–110. Pionke H.B. et al. (2000): Critical source area controls on water quality in an agricultural watershed located in the Chesapeake Basin. Ecological Engineering, 14: 325–335. Poor C.J. et al. (2007): The effects of land use on stream nitrate dynamics. Journal of Hydrology, 332: 54–68. Stålnacke P., Grimvall A., Libiseller C., Laznik M., Kokorite I. (2003): Trends in nutrient concentrations in Latvian rivers and the response to the dramatic change in agriculture. Journal of Hydrology, 1-4:184–205.
Svobodová V. (1981): The effect of agricultural activity on the quality of drainage waters. [Final Report C 11-329-109-02-05.] Research Institute for Soil Improvement, Prague. (in Czech) Švihla V. (1992): The influence of tile drainage on the diffuse pollution caused by agriculture and forestry in the Labe river basin. In: Proc. Present, Soil, Ecology. Pečky, 56–60. (in Czech) Thornton G.J.P., Dise N.B. (1998): The influence of catchment characteristics, agricultural activities and atmospheric deposition on the chemistry of small streams in the English Lake District. The Science of the Total Environment, 216: 63–75. Wade A., Neal C., Soulsby C., Smart R., Langan S., Cresser M. (1998): Impacts of land use and flow on nitrate concentrations and fluxes in an upland river system in North East Scotland. In: Haigh M., Krecjek J. (eds): Headwaters: Water Resources and Conservation. IASWC, 127–136. Whitmore A.P. et al. (1992): Potential contribution of ploughed grassland to nitrate leaching. Agriculture. Ecosystems and Environment, 39: 221–233. Worral F., Burt T.P. (1999): The impact of land-use change on water quality at the catchment scale: the use of export coefficient and structural models. Journal of Hydrology, 221: 75–90. Received for publication January 22, 2008 Accepted after corrections June 25, 2008
Corresponding author: Ing. Petr Fučík, Výzkumný ústav meliorací a ochrany půdy, v.v.i., Žabovřeská 250, 156 27 Praha 5-Zbraslav, Česká republika tel.: + 420 257 027 208, fax: + 420 257 921 246, e-mail:
[email protected]
112