European Water 30: 13-24, 2010. © 2010 E.W. Publications
Assessment of Intrinsic Vulnerability using the DRASTIC Model and GIS in the Kiti Aquifer, Cyprus K. Voudouris1, N. Kazakis1, M. Polemio2 and K. Kareklas3 1
Lab. of Engineering Geology & Hydrogeology, Dept. of Geology, Aristotle University, Thessaloniki, Greece. E-mail:
[email protected] 2 IRPI, Istituto di Ricerca per la Protezione Idrogeologica, Bari, Italy. E-mail:
[email protected] 3 Development Agency of Larnaca. E-mail:
[email protected]
Abstract:
Approximately 70% of the world’s population lives in coastal areas and the majority of these people depend on coastal aquifers for freshwater. For this reason, coastal aquifers are vulnerable to pollution and are now recognised as a crucial arena for future progress towards global freshwater sustainability. This paper deals with an assessment of the groundwater vulnerability of the Kiti aquifer, South Cyprus. The Kiti aquifer, covering an area of about 30 Km2 at a mean elevation of 20 m above sea level, is situated in the southern part of Cyprus, a region characterised by semi-arid climatic conditions. The groundwater resources are related to the Pleistocene coastal plain and the recent Tremithos river valley deposits. The concept of groundwater vulnerability is based on the assumption that the physical environment may provide some degree of protection for groundwater against human activities. The DRASTIC method, applied to evaluate aquifer vulnerability, was developed by the United States Environmental Protection Agency (EPA) as a technique for assessing groundwater pollution potential and is based on seven (7) parameters: Depth (D), Recharge (R), Aquifer media (A), Soil media (S), Topography (T), Impact of vadose zone media (I) and hydraulic Conductivity of the aquifer (C). Determination of the DRASTIC index (DI) involves multiplying each parameter weight by its site rating and summing the total. Based on DI values, a groundwater vulnerability map was produced using a Geographical Information System (GIS). The highest vulnerability values, covering a large expanse of the study area, are associated with shallow aquifers without great depth of vadose zone. The results provide important information, with the vulnerability map suitable for use by local authorities and decision makers responsible for groundwater resource management and protection zoning.
Keywords:
Aquifer, Cyprus, DRASTIC method, GIS technique, Kiti, Vulnerability
1. INTRODUCTION The socioeconomic development of a region depends on the availability of good quality water. Recent decades have seen a global increase in demand for freshwater, mainly satisfied by groundwater abstracted from aquifers via numerous wells and boreholes. Groundwater is under intense anthropogenic pressure in the Mediterranean basin, from sources such as changes in land use, urbanisation, a lack of proper sewerage, intensive agriculture and a general increase in demand. These factors can cause severe degradation of both the quality and quantity of groundwater resources (UNESCO, 1998; Civita, 1994; Polemio, 2005; Polemio et al., 2008). The most efficient method of combating groundwater pollution is its initial prevention. The new EC Directive 2006/118 on the protection of groundwater against pollution and deterioration, developed under Water Framework Directive 2000/60, sets out criteria with which to assess the chemical status of groundwater bodies. The aforementioned Directives have also forced EC member states to ensure good chemical and ecological groundwater conditions. Given this description of the problem, it seems necessary to individuate and implement a water system management strategy in order to guarantee sustainability of water use and safeguard ecosystems depending on water resources (Foster & Hirata, 1998; Gianneli et al., 2007). The concept of aquifer vulnerability to external pollution was introduced in the 1960s by Margat (1968), with several systems of aquifer vulnerability assessment developed in the following years (Aller et al., 1987; Civita, 1994; Vrba & Zaporozec, 1994; Sener et al., 2009; Polemio et al., 2009).
14
K. Voudouris et al.
Vulnerability refers to the sensitivity of an aquifer system to deterioration due to an external action (Al-Zabet, 2002). It is an intrinsic property of an aquifer system and can vary with regard to the specific natural and/or human impact. It is pointed out that vulnerability is a general concept and can be used in the assessment of impacts from floods or droughts (Tsakiris, 2009). In the last few decades, many techniques have been developed to assess groundwater vulnerability, including index, rating, hybrid, statistical and simulation methods (Voudouris, 2009). The DRASTIC method has been the most commonly used for mapping vulnerability in porous aquifers (Aller et al., 1987). This paper deals with the groundwater vulnerability in the alluvial aquifer of the Kiti aquifer, South Cyprus. Firstly, results from previous hydrogeological studies, including the development of aquifers, hydraulic parameters and groundwater quality are discussed. A vulnerability map is then presented, produced using the DRASTIC method in a GIS context (Vrba & Zaporozec, 1994; Polemio & Ricchetti, 2001; Panagopoulos et al., 2005; Gemitzi et al., 2006). This scientific work was carried out within the framework of an INTERREG III B ARCHIMED program, funded by the European Union (Voudouris et al., 2007).
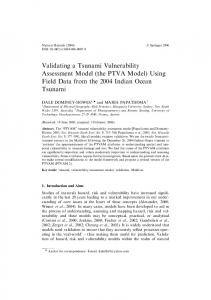
2. DESCRIPTION OF STUDY AREA The region of study is the River Tremithos basin (Kiti aquifer), situated in the southern part of Cyprus and covering an area of about of 30 Km2 (Fig. 1). It extends from the border of the Kiti Community as far as the coast and contains both residential and rural land-use (Fig. 1). The most important economic activities in the area are tourism and agriculture. At an elevation of 20 m above sea level, the region is characterised by semi-arid climatic conditions, with a mean annual rainfall of 342.5 mm and a mean annual temperature of 19.6 oC. A simplified geological map is shown in Fig. 2. The study area is affected by many pollution sources (agricultural activities, municipal wastes) influencing groundwater quality.
Figure 1. Topographic map of the Kiti area.
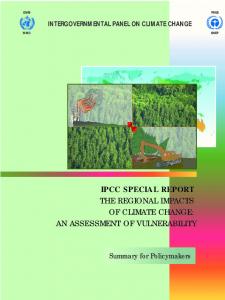
The groundwater resources are related to the Pleistocene coastal plain and the recent Tremithos River valley deposits. The thickness of the deposits varies from 45 m near the mouth of the River Tremithos to about 20 m near the village of Kiti (MANR, 1982). Figure 3 shows a N-S geological cross-section through the Kiti aquifer system. The system is layered, consisting of an upper unconfined alluvial aquifer separated from a lower confined carbonate aquifer by Pliocene marls (Milnes & Renard, 2004).
European Water 30 (2010)
Figure 2. Geological map of the Kiti area (above) and a typical geological profile (below; Geological Survey Department, with modifications).
Figure 3. Geological cross-section through the Kiti aquifer (Adapted from Milnes & Renard, 2004).
15
16
K. Voudouris et al.
Over-exploitation during the last few decades has led to seawater intrusion. Water levels recovered in the 1990s, but today remain below sea level during the pumping season (Fig. 4). Until 1981, groundwater abstraction took place at an average rate of 3x10⁶ m3/yr, but has since decreased to 1.3x10⁶ m3/yr in recent years (Milnes & Renard, 2004). Saturated thickness is 2-3 m, while transmissivity values range between 6-135 m2/d, as deduced from pumping tests (MANR, 1982). Permeability ranges from 2 to 80 m/d. Groundwater flow generally follows the topography of the area, moving towards the sea. Degradation of groundwater quality is mainly caused by seawater intrusion and nitrate pollution. Seawater intrusion phenomena are recorded in the coastal part of the study area, while nitrate pollution is mostly associated with agricultural activity. High nitrate concentrations are recorded in the central part of the basin, reaching levels of up to 300 mg/l - much higher than the limit established by the European Union Nitrate Directive 91/676/EEC. Water quality is classified into two dominant types: Ca-HCO3 (freshwater) and Na-Cl (brackish water in coastal areas affected by seawater intrusion). groundwater level
G12
8
4
1/03
3/01
9/00
3/00
1/99
3/98
3/97
3/96
5/95
9/94
3/94
9/93
3/93
9/92
-2
3/92
0
9/91
2 3/91
m a.s.l.
6
-4 Figure 4. Fluctuation of groundwater level in m a.s.l.
3. GROUNDWATER VULNERABILITY ASSESSMENT BY THE DRASTIC METHOD The concept of groundwater vulnerability is based on the assumption that the physical environment may provide some degree of protection for groundwater against human activities. Vrba and Zaporozec (1994) defined intrinsic vulnerability as an inherent property of an aquifer. In other words, vulnerability represents the degree of weakness of an individual aquifer system to pollution. In this study, intrinsic vulnerability was evaluated using the DRASTIC method, a system typically used in groundwater assessment. The DRASTIC index is even more accurate as part of hydrogeological investigations on a local scale or when more detailed data are available (Gogu & Dassargues, 2000; Martinez-Bastida et al., 2010; Massone et al., 2010). The acronym DRASTIC (Aller et al., 1987; Al-Adamat et al., 2003) is derived from the initials of the seven (7) assessed parameters: Depth, Recharge, Aquifer media, Soil media, Topography, Impact of vadose zone media and hydraulic Conductivity of the aquifer. In determining the DRASTIC index (DI), each parameter is assigned a numeric rating of between 1 (least pollution potential) and 10 (highest pollution potential), depending on its value at the site in question. Each parameter is also assigned a weighting factor ranging between 1 and 5, based on their relative influence in affecting pollution potential (Table 1). Calculation of the DI then involves multiplying each parameter weight by its site rating then summing the total and can be expressed as follows:
European Water 30 (2010)
17
7
DI = ∑ rj .w j or DI = DrDw + RrRw + ArAw + SrSw + TrTw + IrIw + CrCw
(1)
j =1
where: D, R, A, S, T, I and C are the parameters, r is the rating of each parameter for the study area and w is the importance weight for the parameter. The higher the DRASTIC index value, the greater the groundwater pollution potential and aquifer vulnerability. Some researchers have modified the DRASTIC method and introduced additional parameters such as land use index, aquifer thickness etc. (Secunda et al., 1998; Voudouris & Mandilaras, 2004; Panagopoulos et al., 2005). Table 1. Relative weights given to the DRASTIC parameters (Aller et al., 1987). Parameters D R A S T I C
Depth Recharge Aquifer media Soil media Topography Impact of vadose zone media Hydraulic Conductivity of the aquifer
DRASTIC Weight (typical) 5 4 3 2 1 5 3
The DRASTIC method was developed using 4 assumptions (Al-Zabet, 2002): 1. the pollutant is introduced at the ground surface 2. the pollutant is flushed into the groundwater by rainfall 3. the pollutant has the velocity of water 4. the area evaluated using DRASTIC is 40 hectares or larger. Values of the parameters used in the aforementioned method are essentially derivable from monitoring gauges, hydrogeological field surveys including water level measurements, pumping tests and soil analyses, as well as remote sensing studies. A database was established in order to input the collected data into Arcview 3.2a GIS, which offers the ability to store, manipulate and analyse data in different formats and at different scales (Rahman, 2008; Voudouris, 2009; Sener at al., 2009). Once in the database, it is then possible to register all data as data layers with a common coordinate system and manipulate them to produce thematic maps, including the overall study area vulnerability map.
4. RESULTS 4.1 Model parameters 4.1.1 Depth to groundwater (D) The value of the variable D (Depth to the water table) was obtained using piezometric maps. The depth to groundwater in the alluvial aquifer of the Kiti basin ranges from less than 4.5 to more than 18 m below the ground surface (Fig. 5). In general, the deeper the water levels are, the longer the pollutant takes to reach the groundwater table (Voudouris & Mandilaras, 2004).
18
K. Voudouris et al.
Figure 5. Depth to groundwater rating map.
4.1.2 Net recharge (infiltration) (R) Net recharge is the total quantity of water which infiltrates from the ground surface to the aquifer on an annual basis. Leaching and transport of pollutants from the surface due to rainfall that infiltrates through the vadose zone is a very important associated process in terms of aquifer vulnerability. The variable R was calculated from rainfall data and coefficients of infiltration of geological formations. The amount of annual rainfall that infiltrates the aquifer varies from 10 to 20%, depending on soil type and lithology. As a result, net recharge in the study area ranges between 35-85 mm/yr, as shown by the thematic map in Fig. 6.
Figure 6. Net annual recharge rating map.
4.1.3 Aquifer material (A) The evaluation of variable A (Aquifer material) was based on data from the geological map and drilling analyses. Based on this information, the aquifer media was classified as (Fig. 7): 1. Gravel, 2. Sand and Gravel, 3. Sandstone and 4. Limestone
European Water 30 (2010)
19
In general, the larger the grain size of a material, the higher its permeability and the lower its attenuation capacity.
Figure 7. Aquifer media rating map.
4.1.4 Soil media (S) Soil type plays an important role in the net recharge of an aquifer, with the presence of fine material decreasing infiltration and therefore also pollution potential. The value of variable S (Soil type) was obtained from soil classification maps produced by the Geological Survey Department of Cyprus. The predominant soil types are (Fig. 8): fine textured, medium textured, coarse textured, thin layer of soil and no soil.
Figure 8. Soil media rating map.
20
K. Voudouris et al.
4.1.5 Topography (T) The variable T (Topography) was obtained via elevation points, using the triangulation method in the ARC/INFO system (Fig. 9). This parameter controls the likelihood of a pollutant to be transported by runoff or to remain on the ground where it may infiltrate the surface. The topography of the Kiti area is for the most part a flat plain where slopes are generally shallow (18 3 15 Weight: 5 5. Topography Slope Ranges Ratings (%) (Dr) 85 6 24 55-85 4 16 35-55 3 12 80 9 27 60-80 8 24 40-60 7 21 140), High (120-140), Medium (100-120) and Low (