APPLIED AND ENVIRONMENTAL MICROBIOLOGY, Sept. 2009, p. 5863–5870 0099-2240/09/$08.00⫹0 doi:10.1128/AEM.00748-09 Copyright © 2009, American Society for Microbiology. All Rights Reserved.
Vol. 75, No. 18
Assessment of Microbial Communities by Graph Partitioning in a Study of Soil Fungi in Two Alpine Meadows䌤† L. Zinger,1* E. Coissac,1 P. Choler,1,2,3 and R. A. Geremia1 Laboratoire d’Ecologie Alpine, CNRS UMR 5553, Universite´ de Grenoble, BP 53, F-38041 Grenoble Cedex 09, France1; Station Alpine J. Fourier CNRS UMS 2925, Universite´ de Grenoble, F-38041 Grenoble, France2; and CSIRO Marine and Atmospheric Research, Canberra, Australia3 Received 2 April 2009/Accepted 10 July 2009
Understanding how microbial community structure and diversity respond to environmental conditions is one of the main challenges in environmental microbiology. However, there is often confusion between determining the phylogenetic structure of microbial communities and assessing the distribution and diversity of molecular operational taxonomic units (MOTUs) in these communities. This has led to the use of sequence analysis tools such as multiple alignments and hierarchical clustering that are not adapted to the analysis of large and diverse data sets and not always justified for characterization of MOTUs. Here, we developed an approach combining a pairwise alignment algorithm and graph partitioning by using MCL (Markov clustering) in order to generate discrete groups for nuclear large-subunit rRNA gene and internal transcript spacer 1 sequence data sets obtained from a yearly monitoring study of two spatially close but ecologically contrasting alpine soils (namely, early and late snowmelt locations). We compared MCL with a classical single-linkage method (Ccomps) and showed that MCL reduced bias such as the chaining effect. Using MCL, we characterized fungal communities in early and late snowmelt locations. We found contrasting distributions of MOTUs in the two soils, suggesting that there is a high level of habitat filtering in the assembly of alpine soil fungal communities. However, few MOTUs were specific to one location. avoid this limitation and have already been used in bacterial (25) and fungal community studies (37, 39). However a large proportion of DNA sequences obtained from massive sequencing are partial sequences due to interruption of the sequencing reaction, which causes the NWS algorithm to overestimate the distance between complete and partial sequences that are actually similar. In this context, use of a variant of this algorithm, Free End Gap (46), has the advantage that gaps opening or extending at the beginning or at the end of partial sequences are not penalized. DNA classification is an application of graph theory from mathematics. It consists of partitioning a graph composed of nodes (DNA sequences) connected by edges (similarities) so that each node belongs to only one cluster and is connected to most of the other nodes in this cluster (Fig. 1). There are numerous graph partitioning methods with different philosophies. The use of a particular method can influence the diversity and richness estimates for microbial communities. The most classical graph partitioning methods, the single- and complete-linkage methods (3), are based on merging a node or a cluster with the nearest (single link) or farthest (complete link) neighbors. While the single-linkage method is a true partitioning method, the latter approach relies on the maximal clique concept, where one node can belong to several clusters. This feature is often bypassed by artificially organizing the classification into a hierarchy, which is not always justified biologically. On the other hand, the single-linkage method fails to separate clusters connected by one or few nodes, resulting in the so-called “chaining effect” (Fig. 1). The Markov clustering algorithm (MCL) is an alternative to the classical clustering methods. Like the single-linkage method, it is a true partitioning method that additionally simulates node merging according
Assessment of the diversity and composition of microbial communities is a central issue in understanding the effects of environmental conditions on microbial community assembly. With this framework, massive cloning and sequencing or pyrosequencing of universal DNA markers (e.g., rRNA genes) allows microbial communities to be characterized in a qualitative and semiquantitative way (37, 50). The composition and diversity of microbial communities based on such methods are assessed by (i) evaluating distances between DNA sequences, (ii) classifying DNA sequences in molecular taxonomic units (MOTUs), and (iii) identifying MOTUs using reference databases (i.e., barcoding approaches) (48). Although numerous studies have focused on subsequent estimation of diversity and richness (24, 39, 44), only a few studies have cast doubt on the alignment and sequence classification methods (25). Multiple-sequence alignment tools are fairly popular in environmental microbiology, although establishment of phylogenetic links between phylotypes is not necessarily required. DNA markers that are well suited for barcoding approaches sensu lato, as defined by Valentini et al. (48), require sufficient variation in composition and size, making analysis of subsequent data sets with multiple-sequence alignments difficult. Indeed, based on heuristics, these algorithms excessively penalize insertion-deletion events (32). Pairwise-sequence alignments obtained using exact algorithms, such as NWS (35),
* Corresponding author. Mailing address: Laboratoire d’Ecologie Alpine UJF/CNRS, Universite´ de Grenoble, 2233, rue de la Piscine, BP 53 Bat D Biologie, Grenoble F-38041, France. Phone: 33-4-76-5144-59. Fax: 33-4-76-51-42-79. E-mail:
[email protected]. † Supplemental material for this article may be found at http://aem .asm.org/. 䌤 Published ahead of print on 17 July 2009. 5863
5864
ZINGER ET AL.
APPL. ENVIRON. MICROBIOL.
numerous studies have focused on mycorrhizal fungus distributions (11, 18, 34, 41). However, only a few surveys have attempted to characterize whole soil fungal communities (5, 43). In previous work, we highlighted covariations in snow cover dynamics and the composition and diversity of soil fungal communities (55). Although these studies provided insight into the seasonal succession and diversity of fungal communities in alpine tundra, the assembly of these communities remains poorly characterized. To avoid the limitations of classical analysis methods for DNA sequence classification, we coupled pairwise-sequence alignments with a graph partitioning approach by using MCL. In order to illustrate the suitability of MCL, we compared the clustering quality obtained with this algorithm and that obtained with a classical single-linkage method, Ccomps (connected components). We analyzed two data sets resulting from massive cloning and sequencing of internal transcript spacer 1 (ITS1) and part of the large-subunit rRNA gene (LSU). These DNA regions were chosen because more-numerous sequences are available in international databases and provided the opportunity to assess the suitability of the clustering method for both highly polymorphic and conserved DNA fragments. Data sets were obtained for two closed soils that differed in snow cover duration: soil from an early snowmelt location (ESM) and soil from a late snowmelt location (LSM) (see Materials and Methods). The proposed approach was used to further characterize ESM and LSM fungal communities and their seasonal variations. MATERIALS AND METHODS
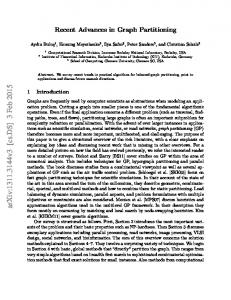
FIG. 1. Weighted nondirected graph showing the clustering results for a data subset subjected to (A) Ccomps and (B) MCL clustering. Each node represents a clone, and each edge represents a similarity value of at least 98% for two clones. The different shades of gray of labels illustrate the subgroups formed by Ccomps and MCL. The graphic was drawn with fdp (www.graphviz.org).
to the local neighborhood topology, avoiding the chaining phenomenon (49). This method is being used increasingly in bioinformatics, mostly in proteomic and genetic analyses (7, 13, 29, 52). Fungi are ubiquitous in soils and can have a broad range of functions in ecosystem processes. They are involved in nutrient cycling through mycorrhizal associations and litter decomposition, and they also strongly affect plant diversity via mutualisms or pathogenic interactions (1, 17, 21). Moreover, soils contain a great diversity of fungal species (1, 6, 37), whose spatial distribution results from many factors, such as dispersal, plant coverage, land use, and soil properties (14, 27, 30, 43, 51). Temperate alpine tundra landscapes exhibit mesotopographical variations that strongly affect local snow cover dynamics (28), which in turn influences soil properties, plant cover, and ecosystem processes (10, 12, 31). Alpine tundra thus is a mosaic of ecosystems distributed along snow cover gradients. Fungi have previously been described as an important component of the soil microbial biomass in alpine soils (43), and
Study site description and sampling. The study site was located in the Grand Galibier massif (French southwestern Alps; 45°0.05⬘N, 06°0.38⬘E; elevation, 2,480 m). The compositions of microbial communities at ESM and LSM locations were studied. Although the two locations were separated by only approximately 20 m, they differed greatly in the duration of winter snow cover because of topographical effects. The shallow winter snowpack in the ESM plot led to freezing of the soil in winter and dominance of a stress-tolerant graminoid, Kobresia muysoroides (Cyperaceae), and a dwarf shrub, Dryas octopetala (Rosaceae). In contrast, the LSM plot had a persistent and deep winter snowpack, which insulated the soil from cold winter temperatures. It was dominated by low-stature species that have a shorter growing season, such as Carex foetida (Cyperaceae), Alpecurus alpinus (Poaceae), Alchemilla pentaphyllea (Rosaceae), and Salix herbaceae (Salicaceae) (4, 10). The soils of these two plots also differed in clay content (which was higher in the LSM plot) and in organic matter content (which was higher in the ESM plot). The soil pH ranged from ⬃5.5 in the LSM plot to ⬃6.5 in the ESM plot, but the values were inverted in May (55). The following four sampling dates were chosen to measure variations in the microbial communities in relation to snow cover dynamics: 24 June 2005, when the growing season was starting in the ESM plot and the snow was melting in the LSM plot; 10 August 2005, during the time when the amount of standing biomass was largest; 10 October 2005, during litter fall; and 3 May 2006, at the end of winter, just after thawing occurred in the ESM plot and the LSM plot was still under a consistent snowpack that was 2.5 m deep. Five spatial replicates were obtained for each plot on each date and sieved (2 mm) in order to homogenize the soil and remove rocks and the main parts of roots. Clone library construction. Soil DNA extraction was carried out with a Power soil extraction kit (MO BIO Laboratories, Ozyme, St. Quentin en Yvelines, France) as previously described (55), and the DNA extracts from the five spatial replicates for each location were pooled to limit the soil spatial heterogeneity. Moreover, this pooling strategy has been reported to yield a representative fungal molecular signature for the area studied (45), which was confirmed by a preliminary study of spatial replicates using capillary electrophoresis–singlestrand conformation polymorphism analysis (data not shown). From the eight remaining DNA pools, the LSU gene was amplified with primers U1 (5⬘-GTGAAATTGTTGAAAGGGAA-3⬘) (42) and nLSU1221R (5⬘-CTAGATGAACYAACACCTT-3⬘) (43) as described previously (55). A sec-
VOL. 75, 2009
GRAPH PARTITIONING FOR FUNGAL COMMUNITY STUDIES
ond clone library of the ITS1 region was also constructed with primers ITS5 (5⬘-GGAAGTAAAAGTCGTAACAACG-3⬘) and ITS2 (5⬘-GCTGCGTTCTTC ATCGATGC-3⬘) (54) using the PCR conditions reported previously (55) for capillary electrophoresis–single-strand conformation polymorphism analysis. For both LSU and ITS1, eight independent PCR amplifications were performed, and then the preparations were mixed for each of the DNA pools in order to dilute the PCR biases. The 16 PCR products were then cloned using a TOPO TA PCR 2.1 cloning kit (Invitrogen SARL, Molecular Probes, Cergy Pontoise, France), and ligated preparations were sent to the Centre National de Sequenc¸age (Genoscope, Evry, France) for transformation and sequencing. A total of 2,844 and 2,956 sequences were obtained for LSU and ITS1, respectively, and the number of sequences per sample ranged from 350 to 380. Sequence analysis. DNA sequences obtained from the 16 clone libraries were grouped in one data set for each DNA marker. Sequences shorter than 100 bp (ITS1) or 500 bp (LSU) were removed from the analysis to ensure overlap of all sequences. Our data sets contained numerous sequences that were variable in length (incomplete LSU sequences and great size polymorphism of ITS sequences), which prevented us from obtaining reliable alignments using multiple-sequence alignment tools. Thus, we performed pairwise-sequence alignment based on the Free End Gap dynamic programming alignment algorithm (46) and computed similarity matrices using the “borneo” software (available by request at
[email protected]). Based on the similarity matrices, both graphs were subjected to analysis with a single-linkage method, Ccomps (www.graphviz.org), and with the Markov clustering algorithm MCL (49; micans.org) with 95, 97, and 98% similarity thresholds. The main parameter of MCL, inflation, also called granularity, determines the partition sharpness. The parameters of MCL were adjusted with an initial inflation value of 6 and a main iteration value of 100. Graph visualization was obtained using fdp (www.graphviz.org). In order to evaluate the sensitivity of clustering to the chaining effect, we determined the cluster number and cohesion obtained with Ccomps and MCL for the two data sets. Cluster cohesion was assessed as follows: (e/E) ⫻ (n/N), where e is the number of edges observed, E is the maximum number of edges, n is the number of nodes, and N is the total number of nodes in the graph. This formula results in a value between 0 and 1, with 0 meaning that no nodes are connected in the graph and 1 meaning that all nodes are connected. Each DNA sequence was then compared with imported reference sequences from the GenBank database (http://www.ncbi.nlm.nih.gov; accession date, November 2008) using BLAST (2). The best BLAST match was used for sequence identification. Nonmatching or partially matching sequences were considered nonexploitable sequences and thus were not used in subsequent analyses. Because of the ambiguity of the rarest MOTUs (e.g., the MOTUs containing less than five sequences), these MOTUs were not considered in the analysis of the ESM and LSM fungal communities. Based on BLAST results, the congruence of the taxonomic information carried by the LSU and ITS1 markers was checked at the order level by comparing the abundances of fungal orders detected in the two data sets using the nonparametric Kendall tau rank correlation test. This test was also used to compare the abundance rankings of MOTUs for the ESM and LSM fungal communities. Statistical analyses were performed using the R software (40). Nucleotide sequence accession numbers. The GenBank accession numbers for the LSU sequences are FJ568339 to FJ570564, as previously reported (55), and the GenBank accession numbers for the ITS1 sequences are FN293398 to FN295479 (this study).
RESULTS Comparison of Ccomps and MCL clustering methods. Based on similarity matrices obtained from pairwise-sequence alignments, the two clustering methods did not result in the same discretization of MOTUs, as shown in Fig. 1 for a data subset. Indeed, MCL generated more clusters than Ccomps, which was particularly evident for the LSU graph (Table 1), while MCL generated ⬃1.2-fold more MOTUs in the ITS1 graph, resulting in two- to eightfold more LSU MOTUs. In the same way, the number of singletons obtained with MCL was almost constant, while singletons were less numerous and the number of them increased with the similarity threshold when Ccomps was used (Table 1). Finally, the cohesion of MOTUs (the number of edges in one MOTU) was greater for MOTUs
5865
TABLE 1. Comparison of LSU and ITS1 graphs partitioned by Ccomps and MCL using different similarity thresholds DNA region
Clustering method
LSU
Ccomps MCL
ITS1
Ccomps MCL
Clustering performance
Similarity threshold (%)
No. of groupsa
No. of singletonsa
Cohesion index (103, mean ⫾ SD)b
95 97 98 95 97 98 95 97 98 95 97 98
11 34 56 56 111 125 153 191 203 182 207 214
23 63 115 124 133 133 185 227 274 185 227 277
17 ⫾ 33 (5) 3 ⫾ 7 (27) 0.09 ⫾ 0.16 (36) 245 ⫾ 97 (25) 215 ⫾ 116 (48) 248 ⫾ 131 (62) 99 ⫾ 16 (78) 92 ⫾ 16 (89) 99 ⫾ 16 (96) 143 ⫾ 65 (93) 118 ⫾ 54 (97) 1,278 ⫾ 131 (100)
a
The total numbers of sequences were 2,661 for LSU and 2,956 for ITS. The values are based on data for MOTUs containing more than four sequences. The numbers in parentheses are the numbers of MOTUs. b
obtained by MCL (Table 1). Again, the use of MCL increased the cohesion of MOTUs ⬃15-fold for the ITS1 data set, while it resulted in 14- to ⬃2,500-fold more cohesive MOTUs for the LSU data set. Multiple-sequence alignments of each of the clusters obtained from MCL were found to be consistent (data not shown). Distribution of MOTUs in samples. For the distribution analysis, we used the MOTUs composed of at least five sequences (see Materials and Methods). With a threshold level of 98%, MCL analysis resulted in 62 and 100 MOTUs for LSU and ITS1, respectively. Taxonomic identification of DNA sequences by BLAST revealed that only one LSU MOTU (17 clones) and three ITS1 MOTUs (a total of 27 clones) corresponded to nonfungal sequences (stramenophiles or plants). Also, 18 MOTUs from the ITS1 data set that were suspected chimeras or did not match GenBank reference sequences (227 clones) were not used in the subsequent analyses. The remaining MOTUs included 60 MOTUs for LSU and 79 MOTUs for ITS1. At the genus level, while most of the ITS1 sequences displayed the same level of identity in each MOTU, the results were less consistent for the LSU data set (see Tables S1 and S2 in the supplemental material). The congruence of MOTU abundance data between the DNA markers used was then checked by comparing the rank of fungal order (sensu taxonomy) abundance for taxa that were common to both data sets (Fig. 2A). This resulted in a positive correlation supported by the results of a Kendall tau rank correlation test ( ⫽ 0.723 and P ⬍ 0.001 for the ESM plot and ⫽ 0.566 and P ⬍ 0.01 for the LSM plot), which was mostly due to the dominant taxonomic groups. Most MOTUs displayed contrasting abundances across locations (Fig. 2B), which was confirmed by the Kendall tau rank correlation test ( ⫽ ⫺0.202 and P ⬍ 0.05 for LSU and ⫽ ⫺0.399 and P ⬍ 0.001 for ITS1). However, only 9 LSU MOTUs were specific to the ESM location and 16 LSU MOTUs were specific to the LSM location. In addition, 21 ITS1 MOTUs were specific to the ESM location and 17 ITS1 MOTUs were specific to the LSM location. These location-specific MOTUs were rare most of the time. On the other hand, few MOTUs were found to
5866
ZINGER ET AL.
APPL. ENVIRON. MICROBIOL.
FIG. 2. Comparison of MOTU abundance according to the DNA markers and the locations studied. (A) Abundance of MOTUs belonging to common fungal orders for the LSU and ITS1 markers. (B) Abundance of MOTUs for the LSM and ESM locations. The axes are log10 scales. The nonparametric Kendall tau rank correlation coefficient revealed significant correspondence of the abundances of fungal orders for the DNA marker used and negative correspondence of MOTU abundances for the two locations studied.
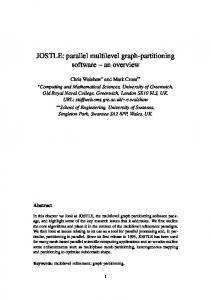
be represented equally at the two locations (Fig. 2B). Because almost 80% of the clones were found to be distributed in 30 MOTUs whatever samples and DNA marker were used, we focused on these MOTUs for further description. Spatial and seasonal variation of abundant MOTUs. (i) LSU data set. Globally, the ESM location had few dominant MOTUs and the majority of MOTUs were rare, except in May, when the MOTUs were more uniformly distributed. Similar to what was observed for the ESM May sample, MOTUs had a uniform distribution at the LSM location (Fig. 3). Nevertheless, this location was noticeably dominated by MOTUs L3 (Helotiales) and L5 (Mortierellaceae) in August and October and by MOTU L23 (Tricholomataceae) in June. At the ESM location, Basidiomycota were found to be, on average, more abundant, and this group was represented mainly by MOTUs L1 (Cortinariaceae), L4 (Cortinariaceae and Russulaceae), and L9 and L10 (Clavulinaceae) as well as by MOTU L3 (Pleosporale and Ascomycota). These MOTUs were for the most part stable during the growing season, except for the Clavulinaceae MOTUs, which appeared to be overrepresented in May. (ii) ITS1 data set. Ascomycota were much less common in the ITS1 data set (Fig. 3). As observed for the LSU data set, the distribution of MOTUs was more uniform at the LSM location. However, several MOTUs displayed time-dependent dominance, including MOTU I3 (Hypocreales) in May, MOTU I6 (mitosporic Ascomycota) in October, MOTUs I4 (Atheliaceae) and I22 (Thelephoraceae) in May, and MOTU I5 (Hygrophoraceae) in June. Unfortunately, a large proportion of LSM MOTUs were not identified. The ESM location was largely dominated by Basidiomycota, particularly by MOTU I1 (Russulaceae) from June to October and by MOTUs I7 (Cortinariaceae) and I2 (Clavulinaceae) in May.
DISCUSSION DNA analysis considerations. DNA sequences can be considered a continuum in which each sequence shares more or fewer similarities with other sequences. To assess the similarities, sequence alignment is a critical step, and numerous and varied tools exist for this purpose. While multiple-sequence alignments can answer phylogenetic questions, they are not appropriate for assessment of the diversity and structure of microbial communities based on DNA barcoding approaches sensu lato (48). In this context, the Free End Gap algorithm is much more appropriate because it is less affected by insertiondeletion events and does not penalize partial DNA sequences, a current feature in large data sets. Comparison of microbial communities across continua is possible by comparing the intracommunity DNA sequence similarity with the intercommunity DNA sequence similarity (53). However, such a comparison does not provide information about the microbial communities themselves. In contrast, artificial discretization of a continuum allows easier comparisons of microbial communities to be made by producing data comparable to the data used for traditional taxonomy-based approaches. In this context, DNA classification is usually assessed by using hierarchical clustering methods (44). However, this approach is not justified since connections between DNA classes are not necessarily required for global characterization of microbial communities. In this context, simple discretization of our continuum is sufficient and can be assessed by graph partitioning methods. Ideally, a graph partitioning method should be able to (i) produce highly cohesive and discrete classes, (ii) detect singletons, and (iii) be efficient in terms of the computation time
VOL. 75, 2009
GRAPH PARTITIONING FOR FUNGAL COMMUNITY STUDIES
5867
FIG. 3. Spatial and temporal distribution of the main MOTUs. (a) LSU data set; (b) ITS data set. The columns indicate the 30 most abundant MOTUs. The lines indicate samples. The size of a square indicates the percentage of clones in the sample. A, Ascomycota; B, Basidiomycota; Z, Zygomycota; U, unclassified fungi.
required to process large data sets. Here, we also tested clustering efficiency with both highly polymorphic (ITS1) and more conserved (LSU) DNA markers. We found that the partitioning of the ITS1 graph resulted in more MOTUs with both clustering methods (Table 1) according to the degree of polymorphism of the two markers studied. Furthermore, conservative DNA regions generated more continuum graph structures than less conserved regions generated. The latter regions are harder to partition, because they are more prone to the chaining effect (Fig. 1). A good partitioning method should thus be able to form discrete classes within the continuum structures. The MCL algorithm has previously been reported to be highly efficient for processing large data sets in a more robust
way (7). Our observations support the performance of MCL, which produced more numerous and cohesive MOTUs than Ccomps, especially for the LSU graph (Table 1 and Fig. 1). This result reflects the ability of MCL to avoid chaining effects in continuum structures. Furthermore, it indicates that the clustering methods can generate erroneous results, as shown by the small number of LSU MOTUs found by Ccomps. In the same way, MCL detected the maximum number of singletons at the lowest similarity thresholds, while Ccomps did not detect the maximum number of singletons at a similarity level of 98% (Table 1). These results show that the clustering method used can affect the assessment of richness and diversity and that MCL is more appropriate for our purposes. Besides, MCL could be used for other conservative DNA regions, such as the
5868
ZINGER ET AL.
16S rRNA gene for analyzing prokaryotic communities. Although this method has been used previously in comparative genomic analyses (29, 52), to our knowledge this is the first time that this algorithm has been used for characterization of microbial communities. Despite the formation of discrete and cohesive clusters, taxonomic assignment of MOTUs, especially for the LSU data set (see Table S1 in the supplemental material), remained problematic for three main reasons. First, a “universal similarity threshold” does not exist and the threshold varies according to the taxonomic family considered and the DNA marker used (6). Second, the taxonomy of fungi is still evolving and can hardly be fixed because of the paraphyletism or uncertainty of the phylogenetic positions of certain fungal groups, such as Helotiales (23) and Russulales (22). Third, the quality of public databases is doubtful; 20% of fungal sequences in international databases may be incorrectly identified at the species level (36). Although the quality is still unknown at higher taxonomic levels, we found, for instance, that Cryptococcus GenBank sequences (Tremellales, Basidiomycota) are annotated as belonging to Tremellales and also to Cystofilobasidiales, Filobasidiales, and the Ascomycota phylum. Although the abundance values for fungal orders were found to be quite similar for the LSU and ITS1 data sets (Fig. 2A), the use of taxonomy as a criterion for DNA classification is a doubtful strategy in this framework, and thus DNA classification should be based instead on sequence similarities. Moreover, taxonomic assignment of MOTUs and subsequent ecological conclusions should be made carefully. Thus, the use of a graph partitioning approach based on pairwise-sequence alignment and coupled with MCL clustering seems a good alternative for analyzing large DNA sequence data sets obtained using pyrosequencing techniques, since it avoids recurrent issues of “manual corrections” of multiplesequence alignments and the reference database errors. Although this method does not explain the evolutionary connection between MOTUs, it allows assessment of microbial community structure, richness, and diversity and may also be a first filtration step for creating more homogeneous data subsets for further phylogenetic studies, as suggested by Loytynoja and Goldman (32). Phylotype diversity in ESM and LSM soils. The fungal communities at both locations studied contained few dominant MOTUs and numerous rare MOTUs (Fig. 2B). For instance, the 10 most abundant MOTUs accounted for 40 to 90% of each clone library, similar to what is typically observed in macroorganism communities (20, 24). Interestingly, at the ESM location there were fewer highly dominant MOTUs than at the LSM location, supporting our previous findings obtained with classical approaches (e.g., multiple alignments, complete linkage) showing that the diversity of fungal communities was higher at LSM locations (55). Although our study locations were spatially close, the differences in snow cover dynamics, vegetation type, soil properties, and ecosystem processes were substantial (4), and these factors varied with the microbial communities (55). These differences significantly affected the distribution of MOTUs irrespective of the DNA marker used (Fig. 2B and 3). However, only a few MOTUs were strictly specific to one location or one season. Rather, the differences in fungal communities between the two
APPL. ENVIRON. MICROBIOL.
locations were expressed in terms of abundance (Fig. 3). Most of the site-specific MOTUs were rare, and our sequencing effort may not have been sufficient to detect them at both locations. The lack of MOTU specificity is quite surprising because ESM and LSM areas have dramatic differences in plant species composition that could recruit specific mycorrhizal fungi. Thus, Cripps et al. (11) reported patchy distribution of mycorrhizal fungi that mirrored the vegetation mosaic in alpine tundra. The feature observed here could be explained by the high rate of dispersal of these organisms (16) and the short distance between the locations studied, as previously observed for freshwater bacterial communities (15). On the other hand, our results may indicate a lack of taxonomic resolution with the DNA markers used. On the other hand, as suggested by the Kendall tau correlation test, the abundant MOTUs at the LSM location were quite rare at the ESM location and vice versa (Fig. 2B and 3), suggesting that contrasting environmental conditions filter contrasting fungal communities. Indeed, the ESM location represents a stressful and nutrient-limited habitat (10). This location was dominated by phylotypes related to ectomycorrhizal fungi (e.g., Cortinariaceae, Russulaceae, and Helotiales) (Fig. 3) often associated with the plants K. myosuroides and D. octopetala dominant at ESM locations (18, 34, 43) and to Pleosporales, previously described as dark septate fungi strongly involved in nitrogen translocation in alpine grasslands (19, 38). These dominance patterns were stable from spring to autumn, suggesting that the fungi shift along a parasitismmutualism continuum through both saprotrophic activities and nutrient uptake capacities (26, 33). In late winter, these fungal groups were replaced by presumably psychrotolerant Cantharellales (Fig. 3), which are known to form ectomycorrhizal associations (47) and for their lignin degradation abilities (9). At the ESM location, the dominance of ectomycorrhizal associations and phylotypes related to fungal species able to degrade complex organic matter was comparable to the dominance that occurs in ecosystems with slow nutrient turnover (8). In contrast, at the LSM location the litter degradation rate is high and the nutrient availability is high (3a). LSM fungal communities appeared to be more temporally variable and more diversified with an important component of poorly documented fungal groups, which precluded further conclusions (Fig. 3). However, the higher diversity is potentially related to higher nutrient availability (51) and has been associated with open nutrient cycle ecosystems (8). This study shows that use of a pairwise-sequence alignment algorithm coupled with efficient MCL clustering is a reliable technique for analyzing large data sets for microbial community studies. This is particularly useful given the increasing availability of massive sequencing methods. Moreover, the observed difference between the clustering methods tested also indicates that there should be more thorough consideration of the tools employed for definition of MOTUs in microbial ecology. Applied to the soil fungal communities of two contrasting alpine habitats, our analysis confirmed the importance of habitat filtering in the assembly of fungal communities, but further characterization combining traditional approaches coupled with meta-transcriptomics is needed to determine the mycorrhizal, pathogen or saprophytic status of the MOTUs described here.
VOL. 75, 2009
GRAPH PARTITIONING FOR FUNGAL COMMUNITY STUDIES ACKNOWLEDGMENTS
We thank Christelle Melodelima for helpful discussions and David Lejon for comments on an early draft of the manuscript. We also thank Serge Aubert and the staff of Station Alpine J. Fourier for providing logistic facilities during the field work and Alice Roy and the Centre National de Se´quenc¸age (Genoscope, Evry) for sequencing clone libraries. This work was supported by “Microalpes” project ANR-06-BLAN0301. REFERENCES 1. Allen, E. B., M. F. Allen, D. J. Helm, J. M. Trappe, R. Molina, and E. Rincon. 1995. Patterns and regulation of mycorrhizal plant and fungal diversity. Plant Soil 170:47–62. 2. Altschul, S. F., W. Gish, W. Miller, E. W. Myers, and D. J. Lipman. 1990. Basic local alignment search tool. J. Mol. Biol. 215:403–410. 3. Augustson, J. G., and J. Minker. 1970. An analysis of some graph theoretical cluster techniques. J. ACM 17:571–588. 3a.Baptist, F., N. G. Yoccoz, and P. Choler. Direct and indirect snow cover control over decomposition in alpine tundra along a snowmelt gradient. Plant Soil, in press. 4. Baptist, F., and P. Choler. 2008. A simulation of the importance of length of growing season and canopy functional properties on the seasonal gross primary production of temperate alpine meadows. Ann. Bot. 101:549–559. 5. Bjork, R. G., M. P. Bjorkman, M. X. Andersson, and L. Klemedtsson. 2008. Temporal variation in soil microbial communities in alpine tundra. Soil Biol. Biochem. 40:266–268. 6. Bridge, P., and B. Spooner. 2001. Soil fungi: diversity and detection. Plant Soil 232:147–154. 7. Brohee, S., and J. Van Helden. 2006. Evaluation of clustering algorithms for protein-protein interaction networks. BMC Bioinformatics. 7:488. 8. Chapman, S. K., J. A. Langley, S. C. Hart, and G. W. Koch. 2006. Plants actively control nitrogen cycling: uncorking the microbial bottleneck. New Phytol. 169:27–34. 9. Chen, D. M., A. F. S. Taylor, R. M. Burke, and J. W. G. Cairney. 2001. Identification of genes for lignin peroxidases and manganese peroxidases in ectomycorrhizal fungi. New Phytol. 152:151–158. 10. Choler, P. 2005. Consistent shifts in alpine plant traits along a mesotopographical gradient. Arct. Antarct. Alp. Res. 37:444–453. 11. Cripps, C. L., and L. H. Eddington. 2005. Distribution of mycorrhizal types among alpine vascular plant families on the Beartooth Plateau, rocky mountains, USA, in reference to large-scale patterns in arctic-alpine habitats. Arct. Antarct. Alp. Res. 37:177–188. 12. Edwards, A. C., R. Scalenghe, and M. Freppaz. 2007. Changes in the seasonal snow cover of alpine regions and its effect on soil processes: a review. Quat. Int. 162:172–181. 13. Enright, A. J., S. Van Dongen, and C. A. Ouzounis. 2002. An efficient algorithm for large-scale detection of protein families. Nucleic Acids Res. 30:1575–1584. 14. Ettema, C. H., and D. A. Wardle. 2002. Spatial soil ecology. Trends Ecol. Evol. 17:177–183. 15. Fierer, N., J. L. Morse, S. T. Berthrong, E. S. Bernhardt, and R. B. Jackson. 2007. Environmental controls on the landscape-scale biogeography of stream bacterial communities. Ecology 88:2162–2173. 16. Finlay, B. J. 2002. Global dispersal of free-living microbial eukaryote species. Science 296:1061–1063. 17. Finlay, R. D. 2008. Ecological aspects of mycorrhizal symbiosis: with special emphasis on the functional diversity of interactions involving the extraradical mycelium. J. Exp. Bot. 59:1115–1126. 18. Gardes, M., and A. Dahlberg. 1996. Mycorrhizal diversity in arctic and alpine tundra: an open question. New Phytol. 133:147–157. 19. Green, L. E., A. Porras-Alfaro, and R. L. Sinsabaugh. 2008. Translocation of nitrogen and carbon integrates biotic crust and grass production in desert grassland. J. Ecol. 96:1076–1085. 20. Grime, J. P. 1998. Benefits of plant diversity to ecosystems: immediate, filter and founder effects. J. Ecol. 86:902–910. 21. Hattenschwiler, S., A. V. Tiunov, and S. Scheu. 2005. Biodiversity and litter decomposition interrestrial ecosystems. Annu. Rev. Ecol. Evol. Syst. 36:191– 218. 22. Hibbett, D. S. 2006. A phylogenetic overview of the Agaricomycotina. Mycologia 98:917–925. 23. Hibbett, D. S., M. Binder, J. F. Bischoff, M. Blackwell, P. F. Cannon, O. E. Eriksson, S. Huhndorf, T. James, P. M. Kirk, R. Lucking, H. T. Lumbsch, F. Lutzoni, P. B. Matheny, D. J. McLaughlin, M. J. Powell, S. Redhead, C. L. Schoch, J. W. Spatafora, J. A. Stalpers, R. Vilgalys, M. C. Aime, A. Aptroot, R. Bauer, D. Begerow, G. L. Benny, L. A. Castlebury, P. W. Crous, Y. C. Dai, W. Gams, D. M. Geiser, G. W. Griffith, C. Gueidan, D. L. Hawksworth, G. Hestmark, K. Hosaka, R. A. Humber, K. D. Hyde, J. E. Ironside, U. Koljalg, C. P. Kurtzman, K. H. Larsson, R. Lichtwardt, J. Longcore, J. Miadlikowska, A. Miller, J. M. Moncalvo, S. Mozley-Standridge, F. Oberwinkler,
24.
25.
26.
27.
28. 29.
30.
31.
32.
33. 34. 35.
36.
37.
38.
39.
40. 41. 42. 43.
44.
45.
46. 47.
48.
5869
E. Parmasto, V. Reeb, J. D. Rogers, C. Roux, L. Ryvarden, J. P. Sampaio, A. Schussler, J. Sugiyama, R. G. Thorn, L. Tibell, W. A. Untereiner, C. Walker, Z. Wang, A. Weir, M. Weiss, M. M. White, K. Winka, Y. J. Yao, and N. Zhang. 2007. A higher-level phylogenetic classification of the Fungi. Mycol. Res. 111:509–547. Hughes, J. B., J. J. Hellmann, T. H. Ricketts, and B. J. M. Bohannan. 2001. Counting the uncountable: statistical approaches to estimating microbial diversity. Appl. Environ. Microbiol. 67:4399–4406. Hur, I., and J. Chun. 2004. A method for comparing multiple bacterial community structures from 16S rDNA clone library sequences. J. Microbiol. 42:9–13. Johnson, N. C., J. H. Graham, and F. A. Smith. 1997. Functioning of mycorrhizal associations along the mutualism-parasitism continuum. New Phytol. 135:575–586. Kasel, S., L. T. Bennett, and J. Tibbits. 2008. Land use influences soil fungal community composition across central Victoria, south-eastern Australia. Soil Biol. Biochem. 40:1724–1732. Ko ¨rner, C. 1999. Alpine plant life. Springer Verlag, Berlin, Germany. Krogan, N. J., G. Cagney, H. Yu, G. Zhong, X. Guo, A. Ignatchenko, J. Li, S. ˜ n-Alvarez, M. Shales, Pu, N. Datta, A. P. Tikuisis, T. Punna, J. M. PeregrA X. Zhang, M. Davey, M. D. Robinson, A. Paccanaro, J. E. Bray, A. Sheung, B. Beattie, D. P. Richards, V. Canadien, A. Lalev, F. Mena, P. Wong, A. Starostine, M. M. Canete, J. Vlasblom, S. Wu, C. Orsi, S. R. Collins, S. Chandran, R. Haw, J. J. Rilstone, K. Gandi, N. J. Thompson, G. Musso, P. St Onge, S. Ghanny, M. H. Y. Lam, G. Butland, A. M. Altaf-Ul, S. Kanaya, A. Shilatifard, E. O’Shea, J. S. Weissman, C. J. Ingles, T. R. Hughes, J. Parkinson, M. Gerstein, S. J. Wodak, A. Emili, and J. F. Greenblatt. 2006. Global landscape of protein complexes in the yeast Saccharomyces cerevisiae. Nature 440:637. Lauber, C. L., M. S. Strickland, M. A. Bradford, and N. Fierer. 2008. The influence of soil properties on the structure of bacterial and fungal communities across land-use types. Soil Biol. Biochem. 40:2407–2415. Litaor, M. I., T. R. Seastedt, and D. A. Walker. 2001. Spatial analysis of selected soil attributes across an alpine topographic/snow gradient. Landsc. Ecol. 17:71–85. Loytynoja, A., and N. Goldman. 2008. Phylogeny-aware gap placement prevents errors in sequence alignment and evolutionary analysis. Science 320: 1632–1635. Martin, F., and M. A. Selosse. 2008. The Laccaria genome: a symbiont blueprint decoded. New Phytol. 180:296–310. Muhlmann, O., and U. Peintner. 2008. Ectomycorrhiza of Kobresia myosuroides at a primary successional glacier forefront. Mycorrhiza 18:355–362. Needleman, S. B., and C. D. Wunsch. 1970. A general method applicable to the search for similarities in the amino acid sequence of two proteins. J. Mol. Biol. 48:443–453. Nilsson, R. H., M. Ryberg, E. Kristiansson, K. Abarenkov, K.-H. Larsson, and U. Ko ˜ljalg. 2006. Taxonomic reliability of DNA sequences in public sequence databases: a fungal perspective. PLoS ONE 1:e59. O’Brien, H. E., J. L. Parrent, J. A. Jackson, J.-M. Moncalvo, and R. Vilgalys. 2005. Fungal community analysis by large-scale sequencing of environmental samples. Appl. Environ. Microbiol. 71:5544–5550. Porras-Alfaro, A., J. Herrera, R. L. Sinsabaugh, K. J. Odenbach, T. Lowrey, and D. O. Natvig. 2008. Novel root fungal consortium associated with a dominant desert grass. Appl. Environ. Microbiol. 74:2805–2813. Porter, T. M., J. E. Skillman, and J. M. Moncalvo. 2008. Fruiting body and soil rDNA sampling detects complementary assemblage of Agaricomycotina (Basidiomycota, Fungi) in a hemlock-dominated forest plot in southern Ontario. Mol. Ecol. 17:3037–3050. R Development Core Team. 2007. R: a language and environment for statistical computing. R Development Core Team, Vienna, Austria. Read, D. J., and K. Haselwandter. 1981. Observations on the mycorrhizal status of some alpine plant communities. New Phytol. 88:341–352. Sandhu, G. S., B. C. Kline, L. Stockman, and G. D. Roberts. 1995. Molecular probes for diagnosis of fungal infections. J. Clin. Microbiol. 33:2913–2919. Schadt, C. W., A. P. Martin, D. A. Lipson, and S. K. Schmidt. 2003. Seasonal dynamics of previously unknown fungal lineages in tundra soils. Science 301:1359–1361. Schloss, P. D., and J. Handelsman. 2005. Introducing DOTUR, a computer program for defining operational taxonomic units and estimating species richness. Appl. Environ. Microbiol. 71:1501–1506. Schwarzenbach, K., J. Enkerli, and F. Widmer. 2007. Objective criteria to assess representativity of soil fungal community profiles. J. Microbiol. Methods 68:358–366. Sellers, P. H. 1974. On the theory and computation of evolutionary distances. SIAM J. Appl. Math. 26:787–793. Tedersoo, L., T. Jairus, B. M. Horton, K. Abarenkov, T. Suvi, I. Saar, and U. Koljalg. 2008. Strong host preference of ectomycorrhizal fungi in a Tasmanian wet sclerophyll forest as revealed by DNA barcoding and taxon-specific primers. New Phytol. 180:479–490. Valentini, A., F. Pompanon, and P. Taberlet. 2009. DNA barcoding for ecologists. Trends Ecol. Evol. 24:110.
5870
ZINGER ET AL.
49. Van Dongen, S. 2000. Graph clustering by flow simulation. University of Utrecht, Utrecht, The Netherlands. 50. Venter, J. C., K. Remington, J. F. Heidelberg, A. L. Halpern, D. Rusch, J. A. Eisen, D. Y. Wu, I. Paulsen, K. E. Nelson, W. Nelson, D. E. Fouts, S. Levy, A. H. Knap, M. W. Lomas, K. Nealson, O. White, J. Peterson, J. Hoffman, R. Parsons, H. Baden-Tillson, C. Pfannkoch, Y. H. Rogers, and H. O. Smith. 2004. Environmental genome shotgun sequencing of the Sargasso Sea. Science 304:66–74. 51. Waldrop, M. P., D. R. Zak, C. B. Blackwood, C. D. Curtis, and D. Tilman. 2006. Resource availability controls fungal diversity across a plant diversity gradient. Ecol. Lett. 9:1127–1135. 52. Wall, P. K., J. Leebens-Mack, K. F. Muller, D. Field, N. S. Altman, and C. W.
APPL. ENVIRON. MICROBIOL. dePamphilis. 2008. PlantTribes: a gene and gene family resource for comparative genomics in plants. Nucleic Acids Res. 36:D970–D976. 53. Webb, C. O., D. D. Ackerly, M. A. McPeek, and M. J. Donoghue. 2002. Phylogenies and community ecology. Annu. Rev. Ecol. Syst. 33:475. 54. White, T. J., T. Bruns, S. Lee, and J. Taylor. 1990. Amplification and direct sequencing of fungal ribosomal RNA genes for phylogenetics, p. 315–322. In M. A. Innis, D. H. Gelfand, J. J. Sninsky, and T. J. White (ed.), PCR protocols: a guide to methods and applications. Academic Press, San Diego, CA. 55. Zinger, L., B. Shanhavaz, F. Baptist, R. A. Geremia, and P. Choler. 2009. Microbial diversity in alpine tundra soils correlates with snow cover dynamics. ISME J. 3:850–859.