Figure 2-3: Grasshopper canvas superimposed on Rhino window, with a definition and its live geometrical ...... Retrieved from http://eprints.iat.sfu.ca/930/ ...
DIPLOMARBEIT
ASSESSMENT OF USABILITY AND USEFULNESS OF NEW BUILDING PERFORMANCE SIMULATION TOOLS IN THE ARCHITECTURAL DESIGN PROCESS unter der Leitung von Univ.-Prof. Dipl.-Ing. Dr. techn. Ardeshir Mahdavi E 259-3 Abteilung für Bauphysik und Bauökologie Institut für Architekturwissenschaften
eingereicht an der Technischen Universität Wien Fakultät für Architektur und Raumplanung
von
Ehsan Bazafkan Matrikelnr. 1328484
Wien, October 2017
KURZFASSUNG Simulationswerkzeuge spielen in den letzten Jahren eine immer wichtigere Rolle in Entwurf und Planung von hochperformanten Bauwerken. Trotz dieser Entwicklung werden diese Building Performance Simulation (BPS) Werkzeuge zumeist erst in späten Phasen der Ausgestaltung eingesetzt, wo es zumeist nicht mehr möglich ist, fundamentale Änderungen am Bauwerksentwurf vorzunehmen. Der verstärkte Einsatz von parametrischen Design-Methoden und dazugehörigen Werkzeugen, sowie die Verbindung dieser Werkzeuge mit Simulationswerkzeugen kann in diesem Kontext als Chance verstanden werden. Es ist denkbar, dass mittels dieser Techniken ein "Pre-Reasoning" statt einer "Post-Optimierung" im Entwurfsprozess eingebracht werden kann, das zu besseren Resultaten führen könnte. Obwohl es zahlreiche Publikationen zu diesen neuen Werkzeugen gibt, ist der Kenntnissstand hinsichtlich "Usability" und "Usefullness" dieser Werkzeuge noch sehr beschränkt. Die vorliegende Master-These befasst sich mit dieser Wissenslücke zwischen theoretischen Möglichkeiten und praktischen Methodologien in diesem Bereich. Zwei Werkzeuge, Ladybug und Honeybee, die beide Building Performance Simulations Umgebungen für das weit verbreitete CAD-Werkzeug Rhino sind, wurden
hierzu
zur
Beantwortung von typischen Design-Entscheidungen im
Entwurfsprozess, die an "Real-Welt" Projekte angelehnt sind, verwendet. Dabei wurde die Methodik der Anwendung genau dokumentiert und dann analysiert. Als Schlussfolgerung aus diesem Prozess kann abgeleitet werden, dass die beiden Werkzeuge und ihre parametrische Natur grundsätzlich sehr gut dazu geeignet sind als
effiziente
Entscheidungsunterstützung
für
Design
und
Optimierung
im
Baubereich zu dienen. Allerdings erscheint die Anwendung dieser Werkzeuge für Routine-Simulationen nur bedingt sinnvoll, da die Interfaces und zu Grunde liegenden Eingabe- und Modifikationsprozesse für due Designdomäne optimiert sind und weniger für Simulationszwecke gestaltet wurden. Nichts desto trotz erscheint eine
Verwendung
Architekturausbildung
von auch
den für
genannten Zwecke
Werkzeugen der
im
Bereich
der
Performance-Evaluierung
von
Gebäudeentwürfen gerade in frühen Phasen sinnvoll. Schlüsselwörter:
Gebäude-Performance-Simulation,
Parametrisches
Grasshopper, Ladybug, Honeybee, Architektonisches Design-Verfahren
Design,
ABSTRACT Simulation tools play a major role in the design of high-performance buildings. Despite that, use of building performance simulation (BPS) tools is mainly limited to later design stages, where it is too late to introduce substantial passive improvements. However, the emergence of the discourse of parametric design, and its conjunction with building performance simulation shows promises to provide architects with versatile tools focused on pre-rationalisation of forms instead of postoptimization. However, despite an abundance of literature advocating this new possibility, academic research on actual Usability and Usefulness of parametric simulation tools for architects is missing. The current research intends to address this gap through a combination of theoretical discussion and practical methodology. Ladybug
and
Honeybee,
two
building
performance
simulation
plugins for
Grasshopper, were used for making design decisions informed by performance within the context of scenarios that mimic real-world architectural design problems. The application of the plugins was precisely documented and analysed. The research concludes that while Ladybug and Honeybee’s parametric nature and adept visualisations provide architects with effective support in design, evaluation and optimisation of architectural forms, they are not quite usable for performing routine simulations, due to their unfamiliar interface and complex underlying mechanisms. Nonetheless, the research advocates for the more widespread use of Ladybug and Honeybee in architecture schools and select design projects in the professional sector.
Keywords: Building performance simulation, Parametric design, Grasshopper, Ladybug, Honeybee, Architectural design process
ACKNOWLEDGEMENTS I want to express my sincerest gratitude to Professor Ardeshir Mahdavi and Dr. Ulrich Pont for their valuable insights and support before and during writing this thesis. And to my family: You are simply the best. Thank you!
CONTENTS 1
Introduction ........................................................................................................... 1 1.1
Overview ........................................................................................................ 1
1.2
Motivation ...................................................................................................... 2
1.3
Background.................................................................................................... 3
1.3.1
Overview................................................................................................. 3
1.3.2
Performance-based Design ................................................................... 3
1.3.3
Building Performance Simulation and architectural design process ..... 4
1.3.4
Parametric design and performance-based Design .............................. 5
1.4
Research Methodology.................................................................................. 7
1.4.1
Research Hypothesis ............................................................................. 7
1.4.2
Research methodology .......................................................................... 8
1.4.3
Evaluation Criteria .................................................................................. 9
1.4.3.1.
Usability: What is expected of user interface? ................................... 9
1.4.3.2.
Usefulness: What is expected of an 'Architect-friendly' performance
simulation tool? ................................................................................................... 10 1.4.3.2.1.
Usability and information management (UIM) of interface........... 11
1.4.3.2.2.
Integration of intelligent design knowledge-base (IIKB)............... 11
1.4.3.3.
Accuracy of tools and ability to simulate detailed and complex
building components (AADCC) .......................................................................... 11 1.4.3.3.1.
Interoperability of building modelling (IBM) .................................. 13
1.4.3.3.2.
Integration of tools in building design process (IBDP) ................. 13
1.4.3.4. 2
Summary of Usability and Usefulness assessment criteria ............. 13
Grasshopper/Ladybug and Honeybee and performance simulation ................. 16 2.1.1
Overview............................................................................................... 16
2.1.2
What is Grasshopper? ......................................................................... 16
2.1.3
Why Grasshopper? .............................................................................. 17
2.1.4
Parametric modelling in Grasshopper: General concepts................... 18
2.1.5
Building performance simulation in Grasshopper................................ 23
2.1.6
Ladybug ................................................................................................ 25
2.1.7 3
4
Honeybee ............................................................................................. 28
Design scenarios ................................................................................................ 32 3.1.1
Overview............................................................................................... 32
3.1.2
Design Scenario I ................................................................................. 33
3.1.3
Design scenario II ................................................................................ 37
3.1.4
Design scenario III ............................................................................... 43
3.1.5
Design scenario IV ............................................................................... 50
Discussion........................................................................................................... 55 4.1
Overview ...................................................................................................... 55
4.2
Usability ....................................................................................................... 55
4.3
Intelligent design knowledge-base .............................................................. 62
4.4
Accuracy and ability..................................................................................... 64
4.5
Interoperability ............................................................................................. 66
4.6
Integration into building design process...................................................... 67
4.7
Summary of criteria’s assessments ............................................................ 68
4.8
Analysis of assessment’s findings............................................................... 70
5
Conclusion and recommendations ..................................................................... 72
6
Index ................................................................................................................... 74
7
6.1
List of Figures .............................................................................................. 74
6.2
List of Tables ............................................................................................... 76
Literature ............................................................................................................. 77
INTRODUCTION
1
INTRODUCTION
1.1
Overview
In the era of climate change and competitive markets, architects face an enormous challenge: to design buildings that are both efficient and comfortable. Buildings are among the most significant contributors to atmospheric emissions and resource depletion, and the housing sector is responsible for consuming a significant share of generated energy globally (Hong et al. 2000). This challenge emphasises the importance of role high-performance buildings can play in our collective struggle against irreversible ecological changes. To tackle excessive energy consumption in buildings, while assuring an acceptable degree of comfort for users, adopting a multi-disciplinary
discourse
in
building
design
seems inevitable.
Therefore,
architects are increasingly seeking inspirations and adapting innovations from other fields like engineering, advanced computing, and building science. Building performance is gaining importance in architecture profession, as an integrated design strategy that encompasses both ecological considerations and comfort simultaneously (Hensen et al. 2011). Building performance simulation is regarded as an integral part of the quest for designing a high-performance building, especially in supporting alternative design evolutions, which are essential to the process of improving efficiency (Attia et al. 2012, Augenbroe 2011). This thesis targets new trends in building design and simulation, namely parametric design and simulation plugins Ladybug and Honeybee for Grasshopper/Rhino (Robert McNeel & Associates 2016). Usability of selected software in the architectural design process will be assessed through the practice of parametricbased energy and Daylighting simulation in real-world design scenarios. As a secondary, but equally important theme, the relation between parametric design, performance-based design and simulation software will be studied. The current chapter, Introduction, explains the motivation for choosing this topic, and then moves forward to a literature review in the Background section. Research methodology is described fully in the final section. The second chapter offers detailed information on parametric design and modelling, Grasshopper (Rutten 2014) features, ecosystem and workflow, and how to perform energy and Daylight simulation in Ladybug and Honeybee. The third chapter documents actual use of Ladybug and Honeybee (Roudsari et al. 2013) in carefully selected design scenarios. A thorough evaluation of usability and usefulness of selected software in the architectural design process is the concern of the fifth chapter. Finally, 1
INTRODUCTION concluding comments, recommendations for both users and developers of parametric building performance simulation (BPS) software and prospects for future research all can be found in the sixth chapter of this thesis.
1.2
Motivation
As one-third of total annual energy consumption happens in buildings, it is estimated that substantial energy savings can be made through careful planning of energy efficiency (Hong et al. 2000). BPS software can help architects design more efficient buildings if appropriately used and timely (Attia et al. 2012, Augenbroe 2011). While it is widely argued that the usage of BPS software in the design process should start in early stages of design (Negendahl 2015), their actual usage is limited to later stages, when it is already too late to introduce significant formal modifications based on simulation outcomes. In the current practice of architectural design, issues of form and performance are separated chronologically. BPS tools are usually employed “without affecting the architectural form and without being used directly as morphogenetic agents in the process of form generation” (Anton and Tănase 2016, p. 10). This shortcoming renders usage of BPS software in design process practically ineffective. Therefore, despite all potentials of BPS tools for delivering high-performance buildings through informing architectural design, their actual use is mostly limited to checking compliance with standards and regulations, achieving marketing
targets
like obtaining ‘environmentally friendly’ labels, and small
optimisations and non-formal decisions in final stages of design (de Souza 2009). Parametric modelling claims to offer a bridge between form and performance in the architectural design process by offering innovations in both tools and process of design (Toth et al. 2011). Already an influential discourse inside architectural design (Schumacher 2009, 2016), parametric modelling aims to level the field between different agents in architectural design process from the very conception of design idea, prioritizing pre-rationalization instead of prevailing post-optimization approach that has plagued proper usage of BPS software in architectural design (Anton and Tănase 2016). The motivation for the selected topic of this thesis is to evaluate the claim mentioned above. Due to the novelty of parametric design, and its dependence on intensive scripting in its early forms, the convergence of performance and form through parametric design has been somewhat ignored in academic circles (Toth et al. 2011). However, the landscape of parametric design has been under constant change, and today, with many visual tools being introduced to the market in the last 2
INTRODUCTION few years, architectural education should embrace the opportunity to adopt alternative approaches to both design and simulation of building performance. As the parametric design is regarded as the future of architectural design by many (Reas et al. 2010), the imperative here is to assess its relation with building performance through a coherent methodology.
1.3
Background
1.3.1
Overview
Three central themes dominating literature review for this thesis are as follows: Performance-based design and simulation, Building Performance Simulation and architectural design process, and parametric design and its connection to Performance-based design.
1.3.2
Performance-based Design
It is now widely discussed that buildings play a significant role in energy consumption and resource depletion (Anderson 2014, Hong et al. 2000, PérezLombard et al. 2008, Santamouris 2013). To address that, European Union has issued a strict 20-20-20 initiative, that is a %20 reduction in energy consumption and emission, and %20 increase in renewable energy by 2020, compared to 1999 (The European Parliament and The Council of The European Union 2010). Other regions also boost similar initiatives. To achieve ambitious targets of such initiatives, it is necessary to build more energy-efficient buildings, which are also at the same time more comfortable and healthy. As studies have proven, there is a direct link between human health (both physiological and psychological) and quality of the indoor built environment (Fisk 2000), and a delicate balance between energy performance and user’s comfort must be observed in the design of buildings. The term ‘High-performance Building’ has been coined to address this new demand in design and construction (Hensen and Lamberts 2011). The growing focus on buildings’ performance is mainly driven by the need for more resilience in our built environment. Proponents of this new design discourse argue that performance is as important as aesthetics/form (Reas et al. 2010). To elevate performance to truly effective force in the design process, it should be considered as a morphogenetic agent among other equal morphogenetic agents from the very beginning of design process, and not just as merely a condition of form in later stages (Here, a morphogenetic agent is considered as an element of design that is capable of influencing form of the building. Traditionally influential morphogenetic agents are 3
INTRODUCTION aesthetic considerations, structure, function and so on). Rivka Oxman, an architect who has coined the term ‘Performative Design’, argues that in order to embrace performance fully in architectural design, it is necessary to go beyond the current tradition of associating performance-intensive elements of design only to evaluative phases of design process (‘Generate then test’), to prioritize performance and introduce it in the synthesis of form (Oxman 2009). This integrated model for supporting form-generation directly through analytical processes (in contrast to the conventional
repetitive
design
process
of
‘synthesis-analysis-evaluation’)
is
championed and elaborated in many research (Hensel 2010, 2013, Oxman 2008, Shi 2010). One common characteristic among the majority of research done on performance-based design is that this new discourse is strongly linked to recent advances in architectural computing, simulation and parametric design (Oxman 2009).
1.3.3
Building Performance Simulation and architectural design process
Computer simulation software is essential tools in achieving high-performance buildings, not only because of their computational power, speed and precision but also because they can handle many different domains of architectural design altogether and simultaneously (Augenbroe 2011, Hensen and Lamberts 2011). The ability to approach building design as a whole, and not just the sum of isolated systems, is essential to deliver high-performance buildings. Computer simulation software allow for effective rationalization and optimization of building’s form and construction,
user’s
needs,
equipment,
mechanical
systems,
environmental
elements, and their dynamic interactions in the building context, with a level of precision and reliability that is hard to achieve in analog traditions (Hensen et al. 2004, Negendahl 2015). Thus, not surprisingly, BPS tools have gradually become an indispensable
tool
for
supporting design decisions that affect building
performance (Anderson 2014, Attia et al. 2012, Negendahl 2015). The literature on the use of BPS tools in architectural design is quite extensive. One common theme among most of the reviewed research is shortcomings of mainstream BPS tools when it comes to specific needs of architects during early design stages, where the most influential decisions are made in the sense of performance (Hemsath 2013, Negendahl 2015, Weytjens and Verbeeck 2010). Therefore, actual use of BPS software in practice has remained limited in scope and effectiveness. Some reasons have been offered as to explain these shortcomings and to provide a more effective framework for the use of BPS tools in the design 4
INTRODUCTION process. Hensen and colleagues demonstrate that program interoperability, the absence of comprehensive yet comprehensible simulation packages, and tradition of introducing simulation in final stages of design are among the main reasons for the ineffectiveness of BPS tools to support design decision making (Hensen et al. 2004; Hensen 2004). Weytjens et al. have discussed the importance and characteristics of “Architect-friendly” BPS software, as a solution to beforementioned shortcomings. They conclude that mainstream BPS tools are too timeconsuming to be competitive, they need too much non-spatial input, and they demand skills an average architect lacks (Weytjens and Verbeeck 2010). Architects need simulation tools that can support their early design decisions, such as feasibility studies, conceptual design evaluations, generating and comparing design alternatives, and aiding designers in assessing building systems (Hensen et al. 2004, Negendahl 2015). Building designers prefer to create and explore design options in more “architect-friendly” software, like Sketchup, Revit and Rhino. Without efficient program interoperability, it is up to software users to either manually remodel the building in a dedicated BPS tool or to use offline import/export features, a time-consuming and exhaustive process that discourages architects from using simulation in the design process
(Negendahl 2015). De Souza points out to the
mostly numerical output of mainstream BPS tools, which need much processing before architects can interpret them. She advocates for real-time visual performance feedback right inside the design environment (de Souza 2009). Attia et al. (2012) provide a comprehensive evaluative framework for what constitutes an “Architectfriendly” BPS tool. They offer five criteria for future BPS tools: Interoperability, Usability, Accuracy and ability to simulate complex forms, Integration of intelligent design, and Integration into building design environment. Finally, Anderson (2014) outlines the importance of design alternatives and visual feedback. He argues that the ability to generate, compare and optimise design options from the beginning stages is essential for achieving better results. Therefore, he indirectly identifies potentials of parametric design regarding building performance.
1.3.4
Parametric design and performance-based Design
Parametric design, despite its recent emergence, is examined in an abundant of research. Though most of earlier publications on parametric design concerned themselves with impressive form generation abilities of this new discourse, more recent publications by some of pioneers and advocates of parametric design address the issue of performance as well. Patrick Schumacher has updated his famous manifesto on parametric design, Parametricism – A New Global Style for 5
INTRODUCTION Architecture and Urban Design, to include environmental issues and performancebased design in Parametricism 2.0 - Rethinking Architecture's Agenda for the 21st Century (Schumacher 2009, 2016). Architects like Rivka Oxman and Brank Kolarevic has written extensively on the link between parametric and generative design and performance-based design (Kolarevic 2001, Oxman 2008, 2009). Convergence, an essential concept in parametric design, is explained by MaléAlemany and Sousa as a method of bringing together all elements of design together in a level playing field dynamically and simultaneously, removing the limiting hierarchy of form generation and allowing performance to influence form from the very beginning in design process (Malé-Alemany and Sousa 2003). Convergence allows for the design to act in a genuinely responsive manner, addressing a broad range of constraints within a complex context, which is constituted of “environmental conditions, social and cultural considerations, economy, materiality and technology” (Madkour et al. 2010, p. 589). The notion of playing endlessly within the limits of design constraints with the aid of parametric modelling has been considered a major improvement in performance-based design. Non-spatial parameters like performance or program can act as controlling devices that rationalise and optimise form generation in the digital age of design. Here, “the digital model stores explicit performance-sensitive design decisions and constraints, and responds to them simultaneously” (Madkour et al. 2010, p. 589). Prerationalization and post-optimisation in design have been discussed in depth by Anton and Tănase. While both try to optimise geometry for better performance, the former tries to find a solution for an already existing form, while the latter aims to generate a viable solution, part of which is the form itself. A significant shift in the design process is anticipated, from form making to form finding, and from fixed design ideas to a process design (Anton and Tănase 2016). Evolutive (genetic) design optimization has been discussed as a method of generating and exploring many design alternatives and finding an optimum solution for whole or part of design in a parametric environment, something that is very hard to do in traditional design process and with mainstream simulation software (Lin and Gerber 2014, Shi 2010). Nevertheless, the number of research dedicated exclusively to the link between two discourses is not significant. Even less is written on the practical application of parametric modelling environments in performance-based architectural design. Some research in the field employs highly advanced codes and optimisation platforms that are hard to understand for an architect or try to invent a whole new parametric simulation tool from scratch (Lin and Gerber 2014, Madkour et al. 2010). A comprehensive research on form finding through climatic constraints and 6
INTRODUCTION performance targets exists, but it lacks practical information tailored for architects, and it uses less-known but highly capable parametric modelling environment Bentley’s Generative Components (Chronis et al. 2012). Another framework for integrating parametric modelling and performance simulation into early design stages also depends on writing new codes and working within Generative Components (Toth et al. 2011). Roudsari (Roudsari et al. 2013), the chief programmer behind LB+HB, offers insight into general concepts of using plugins in the design process, though the publication is limited to the evaluative use of plugins rather than explorative and generative capabilities of Grasshopper. Lauridsen and Peterson present a method of using Grasshopper for integrating Daylighting, indoor comfort and energy efficiency into the design process, but the method includes writing new code for form optimisation, and detailed instruction on how it works in practice is missing in publication (Lauridsen and Petersen 2014). Optimising visual and thermal outdoor comfort with Grasshopper is the subject of a workshop held by Royal Danish Academy of Architecture. The respective publication offers insights into how to use Ladybug and Honeybee for finding an optimal formal solution among pre-defined variations, but generative capabilities of parametric modelling are missing (Naboni 2014). The most comprehensive reference available on the subject is Kjell Anderson’s book, Design Energy Simulation for Architects: Guide to 3D Graphics. The book offers examples of using Ladybug and Honeybee inside design process. Some of the examples are drawn from professional sector. Optimisation with Galapagos has also been discussed in detail in the book (Anderson 2014).
1.4
Research Methodology
1.4.1
Research Hypothesis
This master thesis, Assessment of Usability and Usefulness of New Building Performance Simulation Tools in Architectural Design Process, intends to study ‘new’ BPS tools, assessing whether they can improve integration of building performance agenda in the architectural design process and how this intention is addressed and implemented in practice. The working hypothesis of this research is as follows: “New parametric building performance simulation software such as Ladybug and Honeybee can help architects making design decisions informed by performance.”
7
INTRODUCTION The denotation ‘new’ refers to parametric BPS tools such as Ladybug and Honeybee
that
are
operating
inside
a
Visual
Programming
Language
(Grasshopper). These innovative tools are parametric in both modelling and simulation. The denotation ‘parametric’ in general can be used to refer to a rather broad range of BPS software, mainly because many high-end BPS packages like Designbuilder, TAS Building Designer and Openstudio offer some degree of parametric simulation (the ability to define range of accepted parameters, and then generate and compare various design options working within those ranges) (Jankovic 2017). Moreover, parametric modelling itself is not something new or innovative. In fact, at the beginning of the digital era, Computer Aided Design (CAD) softwares were exclusively parametric, like Sketchpad, the ancestor of today’s cad software (Jacko 2012). But in the context of this thesis, a parametric BPS tool is a tool that works in a Visual Programming Language (VPL), offering both 2D/3D parametric modelling and parametric building performance simulation, either as built into the VPL itself or as an extension. Grasshopper for Rhino, Dynamo for Revit, and Bentley’s Generative Components are examples of VPLs that offer building performance simulation capabilities. One can assert that Visual Programming environment is the novel element here. The application of visual programming in design, known also as Visual Dataflow Modelling (VDM) is becoming increasingly popular within architecture community, mainly because it allows for acceleration of the iterative design process, therefore allowing more significant numbers of design possibilities to be explored, without forcing architects to learn coding and scripting (Tedeschi 2011, 2014). Another critical aspect of hypothesis, ‘design decisions informed by performance’, has been addressed comprehensively in section 1.3, Background. Finally, refuting or approving the hypothesis demands an assessment of whether these new parametric tools ‘are able’ to ‘help architects’, as denoted by terms ‘usability’ and ‘usefulness’. In the title of this master thesis. In next section, the proposed methodology for performing such assessment is explained in detail.
1.4.2
Research methodology
The primary purpose of framing a ‘working’ hypothesis is to open a new discussion and entice further research around a subject matter that is new or not well studied before (Shields and Rangarajan 2013). Due to subjective nature of the claims expressed in a working hypothesis, it usually can be neither refuted nor fully supported through scientific methods. Therefore, a hands-on exploratory approach is deemed as the most proper way of treating research questions. 8
INTRODUCTION To verify the claim made in working hypothesis, two new BPS plugins that work in a parametric modelling environment, Ladybug and Honeybee, will be analyzed to assess their interface usability for architects, and their usefulness in improving performance-based decision-making during the design process. As the application of parametric performance analysis is still not widely practised in academia and professional sector, and in line with the exploratory intention of the research, a criterion-based subjective evaluation is opted for. Research methodology includes a literature review that offers an overview of the issues most pertinent to the subject matter of this thesis, then criteria extracted from the theoretical background will be suggested, upon which the software assessment will be based. An introduction to performance simulation in Grasshopper, its conventions and workflows will follow. The practical part includes four design scenarios built around the application of Ladybug and Honeybee, each tailored to address one or more criteria. Afterwards, each criterion will be explored regarding the actual experience of the author while implementing design scenarios. Finally, research conclusion summarizes the findings regarding working hypothesis and conceptual framework, and how the research endeavour may continue to embrace more specificity and objectivity.
1.4.3
Evaluation Criteria
Two essential aspects of the assessment are Usability and Usefulness of the software. Criteria based on these two aspects provides a platform for evaluation of selected BPS tools, whether they are easy to use, and how much they are useful for architects.
1.4.3.1. Usability: What is expected of user interface? One commonly cited definition of usability is “the ease of use and acceptability of a system”. Ease of use affects the users’ performance and their satisfaction, while acceptability affects whether the product is used widely or not (Holzinger and Andreas 2005). ISO 9241 (2010) defines usability as “the extent to which a product can be used by specified users to achieve specified goals with effectiveness, efficiency, and satisfaction in a specified context of use.” According to Nielson (1994), five main sub-themes of usability are as follows: i.
Learnability: the system should enable the users to accomplish easily basic tasks the first time they encounter the design.
ii.
Efficiency: once the users learned the design, the system should be used efficiently. 9
INTRODUCTION iii.
Memorability: after a period of time when the users return to the application, the system should be easily remembered in order to reestablish proficiency.
iv.
Errors: the system should cause low error rates and should recover them quickly.
v.
Satisfaction: the design should be pleasant to use.
User interface design is a decisive factor in the usability of software or website. One of the significant obstacles to using BPS tools is their non-friendly user interface (Mahdavi et al. 2003). Most traditional BPS tools sport a visually cluttered interface, that is hard to handle for architects. It is due to the fact that in earliest stages of BPS development, most of the tools were prepared with experts in mind, and therefore, the ease of use was not much an issue as functionality (Cetin 2010). Usability is often assessed through standardized tests held among users. Given the limited context of this research (two simulation plugins for Grasshopper) and particular user group in mind (architects), usability assessment has been made a more individual effort. Thus, based on five sub-themes of usability mentioned above (Nielsen 1994), and criteria Attia and his colleagues proposed for an “architectfriendly simulation software (Attia et al. 2012), following a list of criteria are developed to help to assess the usability of selected BPS: i.
Learning Curve
ii.
Data Entry
iii.
Simulation Output
iv.
Error Notification
v.
Help & Support
1.4.3.2. Usefulness: What is expected of an 'Architect-friendly' performance simulation tool? Shadi Attia and his colleagues have developed a comprehensive platform for assessing the usefulness of BPS tools based on architects’ needs (Attia et al. 2013, Attia et al. 2012). They propose a set of five criteria that a successful BPS tool shall meet in order to be useful in the design process, with emphasis on early design stages. These criteria are used in current research to assess the usefulness of select software: i.
Usability and information management (UIM) of interface
ii.
Integration of intelligent design knowledge-base (IIKB)
iii.
Accuracy of tools and ability to simulate detailed and complex building components (AADCC) 10
INTRODUCTION iv.
Interoperability of building modelling (IBM)
v.
Integration of tools in building design process (IBDP)
In the current research, above five criteria are abbreviated and called as Usability, Intelligence, Ability, Interoperability, and Integration in Design Process, respectively.
1.4.3.2.1.
Usability and information management (UIM) of interface
Usability is already discussed in lengths in section 1.4.3.1., where information management aspects of user interface like templates and default values are also addressed.
1.4.3.2.2.
Integration of intelligent design knowledge-base (IIKB)
Intelligent design knowledge-base, also known as design decision support and design optimization (Attia et al. 2013, Attia et al. 2012), is constituted of two parts. The first part, knowledge-base, refers to code compliance, pre-set building templates, and availability of pre-made standard building components. The second part, intelligence, addresses the need for climate- and context-based early advice for architects, the ability to quickly create and compare design alternatives, and generating solutions that respond to a specific set of parameter ranges. Another important aspect of an intelligent BPS tool is addressing different stages of design by offering a diverse set of tools and methods customized to specific modelling and simulation demands of each stage. The premise behind such feature is that each design stage asks for a certain level of simulation complexity, with a certain amount of data entry, modelling timeframe, and output sophistication.
1.4.3.3. Accuracy of tools and ability to simulate detailed and complex building components (AADCC) This important criterion focuses on the ability of BPS tool to simulate increasingly complex building forms and new building systems in a precise and accurate way. In order for results to be reliable, a validated simulation engine is necessary. Moreover, for those simulation tasks that are more dependent on calculations than a complete simulation, accuracy and an acceptable resolution is recommended. BPS tool should cover all necessary aspects of building simulation in such a comprehensive way that there would be no necessity of using a second simulation tool in parallel. For executing a typical early design stage simulation, following parameters are considered as necessary, and thus part of modelling process (Toth 11
INTRODUCTION et al. 2011), and they all should be easily modelled (though not all of these parameters are necessary to run a simulation in early design stages): i.
Thermal zones
v.
Internal gains
ii.
Glazing
vi.
HVAC systems
iii.
External shading
vii.
Weather and site
iv.
Construction types
A useful BPS tool should also be able to simulate new building systems that affect building performance, e.g. green roofs, double façade skins, chilled beams, concrete core condition, etc. Renewable on-site energy generation is another important aspect that must be considered in the simulation. Solar panels, PV and small wind turbines are examples of such systems. Passive design strategies, energyassociated emissions, and simple cost analysis are also highly sought in a useful BPS tool, as they all help architects to make informed design decisions about building form and building systems before delving into detailed design phase (Attia et al. 2012). Besides the energy consumption aspects of design, lighting, Daylighting and thermal comforts are all crucial topics in Performance-based Design discourse (Anderson 2014). Therefore, the ability to present architects proper information about effects of their design decisions on comfort and livelihood of future users of the building is a decisive criterion for assessing the usefulness of BPS tools. While simplified shoebox models has been a cornerstone of building performance simulation, mainly due to their simplicity and ability to resembling majority of buildings’ forms, however, recently digital design tools and colossal computer processing power, along with an increasing interest in biomimicry and curve mathematics, have enabled architects to describe and build spatial constructs that would have been inconceivable even ten years ago (Burry and Burry 2010). Although the use of sophisticated forms and curvature surfaces are still limited to a small number of buildings designed and built, it is a spatial trend that must be addressed timely and adequately by BPS tools. Software like Rhino, Z-form and Maya offer a broad range of formal possibilities to escape the rigid rectangular forms. Most of current BPS tools are entirely or partially unable to model and simulate this new spatial language. Part of this shortcoming is due to the limitation in simulation engines, but given a substantial computing power is available, a versatile modelling environment with the ability to create complex forms can address this issue. 12
INTRODUCTION
1.4.3.3.1.
Interoperability of building modelling (IBM)
The building design is a collaborative effort, not only in the sense of different experts involved in it but also regarding different software platforms being used and data types exchanged from early design sketches to construction. Interoperability is defined here as the ability to exchange data seamlessly and effortlessly among different software platforms. Beyond the traditional method of importing/exporting data among the various software platforms, BPS tools should provide options for real-time bi-directional data flow with Computer-aided Design platforms that are commonly used by architects to model building forms, like AutoCAD, Rhino, Sketchup, etc. Though a useful BPS tool must be able to tackle most of simulation needs, a bi-directional data connection to more specialized simulation platforms like Radiance (lighting and Daylighting simulation), Daysim (dynamic Daylighting simulation), Therm (Two-Dimensional Building Heat-Transfer Modeling software for glazings), OpenFOAM (CFD toolbox), etc. is highly recommended to streamline the teamwork with minimum effort and data loss. Finally, in light of growing use of Building Information Management in architecture and construction sector, and popularity of BIM modelling environments like Revit or ArchiCAD, a seamless integration with BPS tool, and the ability to model native BIM elements directly inside BPS modelling environment, can save a considerable time and effort on behalf of design teams.
1.4.3.3.2.
Integration of tools in building design process (IBDP)
Of the five selected criteria for assessing usefulness/utility of BPS tools in the design process, the fifth and final criterion is the most subjective and hardest to define in detail. In general, integration of BPS tool in the design process is all about adaptability and interface. An ideal vision for performance simulation is that it should go hand in hand with design/modelling efforts. In such case, all conceptualizations, modelling duties and simulation tasks are done in the same environment, and in (almost) simultaneously. Thus, the BPS tool should offer tools necessary for simulation performance in each step of design, without any parallel formal modelling, and it should be able to show the simulation results right inside the modelling environment and hopefully in real-time, so as to eliminate any need to abandon design process for the sake of assessing performance.
1.4.3.4. Summary of Usability and Usefulness assessment criteria A summary of all criteria used in assessment can be found in Table 1-1. The questions associated with each criterion serve two purposes: First, they help to 13
INTRODUCTION interrogate the BPS tool regarding a specific notion of Usability/Usefulness, and second, they provide a better understating of the underlying meaning of each criterion. Table 1-1: Usability and Usefulness assessment criteria Category
Criterion
Learning curve
Efficient data-input Usability and information Simulation output management (UIM) of interface Error Notification
Help
Compliance audits Integration of Embracing design intelligent stages design knowledgebase (IIKB)
Accuracy of
Supporting decision making
Comprehensiveness
tools and ability to simulate detailed and Accuracy/Validity complex building Processing complex components forms
Questions • How familiar is the user interface for an average architect? • Should users start learning about modelling conventions from scratch? • Is data entry method meaningful to architects? • Is it more visual/spatial or more numerical? • Do templates, notional buildings, default values and libraries exist? • Is simulation output visual, real-time, and available inside modelling environment? • Are ready-to-go report templates available? • Do errors happen often? • Do they interrupt the modelling or simulation process irreversibly? • Are the causes and probable solutions for errors communicated clearly and timely to the user? • What are the different help systems offered to users? • Does context-sensitive help exist? • What about tutorials and technical manuals? • Can users count on online support or user forums to solve their issues? • Does the software offer any compliance auditing for standards and certificates? • Does the software offer different sets of tools, input/output complexity and workflow, based on design stages? • Is climate- and context-based early advice available? • How easy is it to create and compare design alternatives? • Is it possible to generate design solutions responding to acceptable ranges of performance parameters? • Are all areas of building performance simulation (thermal/visual/acoustical) covered by the software? • Is it necessary to switch to another software to perform a routine simulation task? • Does BPS tool take advantage of validated simulation engines or well-studied calculation algorithms? • Is there any limitation for resolution/precision of input and output? • Is the BPS tool able to analyse non-planar surfaces and complex models?
14
INTRODUCTION Category
Criterion
(AADCC) Supporting new building technologies
Interoperability
Import/export
of building modelling
Flow of data
(IBM) Seamless integration into BIM
Real-time feedback Integration of tools in building design process (IBDP) Evaluation
Questions • Does the BPS tool provide support for renewables and on-site energy generation technologies? • Does the BPS tool provide support for new building technologies essential to energy efficiency and users’ comfort? • Is it possible to introduce or imitate new building technologies not included by default in software to simulation? • Is the BPS tool able to import/export model and data to industry standard formats? • Is it possible to send the final model directly to a render engine? • Does the BPS tool offer spreadsheet and database import/export? • Are there any live bi-directional data/model exchange features with 3D modelling software? • Is the BPS tool part of a BIM package itself? • Does the BPS tool offer data exchange with a BIM package? • Is the BPS tool able to present the performance simulation results right inside the supporting 3D modelling environment? • Do architects need to switch between different software environment or perform any additional tasks to get feedback on their spatial design decisions? • In case of any changes to 3D model, can the BPS tool reflect those changes instantly? • How convenient is to compare different design alternatives in term of their performance inside the software? • Is the BPS tool capable of selecting the best, or a number of best design alternatives automatically? • Is it possible to record performance indices for different stages of design, as it progresses? • Does the BPS tool offer any notional building or nominally acceptable range of values for comparison?
15
GRASSHOPPER/LADYBUG/HONEYBEE AND PERFORMANCE SIMULATION
2
GRASSHOPPER/LADYBUG AND HONEYBEE AND PERFORMANCE SIMULATION
2.1.1
Overview
In this chapter, concepts and procedures regarding building performance simulation in a parametric modelling environment, Grasshopper for Rhino, are addressed. After a short introduction to Grasshopper and the rationale behind its selection, general concepts apropos parametric modelling in Grasshopper are explained. Grasshopper Ecosystem of plugins is the subject of next section. Then Ladybug and Honeybee are introduced, and a simple step-by-step procedure for performing basic analysis through LB/HB is offered.
2.1.2
What is Grasshopper?
Grasshopper is a visual programming editor developed by David Rutten (2014) at Robert McNeel & Associates, the parent company of Rhinoceros 3D (2016). Visual Programming is a quite recent paradigm in computer programming, where users work with logic elements graphically rather than in written code. In other terms, users create programs by connecting program elements, or blocks, visually rather than textually. Their approach is very similar to flowcharts, as they are constituted by a series of arrows and blocks, which describe a logical sequence of actions, put together to achieve the desired result (Dehouck 2015). In contrast to programming languages like C# or Python, a visual programming editor like Grasshopper is based on a simplified and sequential syntax structure: “the only ‘syntax’ required is that the inputs of the blocks receive the data of the appropriate type, and ideally, that is organized according to the desired result.” (Mode Lab 2015) This visual simplification makes Grasshopper much closer to the mindset of designers and architects and enables them to code without coding. Grasshopper is tightly integrated into Rhino, a leading NURBS modelling software. Rhino has its own internal programming language, Rhinoscript, with close ties to Python. Grasshopper offers a visual substitution for coding in both Rhinoscript and Python, thus eliminating the need to learn neither of those scripting languages ( خطا
.)منبع مرجع یافته نشده. Grasshopper helps design algorithms which automate tasks in 16
GRASSHOPPER/LADYBUG/HONEYBEE AND PERFORMANCE SIMULATION Rhino, among them modelling operations. Grasshopper is mainly used for generative art, parametric modelling for architecture and structure engineering, digital fabrication, optimization and automation, jewellery design, evolutionary design and biomimicry, and recently Performance-based design (Anderson 2014, Hensel 2013, Mode Lab 2015, Tedeschi 2011, 2014). Due to its relative ease of use, and unprecedented computational power and versatility it offers, Grasshopper is hugely
popular
among
architecture
students
and
younger
generations
of
professionals (Charles and Thomas 2009, Sprecher et al. 2010).
Figure 2-1: Comparison of Python code and its corresponding Grasshopper construct for drawing a sine curve (source: (Mode Lab 2015)).
2.1.3
Why Grasshopper?
Grasshopper works inside Rhino, and so it benefits from versatile NURBS and polygon modelling tools included in Rhino. This is the most distinguishing feature of Grasshopper. Three other similar visual programming editors are all based on a BIM software package: Dynamo for Revit, Generative Components for Bentley Architecture, and Marionette for Vectorworks. Rhino is an industry-standard software for converting 3D models, due to its extensive Import/Export facility, and Grasshopper benefits from that substantially. Grasshopper is based on Python, and unlike its competitors, it is easily expandable. Finally, Grasshopper enjoys a vibrant users and developers community, and it is the oldest and most popular software of its kind, in both academia and professional sectors (Oxman and Oxman 2010, Tedeschi 2014).
17
GRASSHOPPER/LADYBUG/HONEYBEE AND PERFORMANCE SIMULATION
2.1.4
Parametric modelling in Grasshopper: General concepts
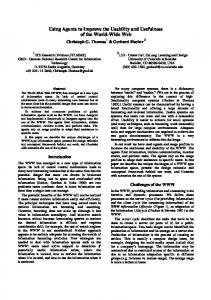
Grasshopper allows users to define logical relationships between several design parameters. Such construct is called a parametric model (Mode Lab 2015). Parametric modelling acts upon such explicitly-defined relationships between parameters that are bound to change within explicitly-defined boundaries (Woodbury 2010). In a parametric model, all parts of the model relate and change together as opposed to traditional design, wherein each part is treated isolated, and then after the implications of any isolated change should be speculated and manifested in other parts of the design. Wholesome coordination inside a parametric model is based on the explicit definition of parameters and their relationships (dependencies). Parameters are considered as definitions of overall limits and performance of a system. Dependencies among parameters are defined by a set of explicit rules or operations (Mode Lab 2015). Grasshopper benefits from a drag and drop user interface for creating the explicit structure of a parametric model. Inside its interface, users can create definitions, by dragging components into the main editing window, called the canvas (Figure 2-2). Definitions are mostly (but not necessarily) parametric models, consisted of a set of rules and instructions to automate tasks in Rhino. Definitions include algorithms for creating, manipulating and analysis of geometry, but they are just an explicit description of desired geometrical outcomes rather than geometry itself. The geometrical representation of a Grasshopper definition is shown in Rhino viewport, and because of dynamic nature of Grasshopper-Rhino connection, represented geometry is always up-to-date (though the auto-update can be turned off) and ready to be converted into real Rhino geometry through an operation called Baking. Baking instantiates new geometry into the Rhino document based on the current state of the Grasshopper’s definition (Figure 2-3).
18
GRASSHOPPER/LADYBUG/HONEYBEE AND PERFORMANCE SIMULATION
Figure 2-2: Components can be dragged from the toolbar and dropped into the canvas (source: www.rhino3d.com).
Figure 2-3: Grasshopper canvas superimposed on Rhino window, with a definition and its live geometrical representation in Rhino viewport (Source: www.arch2o.com).
Grasshopper definitions are visual programs. These definitions/programs are made up of nodes connected by wires. Nodes are the main points for data storage and 19
GRASSHOPPER/LADYBUG/HONEYBEE AND PERFORMANCE SIMULATION data operations. There are two primary types of Nodes in every grasshopper definition: Parameters, and Components. Parameters store data, either statically or dynamically, while Components perform actions on data they are fed from Parameters or other Components, and these actions often result in a new set of data. Simply put, Components inherit data from Parameters and previous components through their input part, perform an operation on that data, during which the original data is modified, and publish the new data through their output part, to next Component for further operation, or to a Parameter so that new data can be stored for any future purposes. All data transportation is carried away through Wires, and they always move from left to right of canvas (Figure 2-4).
Static and dynamic
Operational Components Nodes
Parameter Nodes
Definition output
Wires
Figure 2-4: A Grasshopper definition
Wires act like veins or nerves, carrying blood or data impulses. Data is essential to Grasshopper inner workings, and it is the very item that differentiates Grasshopper, and Parametric Design in general, from more traditional geometry-based design dichotomies. Data in Grasshopper takes many different forms: an integer or real number, a text string, a colour swatch, time, location, numerical ranges, Boolean states, and most importantly geometry. Grasshopper can import and store (or in Grasshopper’s term, internalize) data from many different sources: data that comes from a Component or Parameter inside Grasshopper, objects from Rhino (geometrical and non-geometrical), a file stored on a physical drive, or a piece of information somewhere on Internet, and from other software or hardware interfaces through plugin Components. Considering this level of versatility in managing data, data compatibility is a significant issue in Grasshopper. In most cases, Grasshopper Components take care of data compatibility and conversion themselves, allowing for a smooth data flow all through the definition. In particular cases, Grasshopper is equipped with a broad range of data conversion Components that could be inserted inside the definition to shape data to input prerequisite of next Component.
20
GRASSHOPPER/LADYBUG/HONEYBEE AND PERFORMANCE SIMULATION In general, it is data, or to be more precise parameters of geometry that are declared inside a Grasshopper definition, not the shape itself. Parameters are usually defined as explicit limits, within which a system or part of it is allowed to perform. To reflect this constraint-based approach, Grasshopper offers a range of dynamic parameter nodes, like sliders, graphs, and value lists (Figure 2-5 and Figure 2-6). Because a Grasshopper definition is a parametric model, each and every change in input parameters are reflected instantly in the whole model, enabling users to generate a range of design alternatives. Dynamic input parameters can also be modified by other components or third-party agents. Addons like Galapagos or external software like Genoform take advantage of the ability to modify input parameters for optimization tasks and generative design.
Figure 2-5: Numerical Slider (left) and Graph (right), two examples of dynamic data input components in Grasshopper.
Figure 2-6: A Grasshopper definition with static geometrical Parameter and dynamic Numerical Sliders and Graph Mappers (source:(Mode Lab 2015)).
Grasshopper abilities are highly expandable through plugins or Apps. Apps are usually consisted of many Components, in the same fashion as Grasshopper’s native components. Basically, there is no difference from a native component and an installed one, and data can flow smoothly among them, as long as data compatibility is respected Figure 2-7.
21
GRASSHOPPER/LADYBUG/HONEYBEE AND PERFORMANCE SIMULATION
Figure 2-7: Grasshopper tabbed toolbar with native components and installed Apps.
This flexible software architecture allows for a broad range of data and operations taking place inside a Grasshopper definition, thus making it a comprehensive tool for multi-disciplinary approaches. The ability to ‘converge’ agents from various disciplines together in order to generate a multitude of ‘acceptable’ design options responding to a clearly defined set of desired performance range (Figure 2-8), is at the heart of this thesis’s central argument that Grasshopper and similar parametric modelling environments offer untapped potential to tackle shortcomings of traditional BPS software regarding building performance design and simulation (Evins 2013, Leach 2014, Lee et al. 2014, Lin and Gerber 2014, Malé-Alemany and Sousa 2003, Oxman 2009, Schumacher 2009, 2016, Turrin et al. 2011, 2012, Wang et al. 2010).
Figure 2-8: Convergence as a parametric design approach in Performance-based design.
22
GRASSHOPPER/LADYBUG/HONEYBEE AND PERFORMANCE SIMULATION
2.1.5
Building performance simulation in Grasshopper
Several plugins or Apps are available for Grasshopper with a specific focus on building performance simulation. Geometry created in Rhino, or modelled inside Grasshopper, can be referenced into Grasshopper to perform a number of simulation and optimization tasks. Most of these addon Apps use validated external simulation engines like Energyplus or Radiance. In this sense, these apps act as a graphical interface for simulation engines, accessible and comprehensible for average users who don’t possess in-depth technical knowledge. Grasshopper’s BPS Apps cover a wide range of topics, addressing three critical aspects of building performance: Thermal, Visual and Acoustical. Some of the most important of these Apps are mentioned in Table 2-1. Beyond the range of available performance simulation apps, Grasshopper is able to exchange data through gbXML with many other platforms and simulation engines. Chameleon and Grizzly Bear (which is part of Ladybug Tools) are the Apps that facilitate gbXML data exchange. Moreover, several tasks related to performance simulation are part of Grasshopper’s Apps inventory. For example, Life Cycle Assessment, Global Warming Potentials are available with Tortuga. Finally, Grasshopper offers seamless integration to many BIM packages, bridging information management and building performance simulation.
23
GRASSHOPPER/LADYBUG/HONEYBEE AND PERFORMANCE SIMULATION Table 2-1: List of well-known Grasshopper's Apps for building performance simulation Name
Performance Domain
Simulation Engine
Description
Ladybug
Thermal/Visual
-
Environmental data visualization
Honeybee
Thermal/Visual
Energyplus Radiance
Multi-zone thermal and visual performance simulation
Butterfly
Thermal
OpenFOAM
CFD simulation
DIVA
Thermal/Visual
Energyplus Radiance
Single-zone thermal and visual simulation
Geco
-
-
Ecotect interface
Gerilla
Thermal
Energyplus
Multi-zone thermal performance simulation
HeliotropeSolar
Visual
-
Solar geometry creation
Pachyderm Acoustical
Acoustical
-
Acoustics simulation algorithms predict noise, visualize sound propagation, etc.
Mr. Comfy
Thermal/Visual
-
Environmental data visualization
eVe | Sun
Visual
-
Shadow analysis
ArchSim
Thermal
Energyplus
Multi-zone thermal performance simulation
TRNLizard
Thermal/Visual
Trnsys
Multi-zone thermal and visual performance simulation
Lark Spectral Lighting
Visual
Radiance
Circadian lighting metrics
Lynx4D
Visual
-
Solar tools for early design stages
While a number of building performance plugins are available for Grasshopper, Ladybug and Honeybee are the most versatile and well-known among them (Figure 2-9), and there is an abundant of research, and online material regarding their use in Performance-based design and simulation (Anderson 2014, Anton and Tănase 2016, Dogan et al. 2015, Heidegger 2013, Lauridsen and Petersen 2014, Milošević et al. 2016, Naboni 2014, Orfanos et al. 2015, Rogler 2014, Roudsari et al. 2013).
Figure 2-9: Ladybug (left) and Honeybee (right) icons in Grasshopper
Ladybug and Honeybee enjoy bi-directional data exchange with a validated simulation engine like Energyplus, Radiance, OpenFOAM, and integration into other 24
GRASSHOPPER/LADYBUG/HONEYBEE AND PERFORMANCE SIMULATION simulation platforms like Openstudio Figure 2-10. A wide range of thermal and visual simulation options are available to the user to satisfy most performance simulation tasks. Ladybug and Honeybee are described in more details in following sections.
Figure 2-10: Ladybug, Honeybee and Grasshopper Ecosystem for building performance simulation (source: www.ladybug.tools).
2.1.6
Ladybug
Ladybug is an opensource environmental plugin for Grasshopper. Ladybug works with Energyplus weather files (epw) to produce a range of visualizations and simple calculations based on weather data. Thus, Ladybug’s operation doesn’t include simulation calculation, and its working is more based on location than geometry. Therefore, Ladybug is more used for pre-design decisions and early design sketches, where a proper understanding of context and its implications on building performance is demanded. Some of the visualization outputs of Ladybug can be projected
on a geometry referenced from Rhino or inherited from inside
Grasshopper (.)خطا منبع مرجع یافته نشده.
25
GRASSHOPPER/LADYBUG/HONEYBEE AND PERFORMANCE SIMULATION
Figure 2-11: Ladybug (source: www.grasshopper3d.com).
A simple Ladybug workflow is described as follows (Figure 2-12): 1. Run Ladybug mother components by dropping it into Grasshopper Canvas; 2. Import an EnergyPlus weather file (epw). Weather file can be imported from hard drive or from an internet address; 3. Reference a Rhino model (optional), in case the desired visualization output is to be projected on a geometrical model, like shadow analysis or outdoor comfort map; 4. Assign surfaces for PV from the referenced model (optional). This step is only necessary if Photovoltaic panels are to be considered; 5. Set an analysis period. If no period is specified, Ladybug considers the whole year as its working period; 6. Prepare additional data like sky models if necessary (optional); 7. Add desired output components and visualization configurations; 8. Run visualization. Outputs are either shown inside Rhino viewport or as data inside Grasshopper, based on output type.
26
GRASSHOPPER/LADYBUG/HONEYBEE AND PERFORMANCE SIMULATION
Figure 2-12: A Grasshopper definition is performing shadow range analysis with Ladybug components (definition courtesy of Chris Mackey).
A list of passive design strategies is available as part of input data, so the user can assess the effects of introducing relevant building systems in later design stages. After importing weather data, the user can choose between a wide range of outputs, including numerical weather indices, analysis of thermal comforts in the location of weather file, visualization charts for most data types available in weather file, solar and radiation analysis, and implications of using renewable energy systems in given location. Some of the outputs Ladybug can produce, are found in Figure 2-13.
Figure 2-13: Ladybug workflow and main outputs.
27
GRASSHOPPER/LADYBUG/HONEYBEE AND PERFORMANCE SIMULATION
Visualizations in Ladybug are highly customizable up to smallest details. All visualizations are rendered inside active Rhino viewport, and it is possible to create many visualizations inside a single viewport in order to compare different locations or building systems. All visualizations can be saved as raster or vector formats for later usage in presentations (Figure 2-14).
Figure 2-14: Examples of Ladybug output visualizations (Courtesy of Chris Mackey).
2.1.7
Honeybee
Honeybee is an extension to Ladybug Tools, that acts as an interface between Rhino/Grasshopper and simulation platforms like Energyplus, Radiance, Daysim, Therm and Openstudio (Figure 2-15).
Figure 2-15: Honeybee (source: www.grasshopper3d.com).
28
GRASSHOPPER/LADYBUG/HONEYBEE AND PERFORMANCE SIMULATION Unlike Ladybug which is mainly a weather data visualization tool, Honeybee provides simulation operations through external engines, in a parametric way. Therefore, Honeybee is dependent on these engines for its functionality, computing power, precision, and error notification system, while Ladybug benefits from its internal calculations that brings more stability, computing power and better error notification system. Ladybug and Honeybee are seamlessly integrated, and they are basically parts of the same software, but with different names (Roudsari et al. 2013). Honeybee takes advantage of Ladybug visualization components and sky models, and both Apps can be used next to each other in a streamlined workflow that offers performance assessments and simulation from early design sketches to detailed thermal and visual simulations performed on the final model. A simple Honeybee workflow for performing a thermal performance simulation is described as follows (Figure 2-16): 1. Run Honeybee mother components by dropping it into Grasshopper Canvas; 2. Set a working directory (optional). As par with EnergyPlus conventions, the name and address of this directory should not include any space; 3. Import an EnergyPlus weather file (epw). Weather file can be imported from hard drive or from an internet address; 4. Reference a Rhino model; 5. Check model to ensure matching surfaces exist (optional). This can be done either manually, or automatically by Intersect Masses component; 6. Convert imported geometry to zones. Again, there are manual and automatic ways of defining zones in Honeybee. 7. Mark conditioned and unconditioned zones (optional); 8. Calculate adjacencies. Honeybee calculates adjacencies automatically; thereafter all adjacencies can be visualized and edited manually; 9. Add glazing. Honeybee offers an automatic glazing system that works based on glazing ratio per wall area, and it is possible to define different ratios for four geographical directions. Manual insertion of glazing, and marking existing surfaces as glazing are also possible; 10. Add context, like external shades, plantation, urban environment (optional); 11. Set additional simulation parameters like constructions, schedules, zone properties, and HVAC systems (optional). Honeybee offers visual representation for these parameters to facilitate creating and editing them in a manner comprehensible for users not skilled in EnergyPlus working 29
GRASSHOPPER/LADYBUG/HONEYBEE AND PERFORMANCE SIMULATION mechanisms. In case no parameter is designated, Honeybee uses default values, thus performing simple simulations possible in the shortest time; 12. Set an analysis period. If no period is specified, Ladybug considers the whole year as its working period; 13. Choose simulation outputs; 14. Run simulation; 15. Visualize simulation results.
Figure 2-16: A Grasshopper definition for energy simulation (Courtesy of Chris Mackey).
Honeybee can perform many simulation tasks offered by EnergyPlus, Radiance and Daysim. The central premise of Honeybee is to facilitate data entry, simulation execution and visualization of results all in one place (Figure 2-17). Honeybee shares the same visualization components with Ladybug (Figure 2-18).
Figure 2-17: Honeybee workflow and main outputs.
30
GRASSHOPPER/LADYBUG/HONEYBEE AND PERFORMANCE SIMULATION
Figure 2-18: Examples of Honeybee output visualizations (Courtesy of Chris Mackey).
31
DESIGN SCENARIOS
3
DESIGN SCENARIOS
3.1.1
Overview
In this chapter, usability and usefulness of Ladybug and Honeybee are assessed through their implementation in the design process. To do so, a number of design scenarios are defined based on major themes brought up in this research. The rationale behind it is to examine practical implementation of discussed BPS tools in the architectural design process and verify the outcomes against the claims and notions asserted in previous chapters. Findings of this step make the basis for discussions in next chapter regarding the usability and usefulness of Ladybug and Honeybee for an architect. Though proposed design scenarios mimic the real-world projects architects are facing in the professional sector, they are abstracted to evaluate topics relevant to this thesis, and thus, they shall not be considered to make complete sense, design-wise. All proposed scenarios are simplified to the extent they can fit into an architect’s fast-paced and busy schedule. For a user with acceptable knowledge of Rhino/Grasshopper, repeating each scenario should not take more than a couple of hours to half a working day, and they address various ways Ladybug tools can help architects making certain preliminary design decisions in an informed way. Moreover, many interesting topics are ignored here, mainly because either they are too sophisticated and time-consuming for early design stages, or they are concerned more with optimization isolated parts of building form or systems in later design stages. Ladybug online forum provides a rich and continuously updating stock of new applications for Ladybug tools in architectural design. Design scenarios in this research are defined based on the following criteria: 1. Addressing specific visualization or simulation tasks useful for making informed design decisions in early stages, instead of performing a full simulation; 2. Easy to code and implement within a tight design schedule; 3. Not too demanding in terms of computing power; 4. Providing real-time or fast numerical or visual feedback that is comprehensible for architects without extensive knowledge of building science; 5. Offering examples of how GH/LB/HB operations and results can be seamlessly integrated into Rhino’s interface. 32
DESIGN SCENARIOS
In the following sections, designated scenarios are described in detail. Several objectives are defined for each design scenario. Each objective is pertinent to one or more of criteria described in section 1.4.3.2 of this thesis. For ease of reference, relevant criteria are written in abbreviation inside brackets after the description of each objective.
3.1.2
Design Scenario I
Title: Climate Analysis with Ladybug Context: Vienna suburbs, open field with no apparent solar or wind obstruction. Description: Analyzing climate conditions for a future building. The design’s intention is to minimize energy consumption through active and passive strategies while maintaining a high level of thermal comfort for residents. Therefore, primary strategies are maximizing heat gain from solar radiation and taking advantage of natural ventilation. Objective: •
Supporting early design decision making through basic climate data provided by Ladybug [IIKB];
•
Exploring different types of standard climate charts available in Ladybug [UIM].
Workflow: After importing weather data for Vienna, most of the data visualization was done efficiently by connecting relevant Ladybug visualization components to imported data from weather file. The only exception was Radiation Rose, for creating which first a sky radiation matrix must first be calculated (Figure 3-1). Some of the results are available inside Grasshopper definition as numeric values (like min/max temperature, percent of comfortable hours, etc.) Charts are visualized inside Rhino viewport, and can easily be saved as raster files.
33
DESIGN SCENARIOS
Figure 3-1: Grasshopper definition implemented for this design scenario, with annotations and colourful organization.
The visual code in Figure 3-1 yields the following results: •
Absolute minimum/maximum temperature: -18.3 to 31.7 Cº
Figure 3-2: Monthly average Dry Bulb temperature bar chart.
34
DESIGN SCENARIOS
Figure 3-3: Wind Rose and Radiation Calla Dome.
Figure 3-4: Psychrometric chart with passive strategies implemented.
Heating is necessary for around 3256 hours a year (heating basepoint 18 Cº). Respectively, cooling hours are only 14 hours per year (cooling basepoint 27 Cº). Therefore, design decisions and building systems should be rallied around reducing heating energy loads (Figure 3-2). Wind Rose indicates which facades and orifices must be protected against harsh wind, especially in cold months, and what circulation directions allow for better natural ventilation in warmer months (Figure 3-3). According to Radiation Calla 35
DESIGN SCENARIOS
Dome, a slight north-eastern direction offers the most solar radiation, and this hint can be used later in deciding overall building orientation, PV and Solar Panels placement, whether a glass house or a thermal mass could be implemented to increase heat gains during winter Figure 3-3). Calculated Psychrometric chart predicts the efficiency of passive strategies. In this case, Internal Heat Gains is a strategy with considerable effects on thermal comfort (left polygon in Figure 3-4). Ladybug offers a confusingly wide range of visualizations, so it is essential that user knows what information or indices are helpful. Generic visualization charts are highly customizable, but their visual clarity is not comparable to dedicated software like Excel. The only chart type available is Bar chart, which limits the visualization choices, though it is always possible to use Grasshopper’s native Pie Chart. Nevertheless, many plugins (Apps) are available to take care of generic data visualization tasks, Conduit, Parrot, and Mandrill are three good examples. Moreover, App Bumblebee provides a live bi-directional data connection to Excel, bringing Excel’s chart making features into Grasshopper. Regarding building specialized performance visualizations, Ladybug’s arsenal is adequately
equipped,
especially
regarding
solar
radiation
and
the
wind.
Components are neatly organized, and there is a logical order of procession in Ladybug’s organization, starting from the left side, one can find predesign tools like performance and comfort numerical and visual components, and towards the right of the toolbar, more advanced early design components like shadow analysis or renewable appear. One perceived issue was the placement of visualizations. Ladybug places all visualization at zero coordinate (0,0,0) by default, meaning that user must move and arrange them manually. Though it is quickly done through native Grasshopper components, or in Rhino viewport after baking the visualization, it is somewhat inconvenient. Ladybug is an open source project, and thus, it is continuously updated. During working on this project, Radiation Calla Dome component issued an error, asking for an updated version of this component. The update was easily carried out in a few seconds by dropping a dedicated Update Ladybug component into the canvas. In general, Ladybug error notification system was clear and helpful.
36
DESIGN SCENARIOS
3.1.3
Design scenario II
Title: Early thermal performance simulation for a multi-story commercial building Context: Esfahan, Iran. A city at the geographical centre of Iran with moderate climate. Description: A five-story commercial building is in its early design stages. A simulation is to be conducted to get a preliminary picture of building’s thermal performance, before moving on to more advanced stages of design. Objectives: •
Dynamic referencing of Rhino geometry into Honeybee [UIM];
•
Using Honeybee’s built-in massing, zoning and glazing creation tools [AADCC];
•
Verifying input geometry [UIM];
•
Performing a fast thermal simulation in early design stages, with the help of default values and built-in libraries of Honeybee [UIM];
•
Creating 3D visualizations [UIM];
•
Calculating and visualizing thermal comfort [AADCC];
•
Exploring the workflow for adding a building system and its effects on thermal performance [AADCC].
Workflow: Different thermal zones were modelled in Rhino with simple boxes organized in separate layers. Then objects on each layer were referenced into Grasshopper through streamlining layers into thermal zones, instead of assigning zone properties to individual objects. This method allows for any later modifications to happen quickly and automatically, such as adding floors, or spaces, manipulating their shapes, or deleting them, as zone properties are assigned to Rhino layers (Figure 3-6, left). Honeybee offers a detailed list of architectural functions that can be assigned to zones to influence their internal heat gains and other relevant properties. In this case, either exact function, or a close substitute was assigned to each zone. Glazing was created automatically based on different Glazing-to-all-surface ratios for four geographical directions (Figure 3-5). All other simulation parameters like materials and constructions, schedules, equipment, HVAC system, infiltration and ventilation, etc. were left unchanged from default values Honeybee assigns them automatically, either universally or based on their adjacency-driven element type or zone properties extracted from the assigned architectural program (Figure 3-6, right). 37
DESIGN SCENARIOS
Figure 3-5: Automatic creation of glazing based on different glazing-to-wall ratios for cardinal directions.
Figure 3-6: Automatic import of geometry, program assignment and thermal zone creation in Honeybee.
Honeybee provides a set of tools for solving adjacencies, split imported geometry into floors, and add glazing based on glazing-to-wall area ratio for each of the cardinal directions. These tools make it easy to run a quick basic simulation when enough information about building systems or users’ behaviour is not yet available, or there is no need to perform a full simulation encompassing actual materials, schedules and so on. After passing geometry through the automatic surface, zone and glazing creation, the user can verify the results before running the EnergyPlus simulation. Labels and colours for both surfaces and zones are available for visual verification (Figure 3-7), and panels inside Grasshopper canvas offer more detailed information about all or some of the building simulation elements.
38
DESIGN SCENARIOS
Figure 3-7: Geometry verification: glazing (top-left), conditioned/unconditioned zones (topright), slab types roof/floor-ground (bottom-left), and assigned construction for Restaurant thermal zone (bottom-right).
Now it is possible to run EnergyPlus simulation inside Honeybee. The results are read back into definition automatically, and they can be used to create different visualizations. Here, total cooling load indicates that although cooling is less needed than heating in the sense of hours per year, it is significantly more energy consuming (Figure 3-8). Therefore, the efforts must be focused on decreasing cooling demands to make the building more energy efficient. Honeybee provides an Energy Balance chart that helps design team to identify areas for improvement (Figure 3-9). Charts can be easily turned on and off or arranged side-by-side to give a clear picture of building performance in a glance.
39
DESIGN SCENARIOS
Figure 3-8: Annual cooling/heating loads.
Figure 3-9: Total building energy balance.
Beside different types of charts, it is possible to visualize the simulation results right on the geometry itself. This allows a better picture of which elements or regions perform well or not in the sense of energy demand, heat gain/loss, shading benefits, etc. Figure 3-10 indicates that top floor zones (restaurant and club) are mostly responsible for high cooling loads, and protecting them from direct sunlight could be a proper solution. Also, windows are responsible for a significant energy gain, which in turn contributes to overheating and increasing cooling loads. Therefore, another area for improvement would be shading the windows or using high-performance glass materials for windows.
40
DESIGN SCENARIOS
Figure 3-10: Zone total cooling loads (left), and building surfaces' energy loss/gain (right).
Ladybug Tools, of which Honeybee is a member, offer comprehensive simulation and decision-making tools in many areas related to performance design. In addition to thermal performance simulation, it is possible to perform both static and weatherbased visual simulations. Thermal comfort calculations inside and outside the building is another feature built into Ladybug Tools (Figure 3-11).
Figure 3-11: Adaptive comfort map for the uppermost floor (top) and fourth floor (bottom).
41
DESIGN SCENARIOS
Honeybee simulation result visualizations for this scenario suggest a number of solutions for lowering cooling loads to design team: 1. Shading windows; 2. Shading roof with a canopy; 3. Use higher performance glass materials; 4. Cool the roof with a green roof system; 5. Change glazing-to-wall ratio; 6. Install PV panels on the roof to shade it while benefiting from on-site energy generation. All the solutions above can be quickly tested with Honeybee, and their results compared together to find the proper solution or combination of solutions. Ladybug tools doesn’t offer cost estimation, but with the help of Grasshopper math and list components, it is possible to calculate financial expenses and returns for each solution. Here, as an example, the workflow for adding a simple shading system to windows is described. Honeybee offers automatic shading creation, with options for depth and number of shades, inside/outside, vertical/horizontal, and static/dynamic shading controls (Figure 3-12). Therefore, introducing shading to building takes only a couple of minutes. One crucial aspect of Grasshopper is that many modelling and simulation paths can be put inside a single definition, so switching between design options is usually as easy as turning on or off a component or group of components. Moreover, in most cases, the user can copy and paste recurring parts of definition to speed up generating new alternatives or performing simulations with varying parameters on a design option. Here, after creating shadings, all other simulation and visualization components were copy and pasted from original simulation path. In this way, all charts and visualization outputs are generated automatically with added shading system accounted, with the same legends, dimensions and annotations as original outputs. After running the simulation, it turned out that adding a simple shading system can decrease cooling loads up to %20 and total energy loads up to %11. This process can be repeated for the rest of suggested solutions as well.
42
DESIGN SCENARIOS
Figure 3-12: Shading geometry generated on top of windows by Honeybee Shading Generator component.
3.1.4
Design scenario III
Title: Mass study for a residential tower Context: Tehran, Iran Scenario Description: Up to 70000 m2 of residential space in the heart of Tehran is the subject of an architectural commission (Figure 3-13). Low energy consumption for air conditioning and high level of residents’ comfort are priorities. To achieve these goals, a decision is made to introduce thermal performance and comfort into the design process from the very beginning. Finding a proper building form that satisfies both performance and design concerns is considered as the starting point.
Figure 3-13: Site plan (right) and Aerial Perspective for a residential tower.
43
DESIGN SCENARIOS
Objectives: •
Deciding on preferred building orientation [IIKB];
•
Assessing the use of Ladybug Tools in a conceptual mass study [IIKB];
•
Real-time feedback on multiple criteria inside modelling environment [IBDP];
•
Fast and smooth selection of design alternatives [IBDP].
Workflow: the First step is to understand the climate and urban context. Cooling and Heating Degree Days, as displayed in GH panels below, indicate that both heating and cooling loads are important factors, though cooling loads are more demanding (Figure 3-14).
Figure 3-14: CDD and HDD hours displayed inside Grasshopper panels.
Average monthly Dry Bulb temperature provides info on hottest and coldest periods of years, and how they are compared to a simple model of Adaptive comfort (Figure 3-15). The option to add Adaptive comfort band is part of the Ladybug’s Monthly Chart component, and it can be turned on and off with a switch. Figure 3-15 reemphasizes CDD/HDD calculations that heating is a more critical issue than cooling regarding thermal comfort (This necessarily doesn’t mean that heating energy load would be more significant than cooling energy load, as energy loads are dependent on building systems as well).
44
DESIGN SCENARIOS
Figure 3-15: Average monthly Dry Bulb temperature (with projected Adaptive comfort zone).
Passive systems can decrease energy use significantly, and they play an essential role in deciding building orientation and form. Psychrometric charts provide information regarding the efficiency of different passive strategies (Attia, Gratia, et al. 2012), and about times that active air conditioning is unavoidable if a certain degree of thermal comfort should be maintained (Figure 3-17, left). Grasshopper provides a limited list of passive strategies, that can be projected into the Psychrometric chart. Additional data, such as the percentage of time that HVAC is not necessary, is also available (Figure 3-16).
Figure 3-16: Passive strategies available in Ladybug (left-centre component), and total comfort percentage (top-right panel).
45
DESIGN SCENARIOS
Figure 3-17: Psychrometric chart, without passive strategies (left), and with passive strategies (right).
Natural ventilation, thermal insulation to preserve internal heat gains, and using mechanical fans were selected as effective passive strategies (Evaporative cooling is considered a popular and effective strategy as well, but due to its significant water consumption, it is ruled out here). Natural ventilation and heat gains are directly related to the orientation of building in regard to wind speed/direction and solar radiation. Ladybug offers highly customized wind and solar radiation charts (called Rose, Figure 3-18), that can accommodate a whole year, or a specific analysis period, or tailored based on conditional statements (e.g. a temperature range). In this scenario, the goal is to avoid harsh cold winter or hot summer winds while taking advantage of moderate breezes in summer (Figure 3-19 and Figure 3-20). Also, orienting building for maximum solar heat gain is regarded as an effective passive strategy to minimize heating loads in winter (Figure 3-21).
Figure 3-18: Wind Rose, with projected wind speed (left), and outdoor Dry Bulb temperature (right).
46
DESIGN SCENARIOS
Figure 3-19: Desired wind directions for ventilation in summer (wind speed between 2 to 10 m/s, and Dry Bulb temperature between 20 to 27 Cº).
Figure 3-20: Undesired cold or hot wind directions in a whole year (Dry Bulb temperature lower than 19 Cº and higher than 28 Cº).
47
DESIGN SCENARIOS
Figure 3-21: Radiation Rose for summer (left) and winter (right).
The Western side of the building faces should be protected against harsh and fast winds (Figure 3-18), despite the fact that it also offers frequent pleasant drafts. A north-western to south-eastern direction offers enough draft for ventilation (Figure 3-19) while avoiding harsh winds and undesirable evening sun in summer (Figure 3-21). Therefore, it is assumed as the preferred front for orienting large swaths of building envelope surfaces. The actual modelling was done inside Rhino viewport, in order to take advantage of Rhino’s versatile surface manipulation tools. Changes to design alternative models in Rhino are reflected in Grasshopper immediately and automatically, and the results of each small simulation calculation are fed back into Rhino viewport through Grasshopper’s Remote Control Panel (Figure 3-22). Therefore, designers are informed of implications of design decisions they make regarding the building mass in real-time. In this scenario, total floor area and total solar radiation falling on building envelope are provided as criteria for informing the design process. Moreover, real-time visualization of radiation fallout is provided inside Rhino viewport as well, to help identify surfaces and geometrical configurations that fulfil desired criteria (in this case, maximum solar radiation fallout).
48
DESIGN SCENARIOS
Figure 3-22: Grasshopper's Remote Control Panel (left) offers a real-time glimpse into results inside Rhino.
Grasshopper allows for storage of design alternatives as referenced Breps, for comparison (Figure 3-24) or further operations, such as performing a full energy simulation or doing a render for visualization purposes. Also, with the help of a simple mechanism, it is possible to switch between design alternatives with one click (Figure 3-23).
Figure 3-23: Switching between design alternatives.
49
DESIGN SCENARIOS
Figure 3-24: Comparison of design alternatives.
3.1.5
Design scenario IV
Title: Optimization of solar irradiation for a vertical garden tower with Honeybee and Galapagos Context: Tokyo, Japan. Description: A proposed vertical farming tower in the heart of Tokyo. Architects need to know the optimized rotation angle of each floor relative to a structural spine, in terms of maximum direct solar radiation falling on planted vegetables. Objective: •
Developing an entirely parametric form generation model ready for Performance-based design inside Grasshopper [IIKB];
•
Finding optimized form based on a performance criterion [IIKB].
Workflow: Final design is imagined as a number of slabs acting as agricultural fields, organized vertically along a spine curve. The spine curve is made out of five control points, three of them can shift along an axis. The rotation angle of each slab relative to its geometrical centre (that is also the intersection point between horizontal slabs and vertical spine curve) is a function of curve tangent at the intersection point. As control points are shifting along their designated axis, curve tangent and thus rotation angle of each slab changes as well (Figure 3-25).
50
DESIGN SCENARIOS
Figure 3-25: Schematic showing three control points along spine curve and their movement allowance.
First direct solar radiation fallout simulation is done with spine curve in its original state, yielding a total 1059 kWh direct solar radiation fallout on slabs for a whole year (Figure 3-26):
Figure 3-26: Original configuration of slabs, with direct solar radiation, visualized on surfaces.
51
DESIGN SCENARIOS
In order to find an optimized form based on maximum direct solar radiation, Galapagos, an Evolutionary Solver built inside Grasshopper is used. Galapagos is a single-objective solver, capable of controlling parameters (mainly numerical sliders inside Grasshopper) called Genomes, to minimize or maximize value, called a Fitness function. Galapagos is very easy to use, as soon as the underlying concept is understood. After assigning Genomes, and specifying whether the Fitness function should be maximized or minimized, Galapagos feeds random numbers from a seed of generations to input parameters (Genomes) and monitors the result value (Fitness). Based on initial results, Galapagos determines which generations (or more simply, the range of input values) better serve the purpose of optimization, and assigns more efficient input values in next generation. This process continues till new generations don’t yield better results comparing to their parents. At this point, an optimized result is obtained and saved for further use. In this scenario, Genomes are parameters that determine the location of three control points along the spine curve, and the floor height for the tower (vertical distance between two slabs). The Fitness function is to maximize direct solar radiation fallout. Every time Galapagos changes an input parameter, Ladybug’s solar radiation component runs with new data, and results are stored automatically. In this scenario, it took Galapagos only about 90 generations to find the optimum results.
52
DESIGN SCENARIOS
Figure 3-27: Galapagos window in the peak of its evolutionary operation (top), and after reaching an optimized range (bottom).
In the end, Galapagos sets input parameters for optimum configuration. If the formal result of this optimum state is not satisfactory, for example, because of aesthetic considerations or construction issues, Galapagos provides a list of other configurations that are very close to the optimum state. In this scenario, Galapagos was able to increase direct solar radiation fallout up to %6 (1024 kWh for a whole year) (Figure 3-28).
53
DESIGN SCENARIOS
Figure 3-28: Optimized configuration for maximum direct solar radiation, obtained with Galapagos Evolutionary Solver.
54
DISCUSSION
4
DISCUSSION
4.1
Overview
This chapter concerns itself with a thorough analysis of usability and usefulness of Ladybug Tools, as experienced within the framework of design scenarios in chapter 3. Such analysis is based on the subjective experience of research’s author during the implementation of afore-mentioned design scenarios. Each of five primary criteria described in section 1.4 constitutes a separate section, and they are themselves consisted of several sub-criteria.
4.2
Usability
Usability refers to the ease of use of software, for a particular group of users in a specific field or function (please refer to section 1.4.3.1). Usability criterion consists of learning curve, efficiency and ease of data input methods, flexibility and diversity of outputs, error system, and help and documentation. 1. Learning Curve a. Grasshopper is based on two paradigms, parametric design and visual programming, both new to the majority of architects. Therefore, the learning curve is steep, as a user should not only learn Grasshopper’s internal mechanisms but also concepts and principles of parametric design as well. Among them all, data management in Grasshopper is the most crucial to learn, and the hardest as well. b. Another important difference between traditional modelling tools and Grasshopper is that the former works with geometry, while the latter is mostly concerned with data and doesn’t allow direct selection and manipulation of geometry, as in other CAD environments. Understanding this notion takes quite a time for beginners. c. Many operations that can be done with one or a few clicks inside traditional CAD environments need creating a tiny algorithm inside Grasshopper. Moving, rotating, copying, sorting, and specially selecting parts
of
a
model
are
examples
of
such
operations.
Though
Grasshopper’s approach allows for an unprecedented amount of versatility and speed, especially in case of complex operations, it takes more time to perform simple operations than traditional CAD software. 55
DISCUSSION
d. Grasshopper is integrated fully inside Rhino, a modelling environment well known among architects. Rhino fashions a close resemblance of AutoCAD environment, and thus makes it easy for the majority of users to learn and work with it. Grasshopper modelling and analysis components are mostly on their Rhino counterparts. e. Ladybug Tools demand some basic knowledge about building’s physics and building performance indices. Also, for more advanced simulations, knowledge of EnergyPlus or Radiance/Daysim is necessary. Such requirements make parts of Ladybug Tools hard to use for some users. 2. Data input a. Diversity of data input methods: Grasshopper offers visual and nonvisual methods for data entry: i. Referencing geometry from Rhino is relatively easy and fast. Different parameter containers are available to import planes, points, curves, surfaces, solids, and meshes. Two general Geo and Brep containers are also available to reference sets of Rhino geometry made from different geometry types; ii. Using sliders, counters, mapper graphs, drop-down lists, switches and toggle buttons, etc. for non-geometrical data entry. The value stored in these components can be easily modified by user to influence parts or whole operation (Figure 4-1);
Figure 4-1: Different data input components in Grasshopper.
56
DISCUSSION
iii. Weather files can be imported directly from the internet through a URL, from a map of locations (Figure 4-2), or from any physical storage location.
Figure 4-2: Ladybug can import weather files from the internet with a single click (source: http://www.ladybug.tools/epwmap/).
b. Data entry facilitation: Ladybug offers many default values to speed up modelling process. User schedules and HVAC settings are set automatically based on zone’s architectural program. Constructions types are set automatically based on each surface type. It is possible to skip setting zone program and other specifications altogether for a fast simulation. Honeybee includes standard material libraries for both EnergyPlus and Radiance. List of architectural programs in Honeybee is quite extensive, but not comprehensive. Ladybug offers a short list of passive strategies which can be selected individually or in combinations, but the options are limited (Figure 4-3). The user can save frequently used components in a template to save time when starting a new simulation.
Figure 4-3: Passive strategies built into Ladybug.
57
DISCUSSION
c. Data verification: i. Geometry: Honeybee provides a decomposition of geometry based on zone type or surface type, making it quite easy to verify assigned surface types visually by colouring them (Figure 3-7). Extensive labelling is also possible to tag data associated with a surface on top of it, but in case of complex geometry, tags can get messy and illegible. Selecting a specific part of geometry for verification takes some effort, as it is not possible to use traditional selection methods inside Rhino viewport, and any selection operation inside Grasshopper needs working with data sets and trees (As a reminder, Grasshopper works with sets of data rather than geometry itself); ii. Non-geometrical data: Panel component inside Grasshopper offers an easy method to represent and verify all sorts of data (Figure 4-4).
Figure 4-4: Panels offer a convenient way for reviewing and verifying data in Grasshopper.
iii. Definition organization: Grasshopper definitions can become too big and complex, and wires can make them look too messy. Grouping and labelling are available to make the whole modelling process more understandable, especially for users who work on the definition later (Figure 3-1). 58
DISCUSSION
3. Simulation Output: a. Visual outputs: Ladybug and Honeybee offer a wide range of charts and visualizations in both 2D and 3D, made specifically with architects in mind (Figure 2-14 and Figure 2-18). All charts and visualizations are highly customizable through manipulating their visual components. Pie charts are missing from Ladybug visualization arsenal. Conditional statements and analysis periods allow for limiting representation only to a demanded portion of data, based on a single criterion or a combination, e.g. customizing visualization for a certain temperature range (Figure 3-19 and Figure 3-20). Moreover, Ladybug provides a list of gradient tailored to the visual convention of building design and construction industry. Visual outputs can be saved as both raster and vector files for further use in reports and presentation, right inside Rhino viewport. Components are available to perform data preparation operations like separating text from numbers, calculating averages based on day, month or year, and normalizing data according to the area. It is easy to generate
separate
visualizations
according
to
different
data
(temperature, humidity, etc.), though in slower machines it might affect the workflow with long delays. All visualizations are automatically updated with any change in input data, a feature that can be turned off to improve the efficiency of workflow in case of lack of computing power. b. Reports and non-visual outputs: Ladybug tools don't offer any report generation tools. Although it might be perceived as a deficiency, it is in line with the main premise of the software, that is mainly focused on visual outputs suited to early design stages. Numerical and text outputs can be accessed inside Grasshopper canvas easily with the help of panels. 4. Error Notification: a. The frequency of errors: Errors can happen with a large frequency in Grasshopper, mostly because of data type mismatch. Most of these errors are easily identifiable and correctable. Nevertheless, due to algorithmic nature of Grasshopper, syntactic and semantic errors are common. Ladybug and Honeybee add their own set of errors to this. In Ladybug, most occurring errors are also because of data type mismatch. Honeybee suffers from more complicated error malfunctions, as it is dependent on external simulation engines.
59
DISCUSSION
b. Fatal/irreversible errors: In general, any error in a Grasshopper definition will affect all operation coming after it in the algorithm, and thus it can disrupt part or whole of definition’s function. But in many cases, a problematic operation can go unnoticed and affect the results with no warning or halting of operation. One area that is prone to this sort of invisible errors includes massing, zoning, adjacency calculations and glazing creation in Honeybee. The common errors are the wrong type of surfaces (for example, roof type is assigned to a wall because of its angle), the incomplete creation of glazing, or missing a thermal zone. Therefore, it is necessary to check the geometry before running the simulation. Errors caused by EnergyPlus/Radiance/Daysim halt the whole operation. Another annoying type of errors happen when excessive data operation happens, or data is channelled to a wrong branch of the algorithm. These errors usually take too long to surface, and they create the illusion that everything is working fine and definition only needs a lengthy period of time to calculate. Finally, in case of complex geometry, both Honeybee and Ladybug can interrupt their operations because of running out of memory. c. Identification of errors:
Grasshopper is equipped with an internal
visual error detection system, based on colouring faulty components and wires (Figure 4-5). This makes finding the source and description of the issue quite easy, even inside complex definitions. Moreover, most faulty components display an error notification balloon, with error description (Figure 4-6). There are two sorts of error descriptions in Ladybug and Honeybee, the first one is built into the component by its author, and the second is internal Python error message. The former is usually informative (e.g. there is not enough space for the creation of glazing), while the second ones can be confusing (e.g. “Error solution exception” or “Runtype error nontype”). Errors happened during the EnergyPlus run are available through a panel, but their interpretation needs a deep knowledge of EnergyPlus itself.
Figure 4-5: Grasshopper colours components based on their functional state.
60
DISCUSSION
Figure 4-6: Example of an error notification balloon with the error's description.
5. Help & Documentation: Ladybug and Honeybee benefit from the extensive documentation, inside Grasshopper canvas and on the internet. Almost all Ladybug Tools’ components are delivered with a clear explanation of what they do, detailed input/output descriptions, and in many cases, the scientific basis of the operation, and where and when it could be helpful to designers (Figure 4-7). All of these explanations are also available in Ladybug and Honeybee Primers in online and Offline formats. Ladybug forums offer a dynamic place for users to ask for help and exchange their definitions and solutions. In the processing of writing this thesis, the author asked several questions on the forum, all of which were responded satisfactorily within a couple of hours.
Figure 4-7: Description of Ladybug's Adaptive Comfort Calculator inside Grasshopper inside a pop-up.
61
DISCUSSION
4.3
Intelligent design knowledge-base
Intelligence design knowledge base criterion consists of two sub-categories: Embracing design stages and Supporting decisions. 1. Compliance audits:
Ladybug and Honeybee don't offer any certificate
compliance audits at the moment. 2. Embracing design stages: Ladybug and Honeybee target different stages of design process. Ladybug is more accustomed to early design stages, including site and climate analysis preceding formal design. Honeybee usually comes in handy in more advanced design stages, when validated simulations are necessary to assess initial design decisions’ impacts on building performance. The important aspect of Ladybug and Honeybee workflow is they offer a seamless transition among various design stages, as they both are part of a single package (separated for organizational clarity and ease of further development). This means that all design stages can be supported inside a single environment, even inside a single definition. Such an integrated structure eliminates the need for using different modelling environments and simulation packages. This structure is reflected by Ladybug Tools interface. Ladybug’s interface is organized according to design stages, starting from understanding the site and climate, deciding on proper design strategies, analyzing early massing concepts inside their spatial and climatic environment, and finally assessing the efficiency of renewable energy strategies. Honeybee’s interface is ordered as to prepare a model and perform performance-related simulations easier. The toolbar in Honeybee starts from preparing the massing, zoning, and glazing then proceeds to introduce further specifications like Daylight recipes, or constructions, schedules and HVAC systems. Based on design demands, many of follow-up preparation stages might be omitted in order to get results faster. Finally, Honeybee offers a connection to more advanced simulation operations through OpenStudio, Therm and Foam (Figure 4-8).
62
DISCUSSION
Pre-design site analysis l eads to i nformed general decisions about bui lding form and bui lding systems
Fi rs t formal design opti ons are introduced a s massing concepts, a nd tested inside their context for their performance
Fi rs t assumptions about fea sibility a nd efficiency of renewable are made
More detailed formal design
Si mulations are used to a s sess the validity of design decsions
Fi nal design decision ca n be subjected to more a dvanced perforamance s i mulation tasks
Figure 4-8: Ladybug and Honeybee are structured to reflect and accommodate various stages of design.
3. Supporting decision making: a. Weather and context-based early advice: Ladybug offers a diverse range of data regarding both climate and view analysis in early stages, including thermal comfort indices and implications of passive design strategies on heating/cooling demands. But the interpretation of this information is left to the user, as there is no clear ‘advice’ offered by Ladybug itself. b. Form optimization: Due to parametric nature of Grasshopper and Ladybug Tools, form optimization operations can be performed with relative ease, even for complex scenarios. Whole building (optimizing building rotation or envelope for solar radiation), or parts of it (optimizing shading depths for more thermal comfort or less glazing) can be the subject of optimization. Form optimization can be conducted either by manipulating input data manually to reach the desired state (e.g. 63
DISCUSSION
changing input sliders or playing with geometry inside Rhino) or with available optimization algorithms like Galapagos. c. Solution generation: A comprehensive solution generation that could create geometry based on a set of criteria is not directly built into Ladybug Tools, and it doesn’t seem to fit into the scope of this software. But Grasshopper’s flexible programming environment enables advanced users to develop their own form generation algorithms that include performance-based agents as well. Nevertheless, automatic generation of the solar fan and the solar envelope is built into Ladybug, and generated surfaces can be employed as part of the formal design. Moreover, both Ladybug and Honeybee offer simple shading generation components that generate shading surfaces based on desired shading settings.
4.4
Accuracy and ability
This criterion addresses modelling and simulation features of Ladybug Tools. 1. Comprehensiveness: Ladybug Tools offer tools for two domains of building performance, thermal and visual. The list of features included in the package is long and includes most of the tools an architect might need to simulate building performance such as weather-based visualizations, thermal simulation with EnergyPlus, lighting and Daylighting simulation with Radiance and Daysim, simulation of windows efficiency and thermal bridges with Therm, and advanced thermal CFD simulations with OpenFOAM. Although acoustical performance simulation is not included in the package, it can be integrated into simulation process through a Grasshopper App, Pachyderm Acoustics. Moreover, Ladybug Tools can benefit from other domains of building simulation, like structural calculations, inside greater Grasshopper ecosystem. All of these features are available hand in hand with Rhino and Grasshopper modelling capabilities, distinguishing Ladybug Tools from many other BPS tools in which modelling and simulation workflows are divided between separate software or separate workflows inside a single environment. 2. Accuracy/Validity: a. Ladybug:
Ladybug’s main task is visualizing the content of an
EnergyPlus weather file. Therefore, it is mainly an interpreter/visualizer interface rather than a simulation software. In this regard, Ladybug is as
64
DISCUSSION
accurate as the content of weather files, and validity of mathematical formulas underlying its operations. b. Honeybee:
Honeybee completely depends on validated external
simulation engines, EnergyPlus and Radiance, for its operations. 3. Processing Complex Forms: a. Ladybug: In general, Ladybug can work with highly complex surfaces and meshes without any problem. Indeed, the computation time increases dramatically for curvature surfaces, but nevertheless, most of the visualizations that work with surfaces (shade benefit, shadow range, solar fan and envelope, solar radiation on surfaces, etc.) are computed in a rather short time. b. Honeybee: i. Honeybee’s internal zoning and glazing tools: Honeybee can’t handle curvature surfaces properly. While solving adjacencies, Honeybee tries to subdivide the curvature surface into smaller planar surfaces (a process called meshing). Depending on the shape of original curvature surface, resulted planar surfaces can have many different angles relative to the ground plane. Honeybee, then, can’t decide correctly if subdivision surfaces within a certain range of angles belong to a slanted wall or an angled roof! Another problematic component is automatic glazing creation. If surface adjacencies didn’t identify surface types correctly in previous stages (which is often the case with curvature surfaces), glazing generation fails. Second, as glazing creation is based on the separate glazing-to-wall ratio for each cardinal direction (east, west, south, north), if geometry itself doesn’t provide clear distinctions between building envelope surfaces facing each cardinal direction, the operation fails or results in a strange pattern of windows. ii. EnergyPlus: In theory, EnergyPlus is able to tackle most complex forms thorough subdividing them into small planar surfaces, but in practice, even a simple non-curvature non-planar surface increases simulation type so much that makes the whole simulation process impractical. 4. Supporting New building technologies: Ladybug Tools offers a limited set of built-in building systems like PV and solar panels, wind turbines and earth cooling tubes. Due to the expandable architecture of Grasshopper, it is possible 65
DISCUSSION
to introduce emerging building systems with either a combination of components or direct Python coding inside Grasshopper’s canvas. Examples of such systems, such as double-skin facades or adaptive building envelopes can be found in Ladybug forums. Novice users are able to recreate or copy/paste these definitions so as to incorporate desired building systems inside their own models.
4.5
Interoperability
Interoperability has not been addressed within design scenarios in this research. Nevertheless, with the help of information available on the Internet, the extent of Ladybug Tools interoperability is discussed in this section. It is noteworthy that any discussion of interoperability inside Ladybug tools inevitably includes Rhino and Grasshopper ecosystem features relevant to exchange of data among various software platforms. Due to data-based nature of Grasshopper, collecting and converting data from different sources is quite easy with Apps and extensions, which makes it possible to incorporate various software platforms and external interfaces (3D printing, machine control interfaces, robotic arms, etc.) within design and simulation operation, all inside a single definition. 1. Import/Export: a. Thorough Rhino: Rhino benefits from a wide range of import/export options. Almost all popular 3D formats are available, i.e. 3DS (3D Max), OBJ, LWO (Lightwave), SKB (Sketchup), DWG/DXF (CAD platforms), DGN (Microstation), and VRML (Virtual Reality platforms). As soon as a model is imported inside Rhino successfully, it is possible to reference and use it inside Ladybug Tools. b. Inside Grasshopper: A number of Apps available on Food4rhino extend Grasshopper’s ecosystem to include reading and writing CSV and Excel formats,
gbXML and IFC import/exports, 3D printing and digital
fabrication formats, and GIS and other geographical data formats. c. Inside Ladybug Tools: Ladybug Tools include export options for OpenStudio, Therm & Windows, and OpenFOAM. Moreover, with the help of GrizzlyBear, simulation models with all of their thermal properties can be exported to gbXML. Importing gbXML files as Honeybee zones is also possible inside Honeybee. 2. Data Exchange: Flux.io is a cloud-based platform for Grasshopper which offers live data exchange between Grasshopper and Sketchup, Revit, AutoCAD, and 66
DISCUSSION
3DS Max (in addition to Excel and Google Sheets). Data connection is bidirectional and live, meaning any change to geometry in any of these platforms is reflected automatically in all other connected platforms. For example, the user can build the initial model in his or her software of choice, like Sketchup, connect it to Ladybug tools for performance assessment and optimization. Any geometrical tweaking that happens as a result of performance assessments is reflected in Sketchup model immediately. Also, as Ladybug and Honeybee visualizations are essentially data projected on Rhino meshes, they can be reused inside Sketchup or 3DS Max for more advanced rendering and presentation purposes. 3. BIM: ArchiCAD, Rhino and Grasshopper can all be connected in real-time with Graphisoft’s plugins. It is possible to model geometry with ArchiCAD’s native BIM elements right inside Grasshopper, and converting different surface types created by Honeybee zoning tools to ArchiCAD’s native BIM elements is relatively easy. Multiple Apps for Grasshopper are available which offer the same live connection between Grasshopper and Revit. Finally, both Rhino and Grasshopper come with their own native BIM packages (VisualARQ for Rhino and Grevit for Grasshopper).
4.6
Integration into building design process
This criterion discusses the two sub-criteria that facilitate meaningful use of simulation within design process: Real-time feedback and Evaluation of simulation results. 1. Real-time feedback: Grasshopper’s architecture is set so that any change in any part of the definition is reflected automatically and immediately in ‘proceeding’ parts. So-called changes include direct manipulation of geometry inside Rhino, adjustments to parametric generation of geometry inside Grasshopper, modifying specifications like constructions, schedules, HVAC and renewables, tweaking visualization and simulation parameters inside Ladybug Tools or other connected Apps, customization of graphics, or switching parts of definition on or off, thus introducing substantial changes to nature of operation. Ladybug components are relatively fast, and their outputs, whether numeric or visual, can be used in parallel to modelling process, inside Grasshopper or in a Rhino viewport. Honeybee lags behind Ladybug in terms of real-time feedback, mainly because it is dependent on the computational speed of external simulation engines. Nevertheless, in case of simple models with planar 67
DISCUSSION
geometry, and a powerful computer, users can expect results of changes made to geometry in a fraction of a minute. An especially useful feature of Grasshopper, Control Panel, provides the user with all variables, information and numerical simulation results right inside Rhino, informing the user about performance-related implications of design decisions. Despite its relatively slower speed, Honeybee takes advantage of Grasshopper’s Pipelines, which makes the user able to add, remove or modify the geometry and leave the rest of the work to Honeybee with no further manual adjustments necessary for the simulation to run properly. Indeed, all above scenarios depend on enough computational power available, and in case of Honeybee’s EnergyPlus simulation, a fast hard-drive. 2. Evaluation: Any number of design alternatives can be produced inside the same Rhino file and Grasshopper definition. Comparison of performance indices or visualization for design alternatives is quite easy, as Grasshopper offers data recording capabilities. Therefore, any change to geometry that leads to new simulation results can be recorded and then visualized either independently or in a layout with other alternatives. Ladybug Tools doesn’t offer any presentation layouts or built-in component to arrange visualizations side-by-side, but with a simple Move or Array component, results can be arranged for comparison inside Rhino Viewport. A primitive Bar Chart component is available for rapid comparison of numerical results, though it is too simple for presentational materials. In addition to features above, Grasshopper allows for fast selection of data sets (a design alternative to be fed into simulation process, or the result of a simulation like an index or a chart). Therefore, users can go through all design options smoothly and assess their relevance to design goals. With a simple operation, it is also possible that Grasshopper chooses a design alternative automatically, based on a set of criteria, and then feed it to another operation, e.g. rendering the alternative that offers more shading, or submitting most efficient glass envelope to a structural simulation and optimization App.
4.7
Summary of criteria’s assessments
In order to summarize the assessment findings for each criterion, a score was assigned to them, based on subjective evaluation of how each criterion contributes to Usability and usefulness of Ladybug and Honeybee within the architectural design process. The left side of score scale indicates a negative assessment score, and the right end represents a positive assessment score. One criterion, Compliance audits, 68
DISCUSSION is assigned zero, as Ladybug and Honeybee don’t offer any compliance reports. The result of this assessment is represented in Figure 4-9.
Figure 4-9: Summary of individual assessments for each criterion
69
DISCUSSION
4.8
Analysis of assessment’s findings
Grasshopper’s visual programming interface, and its underlying concept, parametric modelling, can be hard to grasp, and somehow messy and incomprehensible for architects used to more traditional methods of formal representation, e.g. paper drawings and CAD software. The learning curve is usually too steep, and it includes many seemingly irrelevant subjects like data management, matrix operations and vector math, none are considered necessary for working with a traditional CAD software. Parametric nature of GH/LB/HB facilitates dynamic data input, an obstacle in most traditional BPS tools, and diversifies types of data that would influence design decisions. Visualizations and simulation outputs are diverse as well, highly customizable, and are developed mainly based on architect’s expectations, visual mentality and needs during different design stages, though users who expect compliance reports or financial aspects of building performance will be disappointed by lack of such features. Ladybug Tools benefit from a vibrant developer and users’ community willing to offer theirs, with an acceptable level of documentation available. Error system could be a nuisance, especially for beginners, and identifying and fixing errors of both syntactic and semantic nature takes a significant part of users’ time. Ladybug Tools offers unprecedented versatility and expandability in comparison to more traditional propriety and free BPS software which come with a fixed set of tools. Users can adapt Ladybug and Honeybee components to their own specific needs, or develop original algorithms for performing complex tasks and simulate emerging or theoretically possible building forms and systems, that would not be introduced to commercial BPS packages for a long time. Ladybug Tools, and especially Ladybug part of it, provide necessary information to architects from earliest stages of design, inside modelling environment, therefore, make it possible to pre-rationalize influential performance-based design decisions regarding form and systems, parallel to other considerations like aesthetics, function, and structural concerns. Thanks to default values and Honeybee’s massing and zoning tools, performing basic thermal and visual simulations won’t take too much time compared to most mainstream BPS tools. As a further matter, the process of zoning can be set in a way that any changes made to current thermal zones, or even adding or removing thermal zones would be processed and simulated automatically with minimum effort on the part of architect, thus making playing with design ideas more efficient and productive, especially in early stages of design process. 70
DISCUSSION
With the help of Ladybug tools, architects can assess the performance impact of each decision while working on the model. Changes to model, its specifications and simulation parameters are reflected in results automatically, and in the shortest time, due to the streamlined flow of data through a GH’s definition. This essential feature makes sure that the impact of each design decision is observed (almost) immediately, reducing the amount of time and energy wasted by correcting or retracting less suitable decisions in later stages. Within GH/LB/HB, it is possible to create, evaluate and compare several design alternatives in a single file. Though there is no built-in mechanism to evaluate simulation results or arrange result visualizations side-by-side, both tasks are easy to perform with a basic understanding of GH’s visual programming concepts. Moreover, Grasshopper offers a diverse range of form generation and optimization provisions to help designers reach decisions based on a multiplicity of criteria coming from different domains of design and construction. Ladybug and Honeybee lack any notional building, advice centre, best practices, or any sort of baseline index values that would help make meaningful comparisons. Although essentially an interface for EnergyPlus and Radiance/Daysim, performing a highly detailed simulation with Honeybee is difficult and time-consuming. Selecting a part of the model (especially a single surface in a complex model) for changing its construction type, or add manual glazing demands an understating of GH’s data management concepts. Besides, Honeybee’s massing, zoning and glazing creation tools don’t work properly in all cases, in particular for nonplanar surfaces, and models with many recognizable cardinal sides. Nevertheless, users can export their model directly to EnergyPlus, or to Openstudio for more advanced and detailed simulations, for example, certificate compliance simulations in final stages of design. Grasshopper’s flexible and dynamic ecosystem, hand in hand with Rhino’s modelling capabilities and rich list of thermal and visual simulation options available in Ladybug Tools make sure that architects can address most of their building performance-related questions inside a single environment, in a single file, and with high degree of validity and versatility, while avoiding unnecessary interruptions, problems with data compatibility and time-consuming confusions arising from the need to learn and work with different software platforms.
71
CONCLUSION
5
CONCLUSION AND RECOMMENDATIONS
Ladybug and Honeybee offers a different discourse in building performance simulation, and due to this very novelty, it is still a work in progress. This discourse is distinguished from more traditional approach mainly in the sense that it offers versatility and dynamism missing in many mainstream BPS tools. Ladybug and Honeybee’s highly customizable parametric nature encourages playfulness and offers courage to experience with elements of building performance. Such an attitude comes in handy in two settings: firstly, academic and research circles where it is important to go beyond the established methods and to introduce new forms and systems into performance simulation, and secondly, in early design stages where design ideas are taking shape through an interdisciplinary approach. Parametric nature of Ladybug and Honeybee welcomes performance-driven agents into an even field of play, populated with other formal and non-formal design forces. Therefore, it contributes to the discourse of Performance-based design, or at least provides a starting point and a modelling environment proper for that approach. In a more practical level, Ladybug and Honeybee provide most of the tools an architect might need to address performance in the architectural design process, in an integrated workflow inside a visual environment. This research asserts that Ladybug and Honeybee are best suited to early stages of design more than other BPS tools, as it provides performance-related information in a proper format, when and where these sorts of information are needed. The focus of Ladybug and Honeybee is not on getting the numbers (simulation results) and creating reports but rather more on providing an informing picture of the role of performance in architectural design. Indeed, getting the numbers is also possible, and in most cases quite easy, as the Ladybug and Honeybee are based on validated simulation engines. But this research argues that it will be a strong mandate to take up the task of learning Grasshopper and Ladybug and Honeybee for an ordinary user who only needs to do routine simulation tasks. Indeed, Ladybug and Honeybee can work as a bridge between addressing performance in early stages of design and performing whole-building simulation in final stages for financial assessment and certificate compliance. Two obstacles are identified to be on the way of more professional use of Ladybug and Honeybee: underlying parametric design concepts, and its visual programming interface. Ironically both notions must as well be considered as Ladybug and Honeybee’ main strengths. It is hard to imagine that Ladybug and Honeybee, in its current shape, will gain popularity as a viable substitute for traditional BPS tools in 72
CONCLUSION the profession, and it doesn’t seem that this was ever a target for its developers. But Ladybug and Honeybee offer unprecedented power and flexibility to practices which aim to experience with performance-based design and innovate new formal possibilities and building technologies. Finally, Ladybug and Honeybee is a suitable building performance simulation software to teach architecture students about performance-based design, in a parametric modelling environment currently so popular in academic circles. This research was done based on comprehensive literature review and assessment of usability and usefulness of Ladybug and Honeybee in the architectural design process, based on subjective conclusions made by its author. The rationale behind this approach was two-fold: first was the limited timeframe and exploratory scope of the research, and second was that the number of available architects and architecture students familiar with the use of Ladybug and Honeybee is still not enough for conducting a more objective assessment. Furthermore, as the author of this research does not claim advanced skills in Grasshopper, more complex design scenarios were not included in this research. Moreover, finally, due to limited nature of design scenarios, one of the main criteria, Interoperability, was not addressed properly, and its assessment was made based on literature review and practical resources available on Ladybug and Honeybee. As a future research path, an objective and quantifiable research methodology is suggested, with more diverse design scenarios conducted in both academic and professional settings. Moreover, integrating performance simulation with other domains of building design and construction, like structural design or digital fabrication can broaden the scope knowledge pertinent to multi-agent performancebased design. Finally, integrating of BIM elements with Grasshopper and Ladybug and Honeybee shall be considered a future research topic that might open new doors to the application of parametric performance-based design in architectural offices.
73
INDEX
6
INDEX
6.1
List of Figures
Figure 2-1: Comparison of Python code and its corresponding Grasshopper construct for drawing a sine curve (source: (Mode Lab 2015))................................. 17 Figure 2-2: Components can be dragged from the toolbar and dropped into the canvas (source: www.rhino3d.com)........................................................................... 19 Figure 2-3: Grasshopper canvas superimposed on Rhino window, with a definition and
its
live
geometrical
representation
in
Rhino
viewport
(Source:
www.arch2o.com). ..................................................................................................... 19 Figure 2-4: A Grasshopper definition ......................................................................... 20 Figure 2-5: Numerical Slider (left) and Graph (right), two examples of dynamic data input components in Grasshopper. ............................................................................ 21 Figure 2-6: A Grasshopper definition with static geometrical Parameter and dynamic Numerical Sliders and Graph Mappers (source:(Mode Lab 2015)). ......................... 21 Figure 2-7: Grasshopper tabbed toolbar with native components and installed Apps. .................................................................................................................................... 22 Figure 2-8: Convergence as a parametric design approach in Performance-based design. ........................................................................................................................ 22 Figure 2-9: Ladybug (left) and Honeybee (right) icons in Grasshopper.................... 24 Figure 2-10: Ladybug, Honeybee and Grasshopper Ecosystem for building performance simulation (source: www.ladybug.tools)............................................... 25 Figure 2-11: Ladybug (source: www.grasshopper3d.com). ...................................... 26 Figure 2-12: A Grasshopper definition is performing shadow range analysis with Ladybug components (definition courtesy of Chris Mackey). ................................... 27 Figure 2-13: Ladybug workflow and main outputs..................................................... 27 Figure 2-14: Examples of Ladybug output visualizations (Courtesy of Chris Mackey). .................................................................................................................................... 28 Figure 2-15: Honeybee (source: www.grasshopper3d.com). ................................... 28 Figure 2-16: A Grasshopper definition for energy simulation (Courtesy of Chris Mackey). ..................................................................................................................... 30 Figure 2-17: Honeybee workflow and main outputs. ................................................. 30 Figure 2-18: Examples of Honeybee output visualizations (Courtesy of Chris Mackey). ..................................................................................................................... 31 74
INDEX
Figure 3-1: Grasshopper definition implemented for this design scenario, with annotations and colourful organization. ..................................................................... 34 Figure 3-2: Monthly average Dry Bulb temperature bar chart................................... 34 Figure 3-3: Wind Rose and Radiation Calla Dome. .................................................. 35 Figure 3-4: Psychrometric chart with passive strategies implemented. .................... 35 Figure 3-5: Automatic creation of glazing based on different glazing-to-wall ratios for cardinal directions. ..................................................................................................... 38 Figure 3-6: Automatic import of geometry, program assignment and thermal zone creation in Honeybee. ................................................................................................ 38 Figure 3-7: Geometry verification: glazing (top-left), conditioned/unconditioned zones
(top-right),
slab
types
roof/floor-ground
(bottom-left),
and
assigned
construction for Restaurant thermal zone (bottom-right)........................................... 39 Figure 3-8: Annual cooling/heating loads. ................................................................. 40 Figure 3-9: Total building energy balance. ................................................................ 40 Figure 3-10: Zone total cooling loads (left), and building surfaces' energy loss/gain (right). ......................................................................................................................... 41 Figure 3-11: Adaptive comfort map for the uppermost floor (top) and fourth floor (bottom). ..................................................................................................................... 41 Figure 3-12: Shading geometry generated on top of windows by Honeybee Shading Generator component. ............................................................................................... 43 Figure 3-13: Site plan (right) and Aerial Perspective for a residential tower. ........... 43 Figure 3-14: CDD and HDD hours displayed inside Grasshopper panels................ 44 Figure 3-15: Average monthly Dry Bulb temperature (with projected Adaptive comfort zone). ............................................................................................................ 45 Figure 3-16: Passive strategies available in Ladybug (left-centre component), and total comfort percentage (top-right panel). ................................................................ 45 Figure 3-17: Psychrometric chart, without passive strategies (left), and with passive strategies (right). ........................................................................................................ 46 Figure 3-18: Wind Rose, with projected wind speed (left), and outdoor Dry Bulb temperature (right). .................................................................................................... 46 Figure 3-19: Desired wind directions for ventilation in summer (wind speed between 2 to 10 m/s, and Dry Bulb temperature between 20 to 27 Cº). ................................. 47 Figure 3-20: Undesired cold or hot wind directions in a whole year (Dry Bulb temperature lower than 19 Cº and higher than 28 Cº). ............................................. 47 Figure 3-21: Radiation Rose for summer (left) and winter (right).............................. 48 75
INDEX
Figure 3-22: Grasshopper's Remote Control Panel (left) offers a real-time glimpse into results inside Rhino. ............................................................................................ 49 Figure 3-23: Switching between design alternatives. ................................................ 49 Figure 3-24: Comparison of design alternatives........................................................ 50 Figure 3-25: Schematic showing three control points along spine curve and their movement allowance. ................................................................................................ 51 Figure 3-26: Original configuration of slabs, with direct solar radiation, visualized on surfaces. ..................................................................................................................... 51 Figure 3-27: Galapagos window in the peak of its evolutionary operation (top), and after reaching an optimized range (bottom)............................................................... 53 Figure 3-28: Optimized configuration for maximum direct solar radiation, obtained with Galapagos Evolutionary Solver. ......................................................................... 54 Figure 4-1: Different data input components in Grasshopper. .................................. 56 Figure 4-2: Ladybug can import weather files from the internet with a single click (source: http://www.ladybug.tools/epwmap/)............................................................. 57 Figure 4-3: Passive strategies built into Ladybug...................................................... 57 Figure 4-4: Panels offer a convenient way for reviewing and verifying data in Grasshopper............................................................................................................... 58 Figure 4-5: Grasshopper colours components based on their functional state. ....... 60 Figure 4-6: Example of an error notification balloon with the error's description. ..... 61 Figure
4-7:
Description
of
Ladybug's
Adaptive
Comfort
Calculator
inside
Grasshopper inside a pop-up..................................................................................... 61 Figure 4-8: Ladybug and Honeybee are structured to reflect and accommodate various stages of design. ........................................................................................... 63 Figure 4-9: Summary of individual assessments for each criterion .......................... 69
6.2
List of Tables
Table 1-1: Usability and Usefulness assessment criteria.......................................... 14 Table 2-1: List of well-known Grasshopper's Apps for building performance simulation ................................................................................................................... 24
76
LITERATURE
7
LITERATURE
Anderson, K. , 2014. Design energy simulation for architects: Guide to 3D graphics . Retrieved April 13, 2016, from http://www.amazon.com/Design-Energy-SimulationArchitects-Graphics/dp/041584066X/ref=sr_1_1?ie=UTF8&qid=1460530107&sr=81&keywords=design+energy+simulation+for+architects Anton, I., and Tănase, D. , 2016. Informed geometries: Parametric modelling and energy analysis in early stages of design. Energy Procedia, 85, pp. 9–16. https://doi.org/10.1016/j.egypro.2015.12.269 Attia, S., Gratia, E., De Herde, A., and Hensen, J. L. M. , 2012. Simulation-based decision support tool for early stages of zero-energy building design. Energy and Buildings, 49, pp. 2–15. https://doi.org/10.1016/j.enbuild.2012.01.028 Attia, S., Hamdy, M., O’Brien, W., and Carlucci, S. , 2013. Assessing gaps and needs for integrating building performance optimization tools in net zero energy buildings design. Energy and Buildings, 60, pp. 110–124. https://doi.org/10.1016/j.enbuild.2013.01.016 Attia, S., Hensen, J. L. M., Beltrán, L., and De Herde, A. , 2012. Selection criteria for building performance simulation tools: contrasting architects’ and engineers’ needs. Journal of Building Performance Simulation, 5(3), pp. 155–169. https://doi.org/10.1080/19401493.2010.549573 Augenbroe, G. , 2011. The role of simulation in performance based building. Building Performance Simulation for Design and Operation, pp. 15–36. Burry, J., and Burry, M. , 2010. The new mathematics of architecture. Thames & Hudson. Retrieved from https://books.google.at/books/about/The_New_Mathematics_of_Architecture.html?id=B j0JRQAACAAJ&redir_esc=y Cetin, R. , 2010. Exploring the availability and usability of web-based building performance simulation tools. TU Wien. Retrieved from http://www.ub.tuwien.ac.at/dipl/2010/AC08399598.pdf Charles, P. P., and Thomas, C. R. , 2009. Four approaches to teaching with building performance simulation tools in undergraduate architecture and engineering education. Journal of Building Performance Simulation, 2(2), pp. 95–114. https://doi.org/10.1080/19401490802592798 Chronis, A., Liapi, K. A., and Sibetheros, I. , 2012. A parametric approach to the bioclimatic design of large scale projects: The case of a student housing complex . Automation in Construction, 22, pp. 24–35. https://doi.org/10.1016/j.autcon.2011.09.007 de Souza, C. B. , 2009. A critical and theoretical analysis of current proposals for integrating building thermal simulation tools into the building design process . Journal of Building Performance Simulation, 2(4), pp. 283–297. https://doi.org/10.1080/19401490903349601 Dehouck, R. , 2015. The maturity of visual programming. Retrieved May 5, 2017, from http://www.craft.ai/blog/the-maturity-of-visual-programming/ Dogan, T., Saratsis, E., and Reinhart, C. , 2015. The optimization potential of floor-plan typologies in early design energy modeling. Building Simulation Conference. Retrieved from https://stuff.mit.edu/afs/sipb/user/kolya/afs/root.afs/athena/dept/cron/project/sustainable designlab/publications/BS2015_FloorPlanOptimisation.pdf Evins, R. , 2013. A review of computational optimisation methods applied to sustainable building design. Renewable and Sustainable Energy Reviews, 22, pp. 230–245. https://doi.org/10.1016/j.rser.2013.02.004 Fisk, W. J. , 2000. Health and productivity gains from better indoor environments and their relationship with building energy efficiency. Annual Review of Energy and the Environment, 25(1), pp. 537–566. https://doi.org/10.1146/annurev.energy.25.1.537
77
LITERATURE
Heidegger, V. , 2013. EnergyFacade: Operational energy optimizing tool for conceptual facade design. Retrieved from http://repository.tudelft.nl/assets/uuid:922b1d5b-f8f845fb-aaea-c191a16cb8c0/EnergyFacade_2013.pdf Hemsath, T. L. , 2013. Conceptual energy modeling for architecture, planning and design: Impact of using building performance simulation in early design stages . Proceedings of BS 2013: 13th Conference of the International Building Performance Simulation Association, pp. 376–384. Retrieved from http://www.scopus.com/inward/record.url?eid=2-s2.084886645991&partnerID=tZOtx3y1 Hensel, M. U. , 2010. Performance-oriented architecture: Towards a biological paradigm for architectural design and the built environment. FORMakademisk, 3(1), pp. 36–56. Retrieved from http://www.formakademisk.org/index.php/formakademisk/article/view/65 Hensel, M. U. , 2013. Performance-oriented architecture: Rethinking architectural design and the built environment (Print). Chichester: Wiley. Hensen, J., Djunaedy, E., Radošević, M., and Yahiaoui, A. , 2004. Building performance simulation for better design : some issues and solutions. Plea2004 - The 21th Conference on Passive and Low Energy Architecture, (October 2015), pp. 19–22. Retrieved from http://citeseerx.ist.psu.edu/viewdoc/download?doi=10.1.1.527.3659&rep=rep1&type=p df Hensen, J. L. M. , 2004. Towards more effective use of building performance simulation in design. Proceedings of the 7th International Conference on Design & Decision Support Systems in Architecture and Urban Planning, pp. 2–5. Hensen, J., and Lamberts, R. , 2011. Building performance simulation for design and operation. Routledge. https://doi.org/0415474140 Holzinger, A., and Andreas. , 2005. Usability engineering methods for software developers. Communications of the ACM, 48(1), pp. 71–74. https://doi.org/10.1145/1039539.1039541 Hong, T., Chou, S. ., and Bong, T. . , 2000. Building simulation: an overview of developments and information sources. Building and Environment, 35(4), pp. 347–361. https://doi.org/10.1016/S0360-1323(99)00023-2 Jacko, J. , 2012. Human computer interaction handbook: Fundamentals, evolving technologies, and emerging applications. Retrieved from https://books.google.at/books?hl=en&lr=&id=dVrRBQAAQBAJ&oi=fnd&pg=PP1&dq=T he+HumanComputer+Interaction+Handbook&ots=wV5kibtth6&sig=k65PJPCFOIMdgfTxZv06b68U 9iM Jankovic, L. , 2017. Designing zero carbon buildings using dynamic simulation methods (Second Edi). New York: Routledge. Kolarevic, B. , 2001. Designing and manufacturing architecture in the digital age. 19th eCAADe Conference Proceedings, (Architectural Information Management), pp. 117– 123. https://doi.org/10.1260/147807703771799210 Lauridsen, P., and Petersen, S. , 2014. Integrating indoor climate, daylight and energy simulations in parametric models and performance-based design. In Proceedings of the 3rd International Workshop on Design in Civil and Environmental Engineering. Retrieved from https://books.google.at/books?hl=en&lr=&id=j3yDBQAAQBAJ&oi=fnd&pg=PA111&dq=l adybug+grasshopper+energy&ots=YEDdv6JWZ&sig=KhanjBsIGxyhynDAnZpqenpH9K0 Leach, N. , 2014. Parametrics explained. Next Generation Building, 1, pp. 1–10. https://doi.org/10.7564/14-NGBJ10 Lee, J., Gu, N., and Williams, A. , 2014. Parametric design strategies for the generation of creative designs. International Journal of Architectural Computing, 12(3), pp. 263–282. https://doi.org/10.1260/1478-0771.12.3.263
78
LITERATURE
Lin, S. H. E., and Gerber, D. J. , 2014. Designing-in performance: A framework for evolutionary energy performance feedback in early stage design. Automation in Construction, 38, pp. 59–73. https://doi.org/10.1016/j.autcon.2013.10.007 Madkour, Y., Neumann, O., and Erhan, H. , 2010. Programmatic formation: Practical applications of parametric design. International Journal of Architectural Computing, 7(4), pp. 587–604. https://doi.org/10.1260/1478-0771.7.4.587 Mahdavi, A., Feurer, S., Redlein, A., and Suter, G. , 2003. An inquiry into the building performance simulation tools usage by architects in Austria. Eighth International IBPSA …, pp. 777–784. Retrieved from http://www.ibpsa.org/%5Cproceedings%5CBS2003%5CBS03_0777_784.pdf Malé-Alemany, M., and Sousa, J. P. , 2003. Parametric design as a technique of convergence. Proceedings of CAADRIA, (2001), pp. 1–8. Retrieved from http://cumincad.architexturez.net/system/files/pdf/caadria2003_c1-4.content.pdf Milošević, D., Bajšanski, I., and Savić, S. , 2016. Benefits of the environmental simulations for the urban planning process. In 4th eCAADe International Regional Workshop. Retrieved from http://www.arhns.uns.ac.rs/4-ecaade-workshop/wpcontent/uploads/2016/06/eCAADeWorkshop_2016_Novi-Sad.pdf#page=25 Mode Lab. , 2015. The Grasshopper Primer (V 3.3). Portland: Robert McNeel and Associates. Retrieved from http://grasshopperprimer.com Naboni, E. , 2014. Integration of outdoor Thermal and visual comfort in parametric design. Proceedings of the 30th International PLEA. Retrieved from http://www.plea2014.in/wpcontent/uploads/2014/12/Paper_3B_2882_PR.pdf Negendahl, K. , 2015. Building performance simulation in the early design stage: An introduction to integrated dynamic models. Automation in Construction, 54, pp. 39–53. https://doi.org/10.1016/j.autcon.2015.03.002 Nielsen, J. , 1994. Usability engineering. Retrieved from https://books.google.at/books?hl=de&lr=&id=DBOowF7LqIQC&oi=fnd&pg=PP1&dq=us ability+engineering&ots=Bk95WOLVAT&sig=6k2UC4J_8O-09iri3K3PNlTFCsQ Orfanos, Y., Papadopoulos, D., and Zwerlein, C. , 2015. An integrated performance analysis platform for sustainable architecture and urban infrastructure systems . Retrieved from http://cumincad.scix.net/data/works/att/ecaade2015_225.content.pdf Oxman, R. , 2008. Performance-based design: Current practices and research issues. International Journal of Architectural Computing, 6(1), pp. 1–17. https://doi.org/10.1260/147807708784640090 Oxman, R. , 2009. Performative design: a performance-based model of digital architectural design. Environment and Planning B: Planning and Design. Retrieved from http://epb.sagepub.com/content/36/6/1026.short Oxman, R., and Oxman, R. , 2010. New structuralism: Design, engineering and architectural technologies. Architectural Design, 80(4), pp. 14–23. https://doi.org/10.1002/ad.1101 Pérez-Lombard, L., Ortiz, J., and Pout, C. , 2008. A review on buildings energy consumption information. Energy and Buildings, 40(3), pp. 394–398. https://doi.org/10.1016/j.enbuild.2007.03.007 Reas, C., McWilliams, C., and Barendse, J. , 2010. Form+code in design, art, and architecture. Princeton Architectural Press. Robert McNeel & Associates. , 2016. Rhinoceros. Seattle: Robert McNeel & Associates. Rogler, K. , 2014. Energy modeling and implementation of complex building systems. Retrieved from http://surface.syr.edu/cgi/viewcontent.cgi?article=1276&context=architecture_tpreps Roudsari, M., Pak, M., and Smith, A. , 2013. Ladybug: a parametric environmental plugin for Grasshopper to help designers create an environmentally-conscious design. IBPSA Conference Held in Lyon, France …. Retrieved from http://www.ibpsa.org/proceedings/BS2013/p_2499.pdf
79
LITERATURE
Rutten, D. , 2014. Grasshopper. Seattle: Robert McNeel & Associates. Santamouris, M. , 2013. Energy and climate in the urban built environment. Retrieved from https://books.google.at/books?hl=en&lr=&id=_r_9lPbjxX8C&oi=fnd&pg=PP1&dq=on+th e+built+environment+urban+influence&ots=4BmcQFh57_&sig=s2Ednq4_XxXAO1fA8b m_6ad0mBs Schumacher, P. , 2009. Parametricism: A new global style for architecture and urban design. Architectural Design, 79(4), pp. 14–23. https://doi.org/10.1002/ad.912 Schumacher, P. , 2016. Parametricism 2.0: Gearing up to impact the global built environment. Architectural Design, 86(2), pp. 8–17. https://doi.org/10.1002/ad.2018 Shi, X. , 2010. Performance-based and performance-driven architectural design and optimization. Frontiers of Architecture and Civil Engineering in China, 4(4), pp. 512– 518. https://doi.org/10.1007/s11709-010-0090-6 Shields, P., and Rangarajan, N. , 2013. A playbook for research methods: Integrating conceptual frameworks and project management. Sprecher, A., Yeshayahu, S., Lorenzo-Eiroa, P., Ahrens, C., Schmitzberger, A., Su, M. W.S., and Association for Computer-Aided Design in Architecture. , 2010. life in:formation : on responsive information and variations in architecture. ACADIA. Tedeschi, A. , 2011. Parametric architecture with Grasshopper® : primer. Le Penseur. Retrieved from https://books.google.at/books?id=OdGtuAAACAAJ&redir_esc=y Tedeschi, A. , 2014. AAD Algorithms-aided design: Parametric strategies using Grasshopper. Potenza: Le Penseur. The European Parliament and The Council of The European Union. , 2010. Directive 2010/31/EU of the European Parliament and of the council of 19 May 2010 on the energy performance of buildings. Toth, B., Salim, F., Drogemuller, R., Frazer, J. H., and Burry, J. , 2011. Closing the loop of design and analysis : Parametric modelling tools for early decision support . Faculty of Built Environment and Engineering; School of Design. Turrin, M., Von Buelow, P., Kilian, A., and Stouffs, R. , 2012. Performative skins for passive climatic comfort A parametric design process. https://doi.org/10.1016/j.autcon.2011.08.001 Turrin, M., Von Buelow, P., and Stouffs, R. , 2011. Design explorations of performance driven geometry in architectural design using parametric modeling and genetic algorithms. https://doi.org/10.1016/j.aei.2011.07.009 Wang, J., Li, J., and Chen, X. , 2010. Parametric design based on building information modeling for sustainable buildings. In 2010 International Conference on Challenges in Environmental Science and Computer Engineering (pp. 236–239). IEEE. https://doi.org/10.1109/CESCE.2010.285 Weytjens, L., and Verbeeck, G. , 2010. Towards “architect-friendly” energy evaluation tools. In Proceedings of the 2010 Spring Simulation Multiconference on - SpringSim ’10 (p. 1). New York, New York, USA: ACM Press. https://doi.org/10.1145/1878537.1878724 Woodbury, R. , 2010. Elements http://eprints.iat.sfu.ca/930/
of
parametric
design.
Retrieved
from
80