Creek Watch: Pairing Usefulness and Usability for Successful Citizen Science Sunyoung Kim1, Christine Robson2,3, Thomas Zimmerman2, Jeff Pierce2, Eben M. Haber2 1
Human-Computer Interaction Institute Carnegie Mellon University 5000 Forbes Avenue, Pittsburgh, PA
[email protected]
2
Mobile Computing Research Group IBM Research - Almaden 650 Harry Road, San Jose CA 95120 {tzim, jspierce,ehaber}@us.ibm.com
ABSTRACT Citizen science projects can collect a wealth of scientific data, but that data is only helpful if it is actually used. While previous citizen science research has mostly focused on designing effective capture interfaces and incentive mechanisms, in this paper we explore the application of HCI methods to ensure that the data itself is useful. To provide a focus for this exploration we designed and implemented Creek Watch, an iPhone application and website that allow volunteers to report information about waterways in order to aid water management programs. Working with state and local officials and private groups involved in water monitoring, we conducted a series of contextual inquiries to uncover what data they wanted, what data they could immediately use, and how to most effectively deliver that data to them. We iteratively developed the Creek Watch application and website based on our findings and conducted evaluations of it with both contributors and consumers of water data, including scientists at the city water resources department. Our study reveals that the data collected is indeed useful for their existing practices and is already in use in water and trash management programs. Our results suggest the application of HCI methods to design the data for the end users is just as important as their use in designing the user interface. Author Keywords Citizen Science, Participatory Sensing, Mobile, iPhone. ACM Classification Keywords H.5.2 User Interfaces, J.4 Computer Applications: Social and Behavioral Sciences. General Terms Human Factors INTRODUCTION Citizen science is, at its core, a way of empowering people Permission to make digital or hard copies of all or part of this work for personal or classroom use is granted without fee provided that copies are not made or distributed for profit or commercial advantage and that copies bear this notice and the full citation on the first page. To copy otherwise, or republish, to post on servers or to redistribute to lists, requires prior specific permission and/or a fee. CHI 2011, May 7–12, 2011, Vancouver, BC, Canada. Copyright 2011 ACM 978-1-4503-0267-8/11/05...$10.00.
3
Department of Computer Science University of California, Berkeley 2599 Hearst Ave., Berkeley, CA 94720
[email protected],edu
to help with large-scale scientific problems of interest to them. Typically, citizen science projects engage volunteers in data-gathering activities around a project in their natural environment (e.g., ecology, biology, astronomy, etc). This approach fulfills two broad goals: engaging and educating the public about scientific issues, and collecting data that would otherwise be difficult or impossible to obtain. Perhaps the most successful citizen science project to date is the Christmas Bird Count (CBC), a project started over a century ago by the Audubon Society, which asks volunteers during the holidays to count the number of birds in each species they sight. The CBC is successful in two ways; it inspires the involvement of tens of thousands of volunteers, and the results, collected at thousands of sites each year form one of the most critical data sources used by ornithologists to track bird populations and distributions across the globe. Those involved in the CBC are mostly amateur birdwatchers and not full-time scientists; however, the results of their joint efforts continue to have significant scientific impact. [18] While data collection for the CBC was traditionally done with paper forms, marked in pencil and sent by post to the Audubon Society, modern citizen science utilizes electronic communication. Web data submission is now common, and the proliferation of mobile phones in general (five billion in the world today [26]) and GPS and camera-equipped smart phones in particular (fifty million in the USA [10]) holds great promise for enhancing citizen science participation, providing a convenient means to collect and send time- and location-tagged data. Smart phones are a particularly powerful tool, combining an array of sensors paired with rich user interfaces in a personal device that is continually carried by millions of people around the world. Previous research in citizen science and participatory sensing has focused largely on the problem of engagement; recruiting volunteers and maintaining their interest and participation [5,12,24]. Incentive structures, competition, entertainment and educational approaches have all proven successful to some extent. Yet engagement is only a partial measure of success; a citizen science project has scientific impact only when the collected data is used. Several previous Citizen Science projects have inadvertently ignored this issue and have yet to produce any useful scientific results from the data, including NASA’s
Clickworkers1 project and the Journey North project. These projects launched without scientific goals for using the data collected, and have produced no scientific results despite years of collection ([11, 22]). This problem was re-iterated by scientist stakeholders we interviewed, who observed that volunteer groups often decide to collect data that is marginally useful to the scientific community. It seems logical to engage with scientists who need data as key stakeholders, yet they have been neglected by the design community. In our research we address this disconnect by focusing on the usability and usefulness of collected data, rather than just on the interface presented to users. We wanted our design to be driven by the scientists who need the data as well as by the volunteer groups that support their investigations. By first understanding the needs and abilities of these groups, we are more likely to build a citizen science application that is useful and usable. In order to find suitable groups of scientists and volunteers, we met with a variety of organizations. The California Environmental Protection Agency helped us identify watershed health as a critical area that is also amenable to data gathering by average citizens. Interviews and brainstorming sessions with the California State Water Resources Control Board and the City of San Jose Environmental Services Water Resources helped us understand their priorities and needs for data. We then met with local watershed monitoring organizations to understand the capabilities and limitations of their current citizen monitoring practices. Having assessed the data needs of the stakeholders and the abilities of volunteers we designed and developed Creek Watch. Creek Watch combines both an iPhone application and website. The iPhone application enables citizens to contribute water flow and trash data from creeks and rivers. The website, www.creekwatch.org, allows them to view contributed data, and provides scientists access to all of the collected data. We validated our design in a usability study with subjects who had no previous experience with water quality monitoring. We then conducted an intensive user study with 10 scientists from the City of San Jose Environmental Services Water Resources team that were not involved in our earlier study and design sessions. We tested the Creek Watch interface, assessed the usefulness of data it collected, and identified potential improvements in the application and website. Overall the scientists were very pleased with Creek Watch, and are now using the data it collects. The interviews and user studies enabled us to identify what data would be useful to the scientists and the standards the data must comply with.
volunteer watershed monitoring groups. Next, we explain our design of the Creek Watch iPhone application and website, how we took the needs of these different groups and converged upon a set of data and collection standards, and our user study with members of our local water control board. We then discuss lessons for citizen science design and key implications of our work, and conclude by identifying future directions for research. PRIOR WORK The recruitment of citizens to participate in large scale monitoring has a long history, particularly in observing phenomena in the environment. Animal population research has been aided by citizen science in a number of ways: in addition to the annual Christmas Bird Count [18], Cornell Lab's bird monitoring program [6] attracts over 200,000 volunteers each year. A similar project exists for counting fish2. Technology has enhanced the participation of citizens providing communication, documentation and measurement tools. The CONE project at UC Berkeley allows volunteers to contribute to bird sighting numbers using autonomous robotic cameras deployed in birding hotspots [23]. In the Lost Ladybug Project3 citizens submit digital photos of Ladybugs along with location and weather information. Citizen science provides a mechanism for participants to learn about and improve their community. Participants in the GarbageWatch project contribute pictures of garbage to help figure out where to place recycling bins4. Urban citizens equipped with sensors track neighborhood air [13,24,27] and noise [16] pollution. Citizens in Virginia have organized a volunteer group to monitor, consolidate and share data on local stream and rivers to maintain and improve the health of the Rivanna watershed5. Beyond science, many cities use the non-emergency number 3-1-1 to implement a citizen service center for residents to report needed roadwork, abandoned vehicles and other neighborhood code enforcement issues [4]. On-line versions of 3-1-1 developed by several cities provide citizens the ability to digitally interact with city services [19]. The value of mobile phones as tools for citizen science has been recognized [13], with examples such as air quality [20], and the Oil Reporter service which allows volunteers to report on areas affected by the Gulf Coast oil spill6. Citizens' role is not just limited to data collection. Technology makes it possible for citizens to volunteer their computer and brainpower. Idle time on volunteers’ home computers is being used to search for extraterrestrial life 7 and study protein folding8. The Galaxy Zoo9 leverages the 2
fishcount.org lostladybug.org 4 garbagewatch.com 5 streamwatch.org 6 oilreporter.org 7 setiathome.ssl.berkeley.edu 8 folding.stanford.edu 9 galaxyzoo.org 3
In the following sections we describe our series of contextual inquiries with water control boards and
1
en.wikipedia.org/wiki/Clickworkers
human brain's exceptional pattern-recognition skills, recruiting citizens to classify galaxies from photos taken by a robotic telescope. This type of citizen science is a form of crowd sourcing, wherein people can perform distributed tasks towards a greater goal [12]. Unlike prior work, an important contribution of our work is the use of HCI methods to focus on the data consumers as a stakeholder group. Much Citizen Science work from the HCI community (including [13,14,16]) has focused on projects where users are both producers and consumers, so there was no need to study separate stakeholders. While Cohn [5] considers the scientific quality of the data collected by volunteers, he does not discuss its utility to existing projects that need the data. Paxton et al. [21] did not explore the importance of data consumers in their design of a participatory sensing system to collect environmental data, and Cuff et al. [7] nicely delineated citizen sensing network infrastructure without describing the use of the collected data by data consumers. UNDERSTANDING THE PROBLEM We began the Creek Watch project with a discussion with the California Environmental Protection Agency of areas in which volunteers equipped with mobile devices could be empowered to help their environment. We conducted a series of interviews and brainstorming sessions with ecologists in the state agency to understand current practices and problems in environmental management. Our discussions identified the monitoring of watershed health as an ideal application of citizen science: waterways are numerous and geographically distributed, local water agencies lack the staff and resources to monitor all of them, and citizens are aware of the importance of water. While we chose to focus on waterways, the same basic issues of large geographic scope and limited resources occur in many environmental domains. Resources and Access Watersheds are geographically large, and monitoring all of the waterways within them would require resources that exceed most organizations. For example, the city of San Jose, California’s third largest city, has over 700 miles of creeks – far too much ground for a local agency to cover, especially when creeks run through private land that officials cannot access without permission. In practice, this means many areas are never visited by officials and receive no monitoring. However, many of these creeks run through parks and recreation areas visited by citizens every day; these citizens could perform some monitoring if the process were sufficiently convenient. Creeks that run through private land could be monitored by the land owners. As a result, watershed monitoring is well positioned to take advantage of the key potential of citizen science: there are many more people who care about the environment than just those who are professionals in the field.
Interacting Stakeholders In addition to resource demands, environmental monitoring programs must address data standardization and sharing among stakeholders: 1. Government organizations: these organizations are responsible for enforcement of regulations pertaining to water use, wastewater discharge, and pollution, on state, regional, county and city levels. 2. Private groups: these are typically consulting companies, which work closely with these government organizations, typically funded by grants, for example by private parties to conduct evaluations for environmental permits. 3. Volunteer groups: these are typically organized on a city or county level and meet anywhere from twice-a-year to pick up trash, to monthly to monitor water quality with professional equipment. Data sharing, re-use, and standards Beyond collecting data, one of the biggest challenges faced by organizations is sharing data - if two groups do not gather data in precisely the same fashion (i.e. follow the same protocol), the data may be incompatible. Even for programs where collection techniques have been standardized, the problem of data sharing typically remains unsolved. Historically each government organization has maintained its own databases with poor interoperability. Currently, data is most frequently exchanged as completed reports or as spreadsheets. Recent legislation in California has mandated a state-wide system to share this data, but the system is still under development. Getting information from private and volunteer groups can be even more difficult. Watershed volunteer groups typically aggregate data they have collected into a yearly report which is made available to government organizations as a summary document. More sophisticated groups may include a spreadsheet of the original data. Because these groups typically have a specific driving mission (e.g., searching for mercury or other toxins local to their area, tracking water flow rates which affect fish spawning, etc.), the data they collect is focused on a specific problem and may not include information that other organizations need to make further use of the data. Our discussions with the California EPA revealed that there are over 250 organized and recognized groups in California working on watershed health [9], yet their idiosyncratic data collection and sharing practices make it likely that only a few will have their data used by others. In our work we apply human-centered design methods to the design of the data collection and format to ensure usefulness by the scientists who are the primary end users of the data. CONTEXTUAL INQUIRIES Following on our brainstorming sessions with the California Environmental Protection Agency, we conducted a series of contextual inquiries [1] to guide the design of a
citizen science mobile application for watershed health monitoring. We conducted in-depth interviews, on the phone and in the field when possible, with eleven scientists, environmental workers, and water monitoring volunteers from across seven organizations. From the government side, we interviewed four ecologists in the California State Water Resources Control Board and the City of San Jose Environmental Services Water Resources. From the private sector, we interviewed three ecologists from San Francisco Estuaries Institute (SFEI) and the Southern California Coastal Water Research Project (SCCWRP). In the volunteer sector, we interviewed three volunteers from two local groups, the Stevens & Permanente Creeks Watershed Council (SPCWC) and the Alameda Creek Alliance. We also interviewed the volunteer outreach organizers of the Water Environment Federation, an international federation of water quality experts with over 80,000 members, including most of the environmental scientists we interviewed. The primary goal of these interviews was to identify (1) the data most needed by environmental organizations that could be gathered by citizen scientists, (2) how it would be used, and (3) how to best ensure that the data would actually be useful, including understanding the protocol and format required to make the data acceptable to the scientists. The challenge of getting useful data from citizen scientists was confirmed by our first interview subject: “In the early days it was an activity to engage understanding in water quality. It didn’t matter what they did as long as they did something. Then we realized no one uses the data and they aren't monitoring for things we care about.” Interview #1, State Water Control Board Critical Data: Water Flow and Trash
Problems in watershed management are numerous and varied, including the improvement of habitats for aquatic life, water collection for drinking and irrigation, flood and erosion control, and the identification and control of pollution. The data that could help these areas are equally numerous (e.g., water flow, turbidity, pH levels, dissolved oxygen, measurements of contaminant levels, aquatic life surveys). While much of this data requires specialized measurement equipment, some very useful data requires only simple observation. We identified water flow rate as a candidate datum from our interviews: “Wherever people go, if there’s a creek, it would be great to get info on flow. Qualitative and quantitative: take a picture and send to a database, GPS tagged. This would be tremendous – we need data on flow.” Interview #1, State Water Control Board Water flow data is needed by several of the stakeholders we interviewed. Water flow rate in creeks is critical to understanding the health of a watershed: these small waterways, which in aggregate hold most of the water in
California, are habitat for aquatic life, a source for drinking water and irrigation, and are unfortunately also a pathway for pollution. Without an accurate picture of when and where water is flowing, it is very difficult to understand the health and capacity of waterways, making water management more difficult. Capturing water flow data using the format and protocol required by the scientists assures that this data could be used by the stakeholders. Unfortunately, water flow data available to environmentalists is spotty at best. “We’re not getting a lot of [flow] data. Most is generated by discharge permits: when someone has a permit to discharge [waste water] into a stream, they are required to monitor flow, so we get that information. But…there are many more places we can look then we have people or resources for. … Flow is kind of hidden, but it's really important. What happens is when we have to get it its too late to go back in time.” Interview #4, State Water Control Board Fortunately, flow data is easy for citizen scientists to collect. No equipment is needed to determine if water is flowing or not, and if creeks are full or low. Furthermore, people pass by these waterways all the time while walking or biking in parks and around their neighborhoods. Each of the groups we interviewed had a different reason for wanting flow data. At the state-level, flow data is desired for water management and planning. At the city level, flow data is desired for tracking pollution. One of the local volunteer groups (SPCWC) wanted flow data to study fish spawning. One of the private consulting groups (SCCWRP) wanted flow data for clients applying for construction permits. The other (SFEI) wanted flow data for a longitudinal study of human effects on bay area water supply. To service the data needs of these different stakeholders, flow data collection must conform to standards to ensure maximum re-usability. We also identified data concerning trash as important to our stakeholders and amenable to citizen reporting. “Many of the most serious water quality problems in California are associated with non-point source pollution. … Trash is a severe non-point source problem. Trash clogs our waterways blocking fish migration paths, impairs aquatic life and poses a threat to many beneficial uses of our creeks and streams.” – Interview #1, State Water Control Board While many groups regularly conduct trash surveys and cleanups, there is simply too much area to cover. The California State Water Resources Control Board is required by the U.S. Environmental Protection Agency (EPA) to maintain a list of waters that are considered "impaired", i.e., they are too polluted to be used for swimming, fishing, drinking, or other beneficial uses [25]. In California, trash is the second most common impairment pollutant [8].
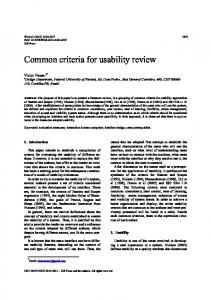
Figure 1: Creek Watch iPhone application screen shots To identify impaired waters, the state water board must collect and assess water quality data and determine if it meets standards. The process starts with stakeholders who alert the water board of locations where water quality standards may not be met. Citizens can alert state boards of pollution but need to present evidence. Photographs, tagged by location and time, provide tangible evidence of trash in waterways. Photos can help identify the type of trash (e.g., bottles, paper, car parts, and medical waste) and potential sources (e.g., individual littering, illegal dumping of landscape and construction debris). Trash occurs most frequently in sites with high public access [17], which bodes well for citizen monitoring of trash levels. The culprits for watershed pollution are often unaware of the extent to which their activities are damaging the environment. “It used to be that industry was the problem. But the average resident (collectively) is now the problem. People's pesticides, car washing, dog poop, garbage that we drop it’s a really big problem.” – Interview #7, City of San Jose Environmental Services The problem of getting data on such simple measures as flow rate and trash is complicated by the fact that good news is often assumed not to be worth reporting. “We have a citizen stream keeper program: people go out at least once a month to a creek to observe it … but if they don’t see anything bad they don't report, so we don’t know.” Interview #6, Local Water Monitoring Volunteer Coordinator To be successful, we concluded that our citizen science application must equally support and encourage the reporting of both problems and situations where nothing seems amiss. We concluded from these contextual inquiries that water quality data consumers would benefit from an application that enabled citizen scientists to report on water flow and
trash, and that the data needed to be collected following a protocol and format acceptable to the end users (scientists). A smart phone is ideal for collecting this data, since it is always on hand, can collect pictures and accurate location data, and can simplify submitting data to a central organization. More advanced needs In addition to flow and trash data, we identified several other standard measures of water quality that would be useful, such as temperature, turbidity, dissolved oxygen, and pH level. Unfortunately, for a citizen scientist to report on this data, they need to have water testing kits or more specialized equipment, complete with the training to collect data according to accepted protocol in order for this data to be acceptable for scientific studies. For example, the SPCWC volunteer group used tools ranging in price from several hundred to several thousand dollars, operated by a trained biologist, and even so would only take samples on a monthly basis due to limitations on lab time for sample analysis. Designing an application with a focus on consumers as well as producers of the data creates a trade-off between the advanced data needs of scientists and the capabilities of citizens without specialized training or equipment. To some extent this tradeoff occurs in all citizen science projects started by domain experts (e.g., [6,18]). Working with these stakeholder groups, we were able to look at the trade-offs in a new way. We identified the importance of collecting data that complies with the format and protocol required by scientists. We pair this with the citizen’s need for an easy way to collect data in a reliable and predictable way. DESIGN & DEVELOPMENT We designed and built Creek Watch to be a participatory creek monitoring system that allows citizen scientists to capture water flow and trash data and scientists to view and analyze the collected data. We designed the system as two
parts: a data collecting iPhone application, and a data sharing and viewing website, creekwatch.org. Data Format: Conforming to Standards To ensure that the collected data would be usable by existing programs, we drew on the California Environmental Protection Agency’s Surface Water Ambient Monitoring Program Bioassessment Standard Operating Procedures [2] and the Rapid Trash Assessment Protocol [3]. These manuals define procedures for reporting on water flow (composed of water level and flow rate) and trash levels. With consultation from the California State Water Resources Control Board, we adopted the definitions in Table 1 for Creek Watch. Water Level
Flow Rate
Trash
Dry: No water Present
Still: Water is present but is not visibly flowing
None: no trash in the water and surrounding area
Some: Water fills less then 75% of the channel
Slow: Water is present but is barely moving
Some: A few items of trash such as cans, bottles
Full: Water reaches up almost to the top of the banks
Fast: Water is present and flow is easily detected
A lot: Ten or more items of trash
Table 1: Water observation definitions used in Creek Watch, from the California EPA’s Surface Water Ambient Monitoring Program These observations, combined with a photo of the creek, GPS location and timestamp, provide the data that water monitoring organizations most requested. Data Collection Application We developed the data collection tool as a mobile application for the iPhone (see Figure 1). The application contains five views divided into tabs: Report, My data, Browse, Instructions, and About. Central to the application is the data reporting view, where users can Report on a creek they are looking at using the data format described above. From the report view users can access a set of photo examples defining the different choices for each data item. While the application attempts to immediately post reported data to the server, it can also store reported data locally on the phone when the network is unavailable (as is often the case for creeks alongside hiking trails). Users can browse through data they have uploaded as well as data that still needs to be uploaded in the My Data section. Users can initiate another upload attempt for any data that the application has not yet loaded. Users can also manually specify the location for a report if necessary (if, for example, the GPS on the phone could not determine the user’s position) before uploading a report.
Figure 2. Map View of collected data at creekwatch.org The Browse view provides a map visualization that enables users to see recent data points collected by others in their area, including photos. The About and Instructions views provide general information about and detailed instructions for using the application, respectively. Data Sharing Website The server we implemented at creekwatch.org collects data submitted by iPhones running the Creek Watch application, and presents this data in two interactive formats – a map (see Figure 2) and a table (see Figure 3). Map-based data visualization A map of all collected data points is the central visualization on creekwatch.org. We designed the map to enable browsing of the data by data contributors who wish to view their own and others’ data. We built the visualization as a Google Maps mash-up with the Creek Watch database that displays the location of every data point as map pins, centered on the user’s current location. The detailed data collected at each location is available as a popup window with a photo of the creek, or as hover text over each pin (see Figure 2).
Figure 3: Table view with filters of the data collected at creekwatch.org
Table based data visualization We designed the table view for scientists to easily work with the collected data (see Figure 3). Each column provides filters (time, location, data values), and scientists can export the filtered data to a csv (comma separated values) file for inclusion and integration with existing projects. The table view is publically available, such that anyone can manipulate and download the data in this fashion; however the intended audience is scientists in environmental management organizations. Design process In building Creek Watch we employed a classic iterative design process. Following our contextual inquiry interviews, we built an early version of the application to collect flow and trash data. We demonstrated this first version at an open community meeting with members of the state and local water control boards, and local volunteers. The initial feedback was positive, and we made several small changes to the workflow and appearance based on this review. Examples changes include adding an Instructions view to more clearly explain how to use the application. Usability Study We conducted a usability study on the user interface with four iPhone users who had no previous experience with water quality monitoring. The study was conducted in two parts: in a controlled environment in the lab, and in the field by local creeks. Our study identified some user interface glitches and workflow issues. For example, in response to our findings in this study, we employed a higher contrast between interface text and the background for easier reading in sunlight, and left more space between buttons to reduce accidental clicking. We also improved the instructions, and re-organized the application to begin with data entry, rather then with data browsing. USER STUDY & FINDINGS We designed and conducted a field deployment study to evaluate the effectiveness of our system at providing useful information to scientists. We recruited 10 environmental scientists in the City of San Jose Environmental Services Water Resources Department who own iPhones. The study participants included four environmental agents, three environmental outreach or volunteer coordinators, two managers, and one environmental analyst. Six participants were male and four were female. The average age was 45 years old with a standard deviation of 9.7 years. All participants had academic degrees related to environmental management or ecology. We chose to focus on environment scientists for our study participants in order to asses both the usability of the Creek Watch system and also the utility of the data it collects. None of our user study participants were involved in the brainstorming, early interviews, or design of Creek Watch. While we did work with other scientists from their departments to develop the application,
for the user study we wanted to see how unbiased scientists would react. The user study consisted of three steps: a prestudy interview, a deployment period, and a post-study interview. The study lasted for 3 weeks. Pre-study interview The purpose of a pre-study interview was to understand the data needs and collection practices of the participants. Prestudy interview questions included: - When you need collect/access it?
data/information,
how
do
you
- Do you share data you collect? How do you share it, and how is it used? - How often do you participate in field work? - What are the difficulties you perceive in water monitoring? Each interview lasted about thirty minutes, followed by an introduction to the Creek Watch application and website. At the end of each interview we collected demographic and occupational information. Deployment period We asked participants to use both the Creek Watch application and the websites whenever they felt was convenient over a three week period. During this time they logged 65 data points in the greater San Jose area. Post-study interview The purpose of the post-study interviews was to understand both how useful our users felt this data would be and what their reactions were to using the app as a data collector. Post-study interview questions asked about the subjects’ use of, opinions about, and recommendations for the Creek Watch application and website. Each interview lasted between thirty minutes to an hour. At the end of the interview, we gave participants a $10 Amazon gift coupon as compensation for their time. FINDINGS In our pre-study interviews, participants reinforced the lessons from our initial investigations: traditional scientific methods are expensive and don’t scale. The watersheds are too vast to be monitored adequately by their small staff. Several of the participants were in the process of deploying a river monitoring system in Coyote Creek, one of the largest waterways in San Jose. The system consists of nine autonomous units, each costing approximately $8000. The units continuously measure five basic characteristics of the water but must be periodically visited to retrieve data and clean the sensors. With units this expensive, widespread deployment is not an option; most of the creeks will remain unmonitored. While autonomous units are not the only way to measure creek health, site visits by field agents cannot provide
complete coverage of the watershed either. When describing the most important difficulty he faces in his job, one of the field agents stated: “Access is a problem. The big thing is we can only measure in places we can get to, resulting in data gaps.” This access problem was echoed as the top problem by three out of the four field agents. As our participants are both collectors and consumers of the data, our study provides insights into both aspects of Creek Watch. We therefore divide the findings from our user study into those relating to the consumption of data and those relating to the collection of data. Data Consumption Our participants agreed that Creek Watch provided very useful data while also providing a low barrier to entry for users. They found the trash data of particular interest. Participants saw opportunities to immediately make use of the data for existing programs in tracking watershed health: “We would use this data... That’s our big focus right now- trash.” (Project manager) “A great tool to monitor creeks and help us identify problem areas- one of my coworkers is on creek cleanup and trash keeps coming up.” (Project manager)
consensus among our participants was that flow data is useful in the long run for planning, trending and mapping. These results suggest that combining data that potential consumers can use immediately with data designed for longer-term use may increase the likelihood of success for a citizen science project by increasing the potential set of people interested in the data. All of the participants emphasized their belief that Creek Watch would promote public engagement, increase awareness of watershed health, and provide informal science education for volunteers. One of their goals is to make city residents think more about their water and where it comes from, and twice about littering. Creek Watch provides a way for them to engage with their constituents over watershed management. While participants were largely pleased with the desktop web interface for accessing data, they did make several suggestions for improvements. These suggestions centered on new ways to filter the contributed data. For example, a number of participants wanted to be able to easily filter the data in the table by city. Others wanted the ability to filter the data presented in the map view as well so that they could use the map view for their work.
As an example, several participants commented on the particular usefulness of this data for local trash cleanup events. One of the volunteer coordinators who manages cleanup events identified the value provided by being able to easily identify “trash clusters” in the data points contributed by other users:
The latter suggestion was somewhat unexpected, as in our pre-study interviews most participants agreed that they would prefer to access data in table form. However, we found in our post-study interviews that the map view was more popular for data consumption. Participants described “getting a sense of the area” by browsing photographs, as well as “finding trash” using the map view. The preferred presentation mode may depend on the intended uses, with more immediate uses (such as identifying locations with lots of trash) drawing more heavily on the map while uses that involve longer-term analysis (such as changes in flow) may rely on the table format or on the ability to download and work with the data separately.
“When you get a lot of data points you can see where most of the trash is in the creeks. When groups have cleanup events, now we can find these trash areas.”
Data Collection All participants commented how simple and easy to use they found the application. As one participant commented:
These findings were particularly interesting because during our initial contextual inquiries flow data appeared to be in greater demand than trash data. This difference in emphasis may be a reflection on the particular responsibilities of our study participants. While the scientists we interviewed during the contextual inquiry discussed longer term plans for the data’s use in environmental planning, the city water board workers seemed more concerned with immediate action items. We note that the ability for a citizen science project to yield such short-term wins may increase participation in both contributing and consuming the data.
“Very easy, very quick. I pull up at the creek next to the business I am inspecting and use it.”
“For our work in particular [enforcement of dumping regulations], I would be interested in the trash information- to see where folks are finding trash along the creeks.” (Field agent)
Participants did also consider flow data to be useful. One participant commented that Creek Watch was “a good way to inventory streams and maybe even keep track of the ephemeral nature of some streams and creeks.” The general
Participants also uniformly stated that making the application as easy as possible to capture data was critical. Five out of ten participants had friends/family members try the application out with similar results; other people found the application “simple to use,” and “easy.” These results suggest that, in general, volunteers without a scientific background will be able to use the application easily. Furthermore, our study revealed that participants considered using the application fun. One example participant described how they turned using the application into a game:
“We played find the creek: pull over at a creek, jump out of the car, find a good vantage point, enter the data.” Both of our participants with children of school age took their kids out to a creek to use the application and employed it as teaching tool. One participant recalled, “We talked about recording only what you see and not what you think- a nice teaching moment.” This participant was reacting to an interesting data collection phenomenon: “When we went to a place that I could not see any trash, [my son] said ‘some trash’ because of what he knew from other times he'd seen in the area.” We make two observations about this comment. This behavior emphasizes a potential problem with any usercontributed data: errors that occur to user mistakes, biases, etc. Because data consumers are unlikely to use any data that they do not trust, a citizen science application should thus ideally provide a mechanism to allow consumers to easily verify the data. We believe that the inclusion of pictures in the data helps provide this “check”. In this case, scientists can see if the picture actually shows any trash. Several participants requested a comment field to write down what they were seeing. This request is particularly interesting because none of these participants could think of a way that, as data consumers, they would have a use for this data. They simply “wanted to be able to add a little more data.” The disparity between their desires as data collectors and as data consumers reinforces the value in studying both aspects of a citizen science application. Five participants reported using the website to compare the data they had collected with existing data. One reported: “I would occasionally browse data [on the map view]looking where other people were making observations and checking out their photography.” Checking data on the map “as a reference” to make sure they were taking data at least as good as their peers was a common theme. We note that this behavior presents an opportunity to seed expected use by ensuring a site has an initial set of “ideal” data points for early adopters to refer to. Previous work in this area has not highlighted this as important, perhaps because most citizen science projects started by HCI researchers (e.g., [23]) focus on widespread and/or rapid adoption by users. Overall our participants were very pleased with Creek Watch both as data collectors and data consumers. Even after the study formally concluded they continue to use the application. Subsequent conversations revealed that two of the field agent users plan to incorporate the application into their regular data collecting practices, replacing their current pen-and-paper data collection. While we did not intend Creek Watch to primarily be used by experts in their
professional data collection, we regard that adoption as validation of the usefulness of the captured data. CONCLUSIONS AND FUTURE RESEARCH Our goal in this research was to design a citizen science application that would provide scientists useful data as well as providing a usable interface for untrained volunteers. A key part of that process was the use of HCI methods to investigate the needs of data consumers. We worked closely with state, local, and volunteer environmental groups and employed a variety of contextual inquiry tools to determine what data they wanted and the requirements to make the data usable (e.g., format, reliability, standardization). Those investigations revealed the following lessons that we believe generalize to other citizen science applications: - When HCI methods are applied to the data as well as the interface, the resulting system can collect more useful data. - Providing reliable and standardized data enables organizations beyond initial stakeholders to benefit from the data in unanticipated ways. - New users make use of sample data to validate their collection practices, suggesting the utility of planting “seed” data - Combining captured data that organizations can use immediately with data that provides long-term, aggregate value may increase the chance of success for a citizen science application. Based on an initial study of Creek Watch, we believe that we have succeeded in designing a citizen science application that is both usable and useful. In addition, the collected data is already being used by the City of San Jose, including new uses that we did not originally foresee (e.g., the use of the data for trash clean up site identification and use as a data collection tool by field agents). Other water management organizations within California have expressed interest in using Creek Watch. As next steps we are interested in exploring long-term usage patterns among data contributors and data consumers. For data contributors, we plan to examine factors such as adoption rates, sustained use, and data quality. For data consumers, we plan to explore how to improve the existing data presentation mechanisms and determine what new visualizations would significantly improve the ability to use the gathered data effectively. More broadly, much work remains in determining how best to design citizen science applications that are widely adopted and able to make an actual impact through their collected data. ACKNOWLEDGMENTS The authors would like to gratefully acknowledge the many scientists and volunteers who worked with us from the following organizations: the California Environmental Protection Agency, the California State Water Resources
Control Board, the California State Surface Water Ambient Monitoring Program (SWAMP), The City of San Jose Environmental Services Water Resources Deoartment, San Francisco Estuaries Institute, the Southern California Coastal Water Research Project, the Stevens & Permanente Creeks Watershed Council (SPCWC), the Alameda Creek Alliance, and the Water Environment Federation division for World Water Monitoring Day. We would also like to express our particular thanks to Erick Burres from the California Water Control Board SWAMP program, to Carol Boland from the city of San Jose water control board, to Mondy Lariz and Joanne McFarlin from the SPCWC volunteer group, to the user study participants from IBM Research - Almaden, and to our user study participants from the City of San Jose Environmental Services Water Resources Department. REFERENCES 1. Beyer, H. & Holtzblatt, K. (1988), Contextual Design: Defining Customer-Centered Systems. San Francisco: Morgan Kaufmann. ISBN: 1-55860-411-1. 2. California EPA (2010), Surface Water Ambient Monitoring Program: Bioassessment Standard Operating Procedures. swamp.mpsl.mlml.calstate.edu/ resourcesand-downloads/standard-operating-procedures 3. California EPA (2004) Surface Water Ambient Monitoring Program: Rapid Trash Assessment Protocol. http://www.swrcb.ca.gov/rwqcb2/water_issues/program s/stormwater/muni/mrp/WaterBoard%20Trash%20Asse ssment%20Method%20SWAMP_v8.pdf 4. City of Knoxville (2010), Neighborhood Codes Enforcement. www.ci.knoxville.tn.us/services/codes/. 5. Cohn, J. P. (2008), Citizen Science: Can Volunteers Do Real Research? Bioscience 58:192–197. 6. Cornell Lab of Ornithology (2010), Mission: Citizen Science.www.birds.cornell.edu/netcommunity/page.asp x?pid=1664. September 2010. 7. Cuff, D., Hansen, M. & Kang. J. (2008), Urban sensing: out of the woods, In Proc. Comm. of the ACM 24-33. 8. Environmental Protection Agency 2006 Section 303(d), List Fact Sheet for California. EPA Office of Water, ,oaspub.epa.gov/tmdl/state_rept.control?p_state=CA
12. Irwin, A. (1995), Citizen Science: A Study of People, Expertise and Sustainable Development. Routledge. 13. Kim, S., & Paulos, E. (2010), inAir: Sharing Indoor Air Quality Measurements and Visualizations. In Proc. CHI 2010. 11861-1870. 14. Lane, N, Miluzzo, E, Lu, H., Peebles, D., Choudhury, T., Campbell, A. (2009), A Survey of Mobile Phone Sensing. Ad Hoc and Sensor Networks. IEEE Comm. Sept 2010. 15. Luther, K., Counts, S., Stecher, K. B., Hoff, A., Johns, P. (2009), Pathfinder: an online collaboration environment for citizen scientists. In Proc. CHI 2009, 239-248. 16. Maisonneuve, N., Stevens, M., Neilssen, M, Hanappe, P, Steels, L. (2009), Citizen noise pollution monitoring. In Proc. International Conference on Digital Government Research 2009, 96-103. 17. Moore, S., Cover, M., & Senter, A. (2007), Rapid Trash Assessment Method Applied to Waters of the San Francisco Bay Region: Trash Measurement in Streams. California Environmental Protection Agency, www.swrcb.ca.gov/rwqcb2/docs/swampthrashreport.pdf 18. National Audubon Society (2010), Christmas Bird Count. birds.audubon.org/history-christmas-bird-count. 19. Open Plains (2010), Open 311: A collaborative effort to create an open standard for 311 services. open311.org. 20. Paulos, E., Honicky, R., & Hooker, B. (2008), Citizen Science: Enabling Participatory Urbanism. Handbook of Research on Urban Informatics: The Practice and Promise of the Real-Time City. IGI Global 2008. 21. Paxton, M. & Benford, S. (2009), Experiences of participatory sensing in the wild, In Proc. Ubicomp, 2009 265-274. 22. Shirky, C. (2010), Cognitive Surplus: Creativity and Generosity in a Connected Age. Penguin Press HC, June 10, 2010. ISBN-13: 978-1594202537. 23. Song, D. & Goldberg, K.(2007), Networked robotic cameras for collaborative observation of natural environments. Robotics Research. Springer 2007. 24. Sukhatme, G. (2009), Air Visibility Monitoring. robotics.usc.edu/~mobilesensing/visibility/MobileAirQu alitySensing.pdf.
9. Environmental Protection Agency (2010), TMDL Program Results Analysis Fact Sheet # EPA841-F-10002. EPA Office of Water, January 2010. www.epa.gov/waters/ doc/factsheets/303d_impaired_waters_gis.pdf
25. Weiner, J. F. (2010), Swimmable, Drinkable? California Coastkeeper Alliance, May 12, 2010. www. cacoastkeeper.org/news/fishable-swimmable-drinkable
10. Gonsalves, A., (2010) Android Phones Steal Market Share. InformationWeek www.informationweek.com/ news/showArticle.jhtml?articleID=224201881.
26. Whitney, L. (2010). Cell phone subscriptions to hit 5 billion globally. CNN. reviews.cnet.com/8301-13970_710454065-78.html
11. Howe, J. (2009), Crowdsourcing: Why the Power of the Crowd Is Driving the Future of Business. Crown Business, ISBN-13: 978-0307396211.
27. Willet, W., Aoki, P., Kumar, N., Subramanian, S. and Woodruff, A. (2010), Common Sense Community: Scaffolding Mobile Sensing and Analysis for Novice Users. In Proc. Pervasive 2010, 301-318.