Sep 26, 1997 - Methods used in astronomy are HCOMPRESS 18], FITSPRESS 14], and JPEG 6]. Two other methods have also been proposed for ...
Astronomical Image Compression J.-L. Starck CEA/DSM/DAPNIA, CE-SACLAY, F-91191 Gif sur Yvette Cedex F. Murtagh Faculty of Informatics, University of Ulster, Magee College, Londonderry BT48 7JL, Northern Ireland M. Louys ENPS and Observatoire Astronomique, Universit�e Louis Pasteur, F-67000 Strasbourg, France September 26, 1997
Abstract
The goal of this paper is to present and compare several compression methods (fractal, wavelets, JPEG, ...) applied on astronomical images. Quality is estimated from visual aspect, and also from photometry and astrometric measurements. Computation time of each method is discussed.
1 Introduction Image compression can be necessitated for di�erent reasons, which may in practice motivate di�erent compression strategies. Cases which can be easily distinguished include: quicklook (e.g. from the Hubble Space Telescope image archive [8]); very large images (e.g. the all-sky atlas, ALADIN, with links to cataloged information on tens of millions of astronomical objects [1]); fast access to large pictorial databases; and Web-based and other types of data transmission (a number of references to past work on progressive image transmission can be found in [7]). Methods used in astronomy are HCOMPRESS[18], FITSPRESS [14], and JPEG[6]. Two other methods have also been proposed for astronomical image compression: one using mathematical morphology, and another one based on the pyramidal median transform. A speci c decompression method has also been developed [2] in order to reduce artifacts relative to the HCOMPRESS method. In the signal processing domain, two other recent approaches have also been developed. The rst based on fractals, and the second uses a bi-orthogonal wavelet transform. We rst review quickly all these methods, and then compare them in the framework of the special case of astronomical images
2 Methods HCOMPRESS HCOMPRESS [18]
1. 2. 3. 4.
is based on the Haar wavelet transform. The algorithm consists to apply a Haar transform to the data. quantify the wavelet coe�cients by dividing by a value, and taking its integer value. apply a quadtree on the quanti ed value. use a Hu�man coder 1
HCOMPRESS + iterative decompression
A iterative decompression has been proposed [2] to decompress les which was compressed using HCOMPRESS. The idea is to consider the decompression problem as a restoration problem, and to add constraints on the solution in order to reduce the artifacts.
FITSPRESS
FITSPRESS [14] is based on a wavelet transform, using Daubechie lters with four coe�cients.
are available by ftp (cfata4.harvard.edu::/pub/ tspress08.tar.Z).
Sources
JPEG
JPEG is the standard compression method [6]. It based on the cosines transform, and an uniform quantization. Sources are available by ftp (ftp.uu.net:: graphics/jpeg).
Wavelet
Wavelet packages exist, leading to more sophisticated methods. The one we use is based on a biorthogonal wavelet transform (using Antonini-Daubechies 7/9 coe�cients) with a non uniform coding [17], and arithmetic encoding. It is a freeware provided by Davis and source is available at "http://www.cs.dartmouth.edu/ gdavis/wavelet/wavelet.html".
Fractal
The image is decomposed by block, and each block is represented by a fractal. See [5] for more explanation.
Mathematical morphology
This method is based on mathematical morphology (erosion, and dilation). It consists in detecting structures above a given level, the level being equal to the background plus three times the noise standard deviation. Then, all structures all compressed by using erosion and dilation, and also a quadtree and a hu�man coding. This method is based on a object detection, and lead to high compression ratio if the image does not contain a lot of information, as it is often the case in astronomy.
Pyramidal Median Transform
The median transform is nonlinear, and o�ers advantages for robust smoothing (i.e. the e�ects of outlier pixel values are mitigated). The principle of this compression method is to select the information we want to keep, by using the pyramidal median transform, and to code this information without any loss. Thus the rst phase searches for the minimum set of quantized multiresolution coe�cients which produce an image of \high quality". The quality is evidently subjective, and we will de ne by this term an image such as the following: � there is no visual artifact in the decompressed image. � the residual (original image { decompressed image) does not contain any structure. Lost information cannot be recovered, so if we do not accept any loss, we have to compress what we take as noise too, and the compression ration will be low (3 or 4 only). This method is similar to the mathematical morphology method in the sense that both try to understand what is in the image, and to compress only what is considered as signi cant. The PMT uses a multiresolution approach, which allows a more powerful separation between signal and noise. 2
3 Quality Assessment Criteria which can be retained for estimating the quality of a compression methods 1. Visual aspect 2. Signal to noise ratio 3. Photometry 4. Astrometry 5. Detection of real and faint objects 6. Objects morphology Very few real studies have carry out until now in astronomy in order to de ne which compression method should be used. Two have been done in the framework of the Aladin project. One in 1993, where JPEG, ts compress, and hcompress have been evaluated [3], and another one in 1996 [12, 16], where JPEG and PMT are been compared. In these studies the e�ects of compression for a Schmidt photographic plate of the region of M5 (numbered ESO 7992v) were examined. The digitized image obtained is a mosaic of 28 � 28 subimages, each of 1024 � 1024 pixels. Resolution is 0.7 arcseconds per pixel. To carry out tests in a reasonable time and to avoid plate boundary e�ects, we analyzed 25 adjacent subimages, located at the center of the photographic plate. We stress that these test images are real and not simulated. They are representative of the images being used in the ALADIN all-sky \clickable map" project currently nearing completion at Strasbourg Observatory [1]. The plate selected includes the globular cluster M5, from which more than 60,000 objects (stars and galaxies) were identi ed. The position of each object was ascertained by marginal Gaussian tting to the intensity distribution. Magnitude was determined using 120 photometric standards, which allowed the magnitude-integrated density calibration curve to be speci ed. The central region used for the astrometry and photometry measurements consists of about 2000 objects whose magnitude distribution (from 14 for the brightest objects, to 19 for the faint objects) is representative of the global population of the catalog [4].
3.1 First ALADIN project study
The result of the detection experiments [3] are described in table 3.1. Fitspress produces poor results concerning the number of real detected objects. JPEG is better than HCOMPRESS at low signal to noise ratio, and is relatively equivalent at higher level. Concerning the Signal to noise ratio the photometry, and astrometry, JPEG and HCOMPRESS produce images of equivalent quality, but FITSPRESS is again worse than the two other methods. The conclusion of this rst study was that the standard JPEG method was nally not so bad, even if block artifacts appear. The available softwares (i.e. HCOMPRESS and FITSPRESS) developed in astronomy were not convincing in the framework of the Aladin project. When the PMT method has been proposed [15], a second study has been carry out in oder to compare JPEG and PMT.
3.2 Second ALADIN project study
For JPEG and PMT compression methods studied here, each implying loss of information, we have to look for a good compromise between compression rate and visual quality. In the case of JPEG, various studies [3, 4] con rm that beyond a compression rate of 40 this method of compression, when used on 16 bit/pixel images, gives rise to `blocky' artifacts. For PMT, the reconstruction artifacts appear at higher compression rates, beyond a rate of 260 in the particular case of our images. 3
Method
Compression real lost false amount of percentage of ratio objects objects object detection detection detected detected errors errors 4 15 1 2 3 19 JPEG 10 14 2 2 4 25 20 14 2 4 6 38 40 13 3 5 8 50 4 14 2 3 5 31 Hcompress 10 14 2 5 7 44 20 11 5 3 8 50 40 11 5 5 10 53 4 15 1 1 2 13 Fitspress 10 13 3 0 3 19 20 10 6 0 6 38 40 5 11 0 11 69 Table 1: Detection of real and faint objects
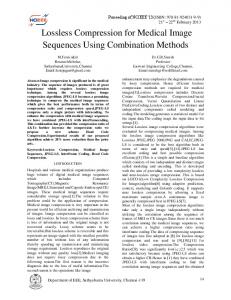
Astrometry test for JPEG vs PMT 0.7 ’JPEG40’ ’PMT’ ’Catalog_precision’
0.6
Position error in pixels
0.5
0.4
0.3
0.2
0.1
0 10
12
14
16
18
20
Magnitude
Figure 1: Mean error in astrometry, by interval of 0.25 magnitude, for images compressed 40 times by JPEG and 260 times by the PMT.
4
To estimate the in uence of compression algorithms on astrometrical precision of the objects, we studied the error in the position of the object in the original image compared to the position in the compressed/uncompressed image. This was done for each object in the catalog. To determine the position of the objects, we used the method of Ohja et al. [11] as used originally for creating the catalog. Knowing the catalog magnitude of the objects, we can represent the mean positional error as a function of the object magnitude. This was done for magnitude intervals of 0.25 for the 2000 objects of the dataset used. Figure 1 allows the performances of JPEG and PMT to be compared. We note that for the two methods, the error is below the systematic error of the catalog, in particular in the interval from object magnitudes 13 to 19 where we have su�cient objects to warrant asserting a signi cant result. Outside that interval, our dataset does not contain enough objects to establish a mean error in the astrometry. Photometric measurements on ESO7992v
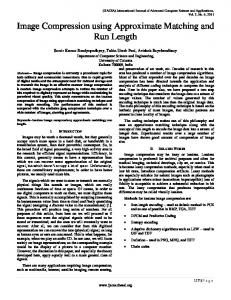
Standard deviation of the fit of Mc=f(log(integrated density)
1 ’JPEG compressed image(40:1)’ ’Original image’ ’Catalog RMS error’ 0.8
0.6
0.4
0.2
0 10
12
14 16 Catalog Magnitude
18
20
Figure 2: Comparison of the calibration error, by 0.0625 magnitude intervals, between the uncompressed image using JPEG, the original image, and the reference catalog. Photometric measures, central region of ESO7992v
Standard deviation of the fit of Mc=f(log integrated density)
1 ’PMT’ ’Photometry - original image’ ’Catalog RMS error’ 0.8
0.6
0.4
0.2
0 10
12
14
16
18
20
Magnitude
Figure 3: Comparison of the calibration error, by 0.0625 magnitude intervals, between the uncompressed image using PMT, the original image, and the reference catalog. Conservation of photometrical properties is also a fundamental criterion for comparison of com5
pression algorithms. We compared the integrated density of the objects in the 25 original images with the corresponding integrated densities from the images compressed/uncompressed with PMT and with JPEG. Thus we measure the photometric stability of the objects following compression, relative to their representation in the original image. The corresponding error curves are shown in Figures 2 and 3. The JPEG curve shows a slight increase for magnitudes above 18, and a smoothing e�ect for brighter objects between 14 and 16. For PMT, an increase in dispersion is noticed for high magnitudes, which corresponds to the problem of the detection of faint objects. Altering the detection threshold from 4 � � to 3 � � does not change this. We note that the number of intervals below 14 is too small to allow for interpretation of the behavior of very bright objects. Even if PMT brings about greater degradation in the photometry of objects, especially when the objects are faint, the errors stay close to that of the catalog, and as such are entirely acceptable. Of course we recall also that the compression rate used with PMT is 260:1, compared to 40:1 for JPEG.
3.3 Visual Quality
A quick overview has been obtained of what produces each method by running all compression algorithm on two images. The rst one was a 256x256 image of the Coma cluster from a Space Telescope Science Institute POSS-I digitized plate, and the second one was a 1024x1024 image, already described in the previous section. Mathematical morphology method, HCOMPRESS iterative decompression one have been redeveloped, and existing packages have been used for the others. The visual quality is estimated from the visual aspect of the decompressed image, and the quality of the residual (original image - decompressed one). Conclusions relative to this study are: � JPEG can not be used at compression ratio higher than 40. Above this, artifact becomes important, and furthermore, astrometric and photometry becomes very bad. � The fractal method can not be used for astronomical data compression. There is box artifact, but the main problem is that object ux modi ed after decompression, and the residual contains a lot of informations (stars or galaxies can be easily identi ed on the residual map!). � The mathematical morphology lead to good compression ratio, but the background estimation is delicate. For the Coma cluster, the result was relatively bad, due to the di�culty to nd the background. Most sophisticated algorithm can certainly be used to do this task. Another drawback of this method is the bad recovery of the contour of the object, which leads also to a loss of ux. � Hcompress produces artifacts. An iterative reconstruction allows to suppress them, but in this case, the reconstruction takes time. However this approach should be considered when the data base are already compressed with HCOMPRESS (HST archive, ...). � The wavelet method produces very good results for the coma cluster (compression ratio of 40). For the second image, where a compression ratio of more than 200 is obtained with the PMT or by morphology mathematic, artifact appears if we try to achieve the same high performances. This method can be used, but not for very high compression ratio. � The pyramidal median transform produces a good quality for both images. The compression ratio, as for the morphology mathematic method, depends on the content of the image. More the image is empty, more the compression ratio is high. An interesting feature of the wavelet method is that the compression ratio is a user parameter. For the PMT, and the mathematical morphology, the compression ratio is determined from a noise modeling. For other methods, a user parameter allows to change the compression ratio, and the quality, but only iterations can lead a given compression ratio, or to a given quality. 6
Comp. Decomp. Artifact Comp. Progressive time (sec) time (sec) ratio transmission JPEG
1.17
4.7
Y