8 IMAGE PRESENTATION AND COMPRESSION Borko Furht Florida Atlantic University Department of Computer Science and Engineering Boca Raton, Florida 33431
[email protected]
1. 2. 3. 4.
IMAGE CONCEPTS AND STRUCTURES ............................................................................. 150 STORAGE REQUIREMENTS FOR MULTIMEDIA APPLICATIONS............................. 152 CLASSIFICATION OF COMPRESSION TECHNIQUES .................................................... 153 JPEG ALGORITHM FOR FULL COLOR STILL-IMAGE COMPRESSION................... 155 4.1 SEQUENTIAL JPEG ENCODER AND DECODER .......................................................................... 155 4.2 COMPRESSION MEASURES....................................................................................................... 160 4.3 SEQUENTIAL JPEG ENCODING EXAMPLE ................................................................................ 161 4.4 JPEG COMPRESSION OF COLOR IMAGES.................................................................................. 162 4.5 PROGRESSIVE JPEG COMPRESSION......................................................................................... 164 4.6 INTERACTIVE PROGRESSIVE JPEG........................................................................................... 166 4.7 LOSSLESS JPEG COMPRESSION............................................................................................... 169 4.8 HIERARCHICAL JPEG COMPRESSION ...................................................................................... 169 5. CONCLUSION ............................................................................................................................ 169 REFERENCES ............................................................................................................................. 170
Abstract. This chapter covers the JPEG compression algorithm, which is primarily used for full-color still image applications. First, we describe various image presentations, such as RGB, YUV, and YCbCr, and standard image formats. Then, we describe all components of the JPEG algorithm including discrete cosine transform, quantization, and entropy encoding. We also define both encoder and decoder architectures. The main emphasis is given to the sequential mode of operation, which is the most typical use of JPEG compression. However, the other three modes of operation, progressive, lossless, and hierarchical JPEG, are described as well.
149
150
Chapter 8 1.
IMAGE CONCEPTS AND STRUCTURES
A digital image represents a two-dimensional array of samples, where each sample is called a pixel. Precision determines how many levels of intensity can be represented, and is expressed as the number of bits/sample. According to precision, the images can be classified into • • • •
Binary images, represented by 1 bit/sample. Examples include black/white photographs and facsimile images. Computer graphics, represented by a lower precision, as 4 bits/sample. Grayscale images, represented by 8 bits/sample. Color images, represented with 16, 24, or more bits/sample.
According to the trichromatic theory, the sensation of color is produced by selectively exciting three classes of receptors in the eye. In a RGB color representation system, shown in Figure 1, a color is produced by adding three primary colors: red, green, and blue (RGB). The straight line, where R = G = B, specifies the gray values ranging from black to white. Figure 2 illustrates how a three-sensor RGB color video camera operates and produces colors at a RGB monitor. Lights for sources of different colors are added together to produce the prescribed color.
R White
Black
B
Gray values R=G=B
G
Figure 1. RGB representation of color images. Another representation of color images, YUV representation describes luminance and chrominance components of an image. The luminance component (Y) provides a grayscale version of the image, while two chrominance components (U and V) give additional information that converts the grayscale image to a color image. The YUV representation is more natural for image compression. An image represented in RGB color, can be converted into YUV systems using the following transformations:
Y = 0 .3 R + 0 .6 G + 0 .1 B U = B − U V = R − Y where Y is the luminance component, and U and V are two chrominance components. When R = G = B, then Y = R = G = B, and U = V = 0, which represents a grayscale image.
Image Presentation and Compression
151
Mirrors and light splitter Red Sensor
Amplifier
R RGB Monitor G
Lens
Scene
Green Sensor
Amplifier B
Blue Sensor
Amplifier
Figure 2. Three-sensor RGB color video camera. Another color format, referred to as YCbCr, similar to the YUV format, is intensively used for image compression. In YCbCr format, Y is the same as in YUV system; however, U and V are scaled and zero-shifted to produce Cb and Cr , respectively, as follows: C C
b = r =
U / 2 + 0 .5 V / 1 .6 + 0 . 5
Resolutions of an image system refer to its capability to reproduce fine detail. Higher resolution requires more complex imaging systems to represent these images in real time. In computer systems, resolution is characterized by number of pixels (for example, VGA has a resolution of 640 Η 480 pixels). In video systems, resolution refers to the number of line pairs resolved on the face of the display screen, expressed in cycles per picture height, or cycles per picture width. For example, the NTSC broadcast system in North America and Japan, denoted 525/59.94, has about 483 picture lines. (525 denotes the total number of lines in its rates, and 59.94 is its field rate in Hertz.) The HDTV system will approximately double the number of lines of current broadcast television at approximately the same field rate. The system will have 937 total lines and a frame rate of 65.95 Hz. Figure 3 compares various image structures, showing the vertical and horizontal pixel counts, and the approximate total number of pixels. The CCITT has adopted several picture formats for video-based telecommunications: Common Intermediate Format (CIF), Quarter-CIF (QCIF), Small QCIF (SQCIF), 4CIF, and 16CF, which are described in Chapter 9 on video presentation and compression. The full-motion video is characterized with at least 24 Hz frame rate (or 24 frames/s), up to 30, or even 60 frames/s for HDTV. For animation, acceptable frame rate is in the range 15 to 20 frames/s, while for video telephone it is 5-10 frames/s. Videoconferencing and interactive multimedia applications require a rate of 15-30 frames/s.
152
Chapter 8 320
160
640 720 800
1152 1280
1920
Software MPEG, 120
240 480 483 600 720 900
0.019 Mpx
SIF, 0.075 Mpx VGA, 0,3 Mpx PC/Mac, 0.5 Mpx
Video,0.35 Mpx
Advanced Televsion (ATV), 1Mpx Workstation, 1Mpx
High Definition Television (HDTV), 2 Mpx 1080
Figure 3. Various image structures.
2. STORAGE REQUIREMENTS FOR MULTIMEDIA APPLICATIONS Audio, image, and video signals require a vast amount of data for their presentation. Table 1 illustrates the mass storage requirements for various media types, such as text, image, audio, animation, and video. There are three main reasons why present multimedia systems require data to be compressed. These reasons are related to: (a) large storage requirements of multimedia data; (b) relatively slow storage devices which do not allow playing multimedia data (specifically video) in real time, and (c) the present network’s bandwidth, which do not allow real-time video data transmission. Table 1. Storage Requirements for Various Media Types Text
Image
Audio
Animation
Video
Object Type
ASCII EBCDIS
Bitmapped graphics Still photos Faxes
Non-coded stream of digitized audio or voice
Synched image and audio stream at 15-20 frames/s
TV analog or digital image with synched streams at 2430 frames/s
Size and Bandwidth
2KB per page
Simple: 64KB per image Detailed (color) 7.5 MB per image
Voice/Phone 8 KHz/8 bits (mono) 6-44 KB/s Audio CD 44.1 kHz/ 16 bit/stereo 176 KB/s
320x640x16 pixels/frame 16 bit color 16 frames/s 2·5 MB/s
640x480x24 pixels/frame 24-bit color 30 frames/s 27.7 MB/s
As an example, a typical multimedia application may require the storage of more than 30 min of video, 2,000 images, and 40 min of stereo sound on each laser disc side. This application would require about 50 GB storage for video, 15 GB storage for images, and 0.4 GB storage for audio, that gives a total of 65.4 GB of storage.
Image Presentation and Compression
153
In another example, assuming color video frames with 620x560 pixels and 24 bits per pixels, it would be necessary to save about 1 Mbytes per frame. For a motion video requiring 30 frames/s, it gives a total of 30 Mbytes for 1 second of motion video. Even if there is enough storage available, we won’t be able to playback the video in real time due to insufficient speed of storage devices. According to the previous calculation, the required speed of a storage device should be 20 Mbytes/s. However today’s technology provides about 1.2 Mbytes/s transfer rate of CD ROMs. Therefore, at the present state of technology of storage devices the only solution is to compress the data before the storage and decompress it before playback. Modern image and video compression techniques offer a solution to this problem, which reduces these tremendous storage requirements. Advanced compression techniques can compress a typical image ranging from 10:1 to 50:1. Very high compression ratios of up to 1000:1 can be achieved in compressing of video signals. Figure 4 illustrates storage requirements for a multimedia application consisting of various media types, assuming that the image is compressed by ratio 15:1, audio 6:1, and video and animation by factor 50:1. The total storage requirement for this storage-intensive application becomes about 3 GB, which is feasible. Storage Requirements
111.1 GB --> (after compression) --> 2.96 GB
100 GB
82.8 GB 23.4 GB
10 GB 3 GB 1 GB
1 GB 0.6 GB 0.3 GB
0.1 GB
1.66 GB 0.5 GB
0.2 GB 0.03 GB
50,ooo pages of text
3,000 color images
(compressed 2:1)
(compressed 15:1)
500 maps (compressed 10:1)
0.1 GB
60 minutes of stereo sound (compressed 6:1)
0.47 GB
60 minutes animation
50 min of digitized video
(compressed 50:1)
(compressed 50:1)
Figure 4. Storage requirements for a multimedia application. Before compression the application required 111.1 GB of storage and after compression 2.96 GB.
3. CLASSIFICATION OF COMPRESSION TECHNIQUES Compression of digital data is based on various computational algorithms, which can be implemented either in software or in hardware. Compression techniques are classified into two categories: (a) lossless, and (b) lossy approaches. Lossless techniques are capable of recovering the original representation perfectly. Lossy techniques involve algorithms, which recover the presentation similar to the original one. The lossy techniques provide higher compression ratios, and, therefore, they are more often applied to image and video compression than lossless techniques. The classification schemes for lossless and lossy compression are presented in Figures 5(a) and (b), respectively.
154
Chapter 8
The lossy techniques are classified into: (1) prediction-based techniques, (2) frequencyoriented techniques, (3) importance-oriented techniques, and (4) hybrid techniques. Predictive-based techniques, such as ADPCM, predict subsequent values by observing previous values. Frequency-oriented techniques apply the Discrete Cosine Transform (DCT), or subband coding, which relates to fast Fourier transform. Importance-oriented techniques use other characteristics of images as the basis for compression. For example, DVI technique uses color look-up tables and data filtering.
a. Lossless (Noiseless)
Huffman
Arithmetic Decomposition
Lempel Ziv
Lossy (Noisy)
b.
Frequency Oriented
Predictive
Motion Compensation
Transform
Run length
Importance Oriented
Subband
Filtering
Bit Allocation
Subsampling
Hybrid
Quantization
JPEG
MPEG
p x 64
Scalar
Vector
Figure 5. Classification schemes for (a) lossless and (b) lossy compression techniques. The hybrid compression techniques, such as JPEG, MPEG, and px64, combine several approaches including DCT, quantization, motion estimation, and Huffman coding. Recently, standards for digital multimedia have been established based on these three techniques, as illustrated in Table 2. Table 2. Multimedia Compression Standards Short Name
JPEG
H.261/H.263 or px64 Kbps MPEG
Official Name
Digital compression and coding of continuous-tone still images Video encoder/decoder for audio-visual services at px64 Kbps Coding of moving pictures and associated audio
Standards Group
Joint Photographic Experts Group Specialist Group on Coding for Visual Telephone Moving Pictures Experts Group
Typical Compression Ratios 15:1 Full color still-frame applications 100:1 to 200:1 Video-based telecommunications 50:1 Motion-intensive applications
Image Presentation and Compression 4.
155
JPEG ALGORITHM FOR FULL COLOR STILL-IMAGE COMPRESSION
Originally, JPEG standard is targeted for full color still-frame applications, achieving 15:1 average compression ratio [1,2,4,5,6,7]. However, JPEG is also applied in some real-time, full-motion video applications (Motion JPEG-MJPEG). JPEG standard provides four modes of operation: • sequential DCT-based encoding, in which each image component is encoded in a single left-to-right, top-to-bottom scan. • progressive DCT-based encoding, in which the image is encoded in multiple scans, in order to produce a quick, rough decoded image when the transmission time is long. • lossless encoding, in which the image is encoded to guarantee the exact reproduction, and • hierarchical encoding, in which the image is encoded in multiple resolutions. 4.1 SEQUENTIAL JPEG ENCODER AND DECODER The block diagram of the JPEG sequential encoder and decoder is shown in Figure 6.
Source Image data
JPEG Encoder Forward Discrete Cosine Transform
Compressed Image Data Entropy Encoder
Quantizer
8x8 blocks
Table Specification
Table Specification
Reconstructed Image Data
JPEG Decoder Compressed Image Data Entropy Decoder
Dequantizer
Table Specification
Inverse DCT
Table Specification
Figure 6. Block diagram of sequential JPEG encoder and decoder. JPEG Encoder The original samples, in the range [0, 2 p -1], are shifted to sign in the range [-2p-1-1]. For a grayscale image, where p=8, the original samples in the range [0, 255], are shifted in the range [-128, + 127]. These values are then transformed into the frequency domain using the Forward Discrete Cosine Transform (FDCT) using the following equations:
F ( u, v ) =
C ( u) 2
•
7
C (v ) 2
7
∑ ∑ f ( x, y ) cos x =0
y=0
( 2 x + 1) uπ 16
cos
(2 y + 1) vπ 16
156
Chapter 8
where
C (u ) =
1 2
for u = 0
C (u ) = 1 for u > 0 C (u ) =
1 2
for v = 0
C (u ) = 1 for v > 0 The transformed 64-point discrete signal is a function of two spatial dimensions x and y, and its components are called spatial frequencies or DCT coefficients. The F(0,0) coefficient is called the “DC coefficient,” and the remaining 63 coefficients are called the “AC coefficients.” Several fast DCT algorithms are presented and analyzed in [1]. For a typical 8x8 image block, most of the spatial frequencies have zero or near-zero values, and need not be encoded. This is illustrated in JPEG example, presented later in the chapter. This fact is the foundation for achieving data compression. In the next step, all 64 DCT coefficients are quantized using a 64-element quantization table, specified by the application. The quantization reduces the amplitude of the coefficients, which contribute little or nothing to the quality of the image, with the purpose of increasing the number of zero-value coefficients. Quantization also discards information, which is not visually significant. The quantization is performed according to the following equation:
Fq (u, v) = Round
[
F (u ,v) Q (u , v )
]
where Q(u, v) are quantization coefficients specified in the quantization table. Each element Q(u, v) is an integer from 1 to 255, which specifies the step size of the quantizer for its corresponding DCT coefficient. A set of four quantization tables is specified by JPEG standard [1]. In the JPEG example, a quantization formula is used to produce the quantization tables. DC
AC
AC
70
01
AC
07
AC
77
Figure 7. Zig-zag ordering of AC coefficients.
Image Presentation and Compression
157
After quantization, the 63 AC coefficients are ordered into the “zig-zag” sequence, as shown in Figure 7. This zig-zag ordering will help to facilitate the next phase, entropy encoding, by placing low-frequency coefficients, which are more likely to be nonzero, before highfrequency coefficients. This is confirmed by the experiment presented by Pennenbaker and Mitchell [1] and the results are shown in Figure 8. These results show that when the coefficients are ordered zigzag, the probability of coefficients being zero is an increasing monotonic function of the index. The DC coefficients, which represent the average values of the 64 image samples, are coded using the predictive coding techniques, as illustrated in Figure 9.
1.0 Probability of being nonzero
0.5
0.0
0
8
16
24
32
40
48
56
63
Zigzag index
Figure 8. Probability of being nonzero of zig-zag ordered DCT coefficients. The reason for predictive coding of DC coefficients is that there is usually a strong correlation between the DC coefficients of adjacent 8x8 blocks. As a consequence, the compression ratio will be improved. Finally, the last block in the JPEG encoder is the entropy coding, which provides additional compression by encoding the quantized DCT coefficients into more compact form. The JPEG standard specifies two entropy coding methods: Huffman coding and arithmetic coding [1]. The baseline sequential JPEG encoder uses Huffman coding. The Huffman coder converts the DCT coefficients after quantization into a compact binary sequence using two steps: (1) forming intermediate symbol sequence, and (2) converting intermediate symbol sequence into binary sequence using Huffman tables. DCi Sample
Previous Sample DCi-1
DCi
+
Difference
-
DCi – DCi-1
D C i-1
blocki-1
Figure 9. Predictive coding for DC coefficients.
blocki
158
Chapter 8
In the intermediate symbol sequence, a pair of symbols represents each AC coefficient: Symbol-1 (RUNLENGTH, SIZE)
Symbol-2 (AMPLITUDE)
where: RUNLENGTH is the number of consecutive zero-lined AC coefficients preceding the nonzero AC coefficient. The value of RUNLENGTH is in the range 0 to 15, which requires 4 bits for its representation. SIZE is the number of bits used to encode AMPLITUDE. The number of bits for AMPLITUDE is in the range of 0 to 10 bits, so there are 4 bits needed to code SIZE. AMPLITUDE is the amplitude of the nonzero AC coefficient in the range of [+1024 to -1023], which requires 10 bits for its coding. In an example, if the sequence of AC coefficients is
0, 0, 0, 0, 0, 0, 476 1442443 6
The symbol representation of the AC coefficient 476 is: (6, 9) (476) where: RUNLENGTH = 6, SIZE = 9, and AMPLITUDE = 476. If RUNLENGTH is greater than 15, then symbol-1 (15,0) is interpreted as the extension symbol with runlength = 16. These can be up to three consecutive (15, 0) extensions. In the following example: (15, 0) (15, 0) (7, 4) (12) RUNLENGTH is equal to 16+16+7 = 39, SIZE = 4, and AMPLITUDE = 12. The symbol (0,0) means ‘End of block’ (EOB) and terminates each 8x8 block. For DC coefficients, the intermediate symbol representation consists of: Symbol - 1 (SIZE)
Symbol – 2 (AMPLITUDE)
Because DC coefficients are differentially encoded, this range is double the range for AC coefficients, and is [-2048, + 2047]. The second step in Huffman coding is converting the intermediate symbol sequence into binary sequence. In this phase, symbols are replaced with variable length codes, beginning with the DC coefficients, and continuing with AC coefficients. Each Symbol-1 (both for DC and AC coefficients) is encoded with a Variable-Length Code (VLC), obtained from the Huffman table set specified for each image component. The generation of Huffman tables is discussed by Pennenbaker and Mitchell [1]. Symbol-2 is encoded using a Variable-Length Integer (VLI) code, whose length in bits is given in Table 3. For example, for an AC coefficient presented as the symbols
Image Presentation and Compression
159
(1, 4) (12) the corresponding binary presentation will be: (1111101101100), where (111110110) is VLC obtained from the Huffman table, and (1100) is a Variable-Length Integer (VLI) code for 12. Table 3. Huffman Coding of Symbols-2 Size 1 2 3 4 5 6 7 8 9 10
Amplitude range (-1, 1) (-3, -2) (2, 3) (-7..-4) (4..7) (-15..-8) (8..15) (-31..-16) (16..31) (-63..-32) (32..63) (-127..-64) (64..127) (-255..-128) (128..255) (-511..-256) (256..511) (-1023..-512) (512..1023)
JPEG Decoder In the JPEG sequential decoding, all the steps from the encoding process are inversed and implemented in reverse order, as shown in Figure 6. First, an entropy decoder (such as Huffman) is implemented on the compressed image data. The binary sequence is converted to s symbol sequence using Huffman tables (VLC coefficients) and VLI decoding, and then the symbols are converted into DCT coefficients. Then, the dequantization is implemented using the following function: Fq (u , v ) = Fq ( u , v ) × Q (u , v )
Then, the Inverse Discrete Cosine Transform (IDCT) is implemented on dequantized coefficients in order to convert the image from frequency domain into spatial domain. The IDCT equation is defined as
7 F (x , y ) = 14 ∑ u =0
7
∑ C (u ) C (v) F (u, v ) cos
( 2 x 1) µπ 16
cos (2 y +161) µπ
v =0
where
C( u) =
1 2
for u = 0
1 2
for v = 0
C(u ) = 1 for u > 0 C( v ) =
C( v ) = 1 for v > 0 The last step consists of shifting back the decompressed samples in the range [0, 2p – 1].
160
Chapter 8
4.2 COMPRESSION MEASURES The basic measure for the performance of a compression algorithm is Compression Ratio (Cr ), defined as
Cr =
Originaldata size Compressed data size
There is a trade-off between the compression ratio and the picture quality. Higher compression ratios may produce lower picture quality. Quality and compression can also vary according to source image characteristics and scene content. One measure for the quality of the picture, proposed by Wallace [2], is the number of bits per pixel in the compressed image (Nb ) which is defined as the total number of bits in the compressed image divided by the number of pixels:
Nb =
Encoded _ number _ of _ bits Number _ of _ pixels
According to this measure, four different picture qualities are defined [2], as shown in Table 4. Another statistical measure that can be used to evaluate various compression algorithms is the Root Mean Square (RMS) error, calculated as
RMS = 1n
n
∑( X
i
− Xˆi ) 2
i =1
where
X i - original pixel values Xˆ i - pixel values after decompression n - total number of pixels in an image The RMS shows the statistical difference between the original and decompressed images. However, in some cases, the quality of a decompressed image with higher RMS is better than one with lower RMS. In the next two sections, we will calculate these measures in several examples. Table 4. Picture Quality Characteristics Nb [bits/pixel] 0.25 – 0.5 0.5 – 0.75 0.75-1.0 1.5-2.0
Picture quality Moderate to good quality Good to very good quality Excellent quality Usually indistinguishable original
from
the
Image Presentation and Compression
161
4.3 SEQUENTIAL JPEG ENCODING EXAMPLE In order to illustrate all the steps in baseline sequential JPEG encoding, we present step-bystep results obtained in encoding an 8x8 block of 8-bit samples, as illustrated in Figure 10. The original 8x8 block is shown in Figure 10(a) and, after shifting, the obtained block is given in Figure 10(b). After applying the FDCT, the obtained DCT coefficients are given in Figure 10(c). Note that, except for low-frequency coefficients, all the other coefficients are close to zero. (a) Original 8x8 block 140 144 152 168 162 147 136 148
144 152 155 145 148 167 156 155
1471140 140 155 179 175 140 147 140 148 167 179 136 167 163 162 152 172 156 160 152 155 136 160 156 148 140 136 147 162 140 155 155 140 136 162 123 167 162 144 140 147 136 155 152 147 147 136
(b) Shifted block 12 16 19 12 11 27 51 47 16 24 12 19 12 20 39 51 24 27 8 39 35 34 24 44 40 17 28 32 24 27 8 32 34 20 28 20 12 8 19 34 19 39 12 27 27 12 8 34 8 28 -5 39 34 16 12 19 20 27 8 27 24 19 19 8
(d) Quantization Table (quality=2)
(c) Block after FDCT Eq. (5.1) 185 -17 14 -8 23 -9 -13 -18 20 -34 26 -9 -10 10 13 6 -10 -23 -1 6 -18 3 -20 0 -8 -5 14 -14 -8 -2 -3 8 -3 9 7 1 -11 17 18 15 3 -2 -18 8 8 -3 0 -6 8 0 -2 3 -1 -7 -1 -1 0 -7 -2 1 1 4 -6 0
(e) Block after quantization Eq. (5.2)
3 5 7 9 11 13 15 17 5 7 9 11 13 15 17 19 7 9 11 13 15 17 19 21 9 11 13 15 17 19 21 23 11 13 15 17 19 21 23 25 13 15 17 19 21 23 25 27 15 17 19 21 23 25 27 29 17 19 21 23 25 27 29 31
61 -3 2 0 2 4 -4 2 0 0 -1 -2 0 0 -1 0 0 1 0 0 0 0 0 0 0 0 0 -1 0 0 0 0 0 0 0 0 0 0 0 0
0 0 0 0 0 0 0 0
0 -1 0 0 -1 0 0 0 0 0 0 0 0 0 0 0
(f) Zig-zag sequence
61,-3,4,-1,-4,2,0,2,-2,0,0,0,0,0,2,0,0,0,1,0,0,0,0,0,0,-1,0,0,-1,0,0, 0,0,-1,0,0,0,0,0,0,0,-1,0,0,0,0,0,0,0,0,0,0,0,0,0,0,0,0,0,0,0,0,0,0 (g) Intermediate symbol sequence
(6)(61),(0,2)(-3),(0,3)(4),(0,1)(-1),(0,3)(-4),(0,2)(2),(1,2)(2),(0,2)(-2), (0,2)(-2),(5,2)(2),(3,1)(1),(6,1)(-1),(2,1)(-1),(4,1)(-1),(7,1)(-1),(0,0) (e) Encoded bit sequence (total 98 bits)
1110111101001001000001000110110110111001011111111011 11011101011111011011100011101101111101001010
Figure 10. Step-by-step procedure in JPEG sequential encoding of an 8x8 block.
For the generation of the Quantization Table, we used the program proposed by Nelson [3]: for i = 0 to n; for j = 0 to n; Q[I, j] = 1 + (1 + I + j)* quality; end j; end i;
162
Chapter 8
The parameter ‘quality’ specifies the quality factor and recommended range is from 1 to 25, where quality = 1 gives the best quality, but the lowest compression rate, and quality = 25 gives the worst quality and the highest compression rate. In our example, we used quality = 2, which generates the Quantization Table in Figure 10(d). After implementing quantization, the obtained quantized coefficients are shown in Figure 10(e). Note that a number of high-frequency AC coefficients are zero. The zig-zag ordered sequence of quantized coefficients is shown in Figure 10(f), and the intermediate symbol sequence in Figure 10(g). Finally, after implementing Huffman codes, the obtained encoded bit sequence is shown in Figure 10(h). The Huffman table used in this example is proposed in the JPEG standard for luminance AC coefficients (3), and the partial table needed to code the symbols from Figure 11(g) is given in Table 5. Table 5. Partial Huffman Table for Luminance AC Coefficients (Runlength, size)
Code word
(0,,0) EOB (0,1) (0,2) (0,3) (1,2) (2,1) (3,1) (4,1) (5,2) (6,1) (7,1)
1010 00 01 100 11011 11100 111010 111011 11111110111 1111011 11111010
Note that the DC coefficient is treated as being from the first 8x8 block in the image, and therefore, it is coded directly (not using predictive coding as all the remaining DC coefficients). For this block the compression ratio can be calculated as
Cr =
64 × 8 512 = = 5.22 98 98
The number of bits/pixel in the compressed form is
Nb =
98 = 1.53 64
4.4 JPEG COMPRESSION OF COLOR IMAGES The described sequential JPEG algorithm can be easily expanded for compression of color images, or, in a general case, for compression of multiple-component images. The JPEG source image model consists of 1 to 255 image components [2,7], called color or spectral bands, as illustrated in Figure 11. For example, RGB and YUV representations both consist of three color components. Each component may have a different number of pixels in the horizontal (X I) and vertical (YI) axis. Figure 12 illustrates two cases of a color image with three components. In the first case, all
Image Presentation and Compression
163
three components have the same resolutions, while in the second case they have different resolutions.
. C.
C1
CN
Ci
2
top
samples
y
line yi
left xi
bottom
x Figure 11. JPEG source image model.
C1
C2
C3
X
X
X
Y
Y
X/2
X
Y
Y
Y
X/2
Y
Figure 12. Color image with three components: (a) with same resolutions; (b) with different resolutions. The color components can be processed in two ways: •
•
Non-interleaved data ordering, in which processing is performed component by component from left-to-right and top-to-bottom. In this mode, for a RGB image with high resolution, the red component will be displayed first, then the green component, and finally the blue component. Interleaved data ordering, in which different components are combined into so-called Minimum Coded Units (MCUs).
164
Chapter 8
Block diagrams of the encoder and decoder for color JPEG compression are identical to those for grayscale image compression, shown in Figure 7, except the first block into the encoder is a color space conversion block. For example, the first block provides RGB to YUV conversion at the encoder side, and at the decoder side the last block is the inverse color conversion, such as YUV to RGB. 4.5 PROGRESSIVE JPEG COMPRESSION TECHNIQUES In some applications, an image may have large numbers of pixels and the decompression process, including transmission of the compressed image over the network, may take several minutes. In such applications, there may be a need to produce a rough image quickly, and then improve its quality using multiple scans [1,2,7]. The progressive JPEG mode of operation produces a sequence of scans, each scan coding a subset of DCT coefficients. Therefore, the progressive JPEG encoder must have an additional buffer at the output of the quantizer and before the entropy encoder. The size of the buffer should be large enough to store all DCT coefficients of the image, each of which is 3 bits larger than the original image samples. Figure 13 illustrates the differences in displaying a decompressed image in the progressive and sequential JPEG. Progressive
Sequential
Figure 13. Progressive vs sequential JPEG decoding. Progressive JPEG compression can be achieved using three algorithms. (1) (2) (3)
Progressive spectral selection algorithm Progressive successive approximation algorithm Combined progressive algorithm
In the progressive spectral selection algorithm, the DCT coefficients are grouped into several spectral bands. Typically, low-frequency DCT coefficients bands are sent first, and then higher-frequency coefficients. For example, a sequence of four spectral bands may look like this: Band 1: Band 2: Band 3: Band 4:
DC coefficient only AC1 and AC2 coefficients AC3 , AC4 , AC5 , AC6 , coefficients AC7 ,… AC63 , coefficients
Image Presentation and Compression
165
In the progressive successive approximation algorithm, all DCT coefficients are sent first with lower precision, and then refined in later scans. For example, a sequence of three successive approximation bands may be as follows: Band 1: All DCT coefficients (divided by four) Band 2: All DCT coefficients (divided by two) Band 3: All DCT coefficients (full resolution) Combined progressive algorithm combines both spectral selection and successive approximation algorithms. Figure 14 illustrates an image divided into eight combined scans. For example, in the first scan only DC coefficients divided by two (will lower resolution) will be sent, and so on. Bits
AC band-1
DC band-1
AC band-2
AC band-3
2 AC band-4
1 0
DC band-2
0
AC band-5 AC band-6
1
DCT coefficents
2
SCAN 1: DC band-1 SCAN 2: AC band-1 SCAN 3: AC band-2 SCAN-4: AC band-3
SCAN 5: AC band-4 SCAN 6: AC band-5 SCAN 7: DC band-2 SCAN 8: AC band-6
Figure 14. An example of image encoded using the combined progressive JPEG algorithm. Progressive JPEG Experiment In this experiment, we implemented both progressive algorithms, spectral selection (SS), and successive approximation (SA) to compress and decompress a 320x200 grayscale image “Cheetah.” In both cases, we used four scans, as follows:
Scan 1 Scan 2 Scan 3 Scan 4
Spectral selection DC, AC1, AC2 AC3-AC9 AC10-AC35 AC36 – AC63
Successive approximation All DCT – divided by 8 All DCT – divided by 4 All DCT – divided by 2 All DCT – full resolution
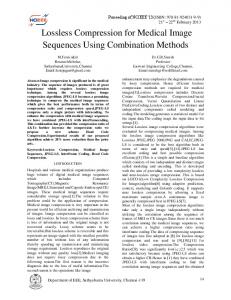
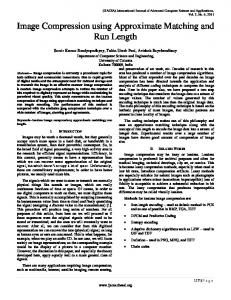
The results of the experiments are presented in Tables 6 and 7. Figures 15 and 16 show results of sequential and progressive JPEG compression using Easy/Tech/Codec, respectively. In the case of sequential JPEG, compression ratios obtained are in the range 21 to 52. Assuming an image transmitted over a 64 Kbit/s ISDN network, the following four images are produced using progressive JPEG (Figure 16). The first image of reduced quality appears on the screen very quickly, in 0.9 s. Each subsequent pass improves the image quality and it is obtained after 1.6, 3.6 and 7.0 s, respectively.
166
Chapter 8
Table 6. Progressive Spectral Selection JPEG (Image ‘Cheetah’: 320x240 pixels à 512,000 bits) Scan number
Bits transmitted
Compression ratio
Bits/pixel
RMS error
1 2 3 4 Sequential JPEG
29,005 37,237 71,259 32,489 172,117
17.65 7.73 3.72 3.01 2.97
0.45 1.04 2.15 2.66 2.69
19.97 13.67 7.90 4.59 4.59
Table 7. Progressive Successive Approximation JPEG (Image ‘Cheetah’: 320x240 pixelsà 512,000 bits) Scan number
Bits transmitted
Compression ratio
Bits/pixel
RMS error
1 2
26,215 34,506 63,792 95,267 172,117
19.53 8.43 4.11 2.33 2.97
0.41 0.95 1.95 2.43 2.69
22.48 12.75 7.56 4.59 4.59
3 4 Sequential JPEG
Note that in both algorithms, the first scan will be transmitted 6 to 7 times faster than the sequential JPEG algorithm (26,215 bits in SA and 29,005 bits in SS vs 172,ll7 bits in sequential JPEG). 4.6 INTERACTIVE PROGRESSIVE JPEG We developed an interactive progressive JPEG system for an efficient transmission of complex images. This system is intended for those applications that require a fast transmission of complex, high-quality, high-resolution images through the network with a limited bandwidth. These applications include transmission of medical images, space and earth exploration applications, as well as Internet applications. This technique can also be applied to image archive and browsing systems. The system operates as follows. Users submit requests for imagery to the remote database via a graphical user interface. Images in the database are stored in compressed form using standard JPEG compression technique using quantization tables, which provide very high quality and low compression rates. Upon an initial request, a DCT image is transmitted and reconstructed at the user site. The DCT image is a version of an image based only on DC coefficients. The transmission of a DCT image, even for very complex images, will take a relatively short time. The user can then isolate specific regions of interest within the image and request additional levels of details through additional scans. In each scan, additional DCT coefficients are transmitted, which improve the quality of the selected region of the image. If all levels of detail are sent, the transmitted image is visually indistinguishable from the original.
Image Presentation and Compression
167
Figure 15. Sequential JPEG results using Easy/Tech Codec (courtesy of Autograph International). (a) Original image; (b) compression factor 21:1 (low); (c) compression factor 33:1 (medium); (d) compression factor 52:1 (high).
168
Chapter 8
Figure 16. Progressive JPEG results using Easy/Tech Codec (courtesy of Autograph International).
(a) Image after 0.9 s; (b) image after 1.6 s; (c) image after 3.6 s; (d) image after 7.0 s.
Image Presentation and Compression
169
4.6 LOSSLESS JPEG COMPRESSION JPEG standard also supports a lossless mode of operation, by providing a simple predictive compression algorithm, rather than DCT-based technique, which is a lossy one. Figure 17 shows the block diagram of the lossless JPEG encoder, in which a prediction block has replaced the FDCT and the quantization blocks from the baseline sequential DCT-based JPEG. The predictor block works in a way that a prediction of the sample Xˆ is calculated on the basis of previous samples A, B and C, and then the difference ∆X=X- Xˆ is computed, where X is the actual value of the sample [Figures 18(a) and (b)]. Then, the difference ∆X is coded using the Huffman arithmetic encoder. Table 8 illustrates several different predictor formulae than can be used for lossless prediction. Lossless JPEG compression typically gives approximately 2:1 compression ratio for moderately complex color images. 4.7 HIERARCHICAL JPEG COMPRESSION The hierarchical JPEG mode of operation creates a set of compressed images beginning with the small images and then increasing resolution. This process is called down-sampling or pyramidal coding [3,5,8]. After the down-sampling phase, each lower-resolution image is scaled up to the next resolution (up-sampling process), and is used as a prediction for the following stage. Hierarchical JPEG encoder requires significantly more buffer space. However, the benefits are that the encoded image is immediately available at different resolutions. Source Image Data
Lossless JPEG Encoder Predictor
Compressed Image Data
Entropy Encoder
Table Specification
Figure 17. Block diagram of the lossless JPEG encoder.
5. CONCLUSION In this chapter we presented JPEG compression standard, intended for full-color still-image compression. Several experiments have been performed with the aim of illustrating features and performance of various JPEG techniques, such as sequential, progressive, and lossless techniques. A number of vendors offered software and hardware JPEG implementations, and commercial systems include ALICE 200 from Telephoto, the Super Still-Frame Compression Card from New Medial Graphics, and Optipac 3250 and 5250 JPEG compression accelerator boards from Optivision. LSI Logic has developed L64702 JPEG compressor that can support real-time video applications.
170
Chapter 8
The most popular use of JPEG image compression technology includes its use in photo ID systems telecommunications of images, military image systems, and distributed image management systems. Nonstandard image compression techniques include vector quantization [8], subband coding and wavelet-based compression, fractal compression, and many other schemes.
a)
b) X
C B
+
X-X
A X Previous samples A,B,C
X X=f(A,B,C)
-
to entropy encoder
X=f(A,B,C)
Figure 18. Lossless JPEG encoding: (a) location of four samples in the predictor, (b) predictor block diagram. Table 8. Predictors for Lossless JPEG Compression Selection value 0 1 2 3 4 5 6 7
Predictor formula No prediction X=A X=B X=C X=A+B-C X=A+(B-C)/2 X=B+(A-C)/2 X=(A+B)/2
REFERENCES 1. 2. 3. 4. 5. 6. 7. 8.
W.B. Pennenbaker and J.L. Mitchell, “JPEG Still Image Data Compression Standard,” New York, Van Nostrand Reinhold, 1993. G. Wallace, “The JPEG still picture compression standard,” Communications of the ACM, Vol. 34, pp. 30-44, 1991. M. Nelson, “The Data Compression Book,” San Mateo, CA, M&T Books, 1992. R. Steinmetz, “Data Compression in Multimedia Computing – Standards and Systems,” Part I and II, Journal of Multimedia Systems, Vol. 1, pp. 166-172 and 187-204, 1994. R. Aravind, G. L. Cash, D. C. Duttweller, H-M. Hang, B.G. Haskel, and A. Puri, “Image and Video Coding Standards,” AT&T Technical Journal, Vol. 72, pp. 67-88, 1993. V. Bhaskaran and K. Konstantinides, “Image and Video Compression Standards – Algorithms and Architectures,” Kluwer Academic Publishers, Norwell, MA, 1995. B. Furht, “A Survey of Multimedia Compression Techniques and Standards – Part I: JPEG Standard,” Real-Time Imaging Journal, Vol. 1, pp. 49-67, 1995. A. Gersho and R.M. Gray, “Vector Quantization and Signal Compression,” Kluwer Academic Publishers, Norwell, MA, 1992.
Image Presentation and Compression
171