HALE. Imaging. Polarimeter. SOFIA. 2005? 1024 â TES. 30. 4·10-16. 1 .... Bock, J.J., Glenn, J., Grannan, S.M., Irwin, K.D., Lange, A.E., LeDuc, H.G. & Turner, ...
Astronomy Applications of Superconducting Transition Edge Sensor Bolometer Arrays Dominic J. Benford & S. Harvey Moseley NASA - Goddard Space Flight Center, Code 685, Greenbelt, MD 20771 Abstract Studies of astrophysical emission in the far-infrared and submillimeter increasingly require large arrays of detectors containing hundreds to thousands of elements. The last five years have seen the increasing from one to ~100 bolometers on ground-based telescopes. A further jump of this magnitude, to thousands of bolometers, requires a fundamental redesign of the technology of making bolometer arrays. One method of achieving this increase is to design bolometers which can be packed into a rectangular array of near-unity filling factor while Nyquist-sampling the focal plane of the telescope at the operating wavelengths. In this case, the array becomes more nearly analogous to the arrays used in the near-infrared, which underwent a substantial growth during the last decade. A multiplexed readout is necessary for this many detectors, and has been developed using SQUIDs. In the future, a 32×32 array of bolometers could be read out using 100 wires rather than the >2000 needed with a brute force expansion of existing arrays. Superconducting transition edge sensors are used as the detectors for these bolometer arrays. This technology is well suited to low background instruments such as SPIRE on FIRST and SAFIRE on SOFIA, and could also be used in broadband, high background instruments such as HAWC on SOFIA. For future cryogenic space-based telescopes such as CIRCE and FAIR/SAFIR, superconducting bolometers will be the technology of choice for large arrays of fast, sensitive detectors. Keywords: bolometer, far-infrared, submillimeter, superconducting, SQUID, detector array, multiplexer, transition edge sensor Introduction Advances in bolometer fabrication have made possible the construction of submillimeterwavelength cameras with several tens of detectors (e.g., CSO - SHARC (Wang et al. 1996), JCMT - SCUBA (Holland et al. 1996), IRAM 30m (Kreysa et al. 1998)). Currently, the sensitivity of these instruments is background-limited, so deep- and wide-field surveys are limited by the number of detectors and the amount of observing time available. Instruments currently in construction such as SHARC-II (384 detectors) and SCUBA-II (25,600 detectors) require a scalable detector architecture in order to leap to such a large format. Such an architecture must deal with both the fabrication of an array and the electronics used to read it out. Conventional technologies use semiconducting thermistors as the detection element, with the alternative being superconducting transition edge sensors. Another common feature of most bolometer arrays is the use of feedhorn-coupled (typically spaced by 2f λ) arrays, with the alternative being a filled array (f λ/2) of close-packed square bolometers. Elsewhere in these proceedings (Moseley et al. 2000), we present a suggestion for an architecture which can be readily scaled to kilopixel arrays using superconducting sensors and a multiplexed amplifier technique (Chervenak et al. 1999) to reduce the wiring overhead. In our implementation, we choose to use the close-packed geometry, which has been shown to yield an improvement in mapping speed per focal plane area (Bock et al. 1998). However, the superconducting detectors can be used regardless of array geometry, and are equally feasible for arbitrary array implementations.
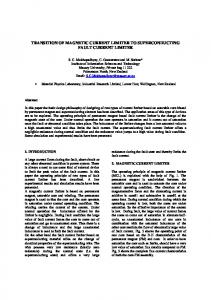
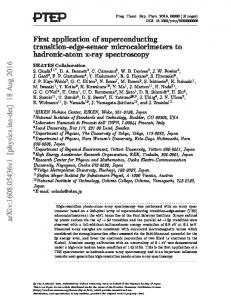
Detector arrays of this type are currently being developed for use in the SAFIRE instrument for SOFIA (Shafer et al. 2000) and for a ground-based spectrometer FIBRE (Maffei et al. 1994; Pajot et al. 2000). A common figure of merit for bolometers is the Noise Equivalent Power (NEP), the power that yields a signal-to-noise ratio of unity in a 1 Hz bandwidth. For SAFIRE, performing observations of the CII line at 158µm (1900GHz) with a spectral resolving power of 1000, the maximum NEP for the detectors must be 10–17 W/√Hz. NEP can be converted into an equivalent noise temperature TN = NEP/(2k√∆ν) (Phillips 1988). In the above case, this yields a noise temperature of around 8K. While not achievable with heterodyne spectrometers due to the quantum limit, direct detection has no such restriction. Superconducting Bolometer Arrays For the past two years, superconducting transition edge sensor (TES) bolometer arrays using SQUID amplifiers have been developed by a collaboration between NASA’s Goddard Space Flight Center and NIST/Boulder. Results have been presented elsewhere (Benford et al. 2000) and in these proceedings (Moseley et al. 2000, Chervenak et al. 2000, Nam et al. 2000). The component technologies for producing large-format arrays of close-packed, background-limited detectors have been demonstrated. For illustration, a single linear array is shown in Figure 1, while a TES transition is shown in Figure 2.
Figure 1. SEM photograph of a single row of bolometers. The enlargement shows the TES Mo/Au bilayer present on each detector. 0.35
0.30
Resistance (Ω)
0.25
0.20
0.15
n = 0.3277 Ω c = 0.4521 K
0.10
ensitivity = 1100 0.05
0.00 0.400
0.410
0.420
0.430
0.440
0.450
0.460
0.470
0.480
0.490
0.500
Temperature (K)
Figure 2. Resistance vs. temperature for a high-sensitivity TES bilayer.
Background Power and Noise of a Bolometer For a bolometer of area A exposed to incident light from a blackbody at temperature T subtending a solid angle Ω, the power absorbed by the bolometer is given by: ν'
2 hν 3 ε (ν )η(ν )α (ν ) ⋅ dν , hν / kT 2 c e − 1 ν0
P = AΩ ∫
(1)
where ε, η, and α are the emissivity, optical efficiency, and bolometer absorptivity at frequency ν , respectively. For a sufficiently narrowband instrument, where these parameters can be approximated as frequency-independent, the detected power is then:
2 hν 3 εηα∆ν P = AΩ 2 ⋅ hν / kT c e −1
(2)
AΩ ν ∆ν 0.048(ν GHz ) ( T K ) −1 e = 15εηα 2 − 1 fW . m sr GHz GHz 3
(3)
Presented below in Table 1 are some representative background powers calculated using equation 3. Table 1. Calculated background powers for recent and future FIR bolometer imagers (SHARC, HAWC, CIRCE, SPIRE) and spectrometers (FIBRE, SAFIRE).
Instrument SHARC SHARC II HAWC @ 60µm FIBRE SAFIRE SPIRE / FIRST CIRCE 100µm CIRCE 500µm
0.1 0.3
ν, ∆ν (GHz) 850, 100 850, 100
T (K) 273 273
Power (pW) 60 90
Wang 1996 Dowell 2000
6·10-10
0.07
5200, 1200
273
70
Evans
5·10-8 10-8
0.1 0.1
850,0.6 2000, 1
273 273
0.2 0.3
Pajot 2000 Shafer 2000
2·10-8
0.01
1200, 300
80
1.5
Moseley 2000
10-8
0.01
3000, 500
5
16 fW
-
3·10-7
0.01
600, 100
5
20 fW
-
AΩ (m2sr) 10-7 5·10-8
εηα
Ref.
A background-limited instrument will detect noise dominated by foreground sources (nomenclature notwithstanding). For most far-infrared instruments, either the atmosphere or the telescope emission dominates the noise, which is given by (Benford, Hunter & Phillips 1998):
NEP 2 =
kT 4ε kThν∆ν 1 + εα , 2 hν ηMBα (1 − ε )
(4)
where ηMB is the main beam efficiency of the telescope. This is the optical NEP referred to a source above the atmosphere; for the electrical NEP, the expression is: 2 = NEPelect
4α kT kThν∆ν 1 + α . ε hν
(5)
Finally, the optical NEP can be converted into an astronomically useful quantity, the Noise Equivalent Flux Density (NEFD) through:
NEFD =
2 NEP Atel ∆ν
(6)
where Atel is the telescope primary mirror collecting area. The saturation power, NEP, and NEFD are listed in Table 2 for a variety of past, present, and proposed instruments using GSFC/NIST bolometer arrays. Some of these devices use implanted Si thermistors; for these, the saturation power is the background power under normal operating conditions. Table 2. Some parameters of a variety of bolometer-based instruments, both past and future. Saturation power, NEP, and NEFD are calculated using equations 3, 4 and 6. Instrument KAO SHARC I SPIRE Prototype FIBRE SHARC II SPIFI HAWC @ 60µm SAFIRE MBC SAFIRE-II MIRCam HALE MIRSpec SPHINX CIRCE @ 100µm CIRCE @ 500µm
Function Grating Spectrometer Broadband Camera Broadband Camera Fabry-Perot Spectrometer Broadband Camera Fabry-Perot Imager Broadband Camera Fabry-Perot Imager Broadband Camera Fabry-Perot Imager Broadband MIR Camera Imaging Polarimeter Fabry-Perot Imager Broadband Camera Imaging Surveyor Imaging Surveyor
Telescope
Year
# of Pixels / Type of Thermistor
Saturation Power (pW)
NEP (W/√Hz)
NEFD (Jy/√Hz)
KAO
1990
48 - Si
60
1·10-15 †
30 †
CSO
1995
24 – Si
60
3·10-16 †
1†
FIRST
1999 (2007)
16 – TES (2048 – TES)
5
5·10-17 †
0.2
CSO
2000
16 – TES
1
2·10-17
5
CSO
2001
384 – Si
90
5·10-16
0.5
JCMT / ASTRO
2001
32 – TES
1
1·10-17
4 / 45
SOFIA
2003
384 – Si
70
7·10-16
1.3
SOFIA
2003
96+ – TES
1
1·10-17
10
ACT
2003
1024 – TES
~5
~3·10-17
0.01
SOFIA
2005?
1024 – TES
0.2
5·10-18
5
SOFIA
2005?
1024 – TES
~50
~5·10-16
~1
SOFIA
2005?
1024 – TES
30
4·10-16
1
SOFIA
2005?
1024 - TES
~0.2
~2·10-17
~10
SOFIA
2005?
1024 – TES
10
4·10-17
0.1
CIRCE
2007?
256 – TES
0.1
4·10-18
0.7mJy*
CIRCE
2007?
64 – TES
0.1
2·10-18
6mJy*
† Measured values * CIRCE is confusion-limited rather than background-limited, so its NEFD is larger than the background would imply.
Saturation Power of a Superconducting Bolometer When exposed to excessive power – either optical or electrical – the heat will drive a superconducting bolometer into its normal regime. At this point, it ceases to have any appreciable response as a detector. For this reason, it is imperative that the bolometer be designed to avoid saturation under all foreseeable conditions. The saturation of a bolometer occurs when the combined optical and electrical power (Popt and Pelect) exceed the power conducted away thermally by the bolometer mount: Tc
Popt + Pelect ≥
∫ G(T )dT
(7)
Tsink
Saturation Power (W)
where Tc and T sink are the transition temperature and the thermal sink temperature, respectively. The GSFC bolometer design (Moseley et al. 2000) using micromachined silicon structures yields a thermal conductance of G(T)≈2·10-10 T3 W/K for devices with T c~450mK and Tsink~300mK. When biased suitably, the maximum saturation power is obtained with negligible electrical power and a sufficiently low sink that its temperature is unimportant: Psat=5·10-11 Tc4 W. 1E-9 Figure 3 shows the region of available saturation powers for existing detector mechanical designs as a function of 1E-10 SHARC II HAWC transition temperature. The shaded region SHARC I HALE encompasses those detectors that can be 1E-11 built with current technology; above this SPIRE region, the devices cannot be made with FIBRE enough conductance, so will saturate. 1E-12 SAFIRE SPIFI Below this region, devices will conduct so much power as to be insensitive. In reality, 1E-13 CIRCE this region will likely tend to be shallower at high temperatures. For most applications 1E-14 with a known saturation power, the optimum 0.1 1 4 transition temperature will fall slightly to the Temperature (K) left of the lower edge of the shaded region Figure 3. Saturation power for existing detectors. (e.g., Tc=440mK for SPIRE). The thermal conductance also appears in the time constant of bolometers, τ=C/Geff. The effective thermal conductance is increased by a factor L of order 100 for superconducting bolometers as a result of the strong electrothermal feedback (see, e.g., Lee et al. 1998). A bolometer of fixed geometry has a heat capacity C depending only on temperature. A figure of merit for any thermodynamically-limited bolometer design can then be proposed: NEP = 4 kT 2 G and τ = C LG → NEP ⋅ τ = 4 kT 2 C / L (8) which depends only on the temperature (assuming L fixed). Future space missions using cold telescopes in space will require exceptionally low NEPs in order to achieve the background limit; for a fixed bolometer geometry, this places an upper limit on the speed of a detector. The state of the art for semiconducting bolometers (Bock et al. 1998) yields an NEP√τ of approximately 5·10-19 J at 100mK. The GSFC/NIST superconducting bolometers (Moseley et al. 2000; Chervenak et al. 2000) have achieved 2·10-19 J at 440mK with high heat capacity absorbers, and should easily be able to achieve 1000 bolometer) arrays to be constructed for reasonable costs. The performance of each bolometer can be designed for background-limited noise with a tailorable saturation power. Even for future cryogenic space missions, where the background power is more than a thousand times less than for ground-based photometers, this performance can be realized for achievable transition temperatures (~100mK). Despite the extremely low saturation and noise powers achieved, the speed of a superconducting bolometer can remain very high. References Benford, D.J., Hunter, T.R. & Phillips, T.G. 1998, Int. J. IR MM Waves 19 (7), 931 Benford, D.J. et al. 2000, in Proc. Eleventh International Symposium on Space Terahertz Technology, in press Bock, J.J., Glenn, J., Grannan, S.M., Irwin, K.D., Lange, A.E., LeDuc, H.G. & Turner, A.D. 1998, Proc. SPIE v.3357, 297 Chervenak, J.A., Irwin, K.D., Grossman, E.N., Martinis, J.M., Reintsema, C.D. & Huber, M.E. 1999, Appl. Phys. Lett., 74, p.4043 Chervenak, J. et al. 2000, these proceedings Dowell, C.D., Moseley, S.H. & Phillips, T.G. 2000, in Imaging at Radio through Submillimeter Wavelengths. J. Mangum, editor; PASP Conference Series Holland, W.S. et al. 1996, Int J IR MM Waves, 17, p.669 Evans, R.; private communication Kreysa, E., et al. 1998, Proc. SPIE v.3357, 319 Lee, S.-F., Gildemeister, J.M., Holmes, W., Lee, A.T. & Richards, P.L. 1998, App.Opt., 37, 16 Maffei, B. et al. 1994, Infrared Phys. Technol., 35, 2, 321. Moseley, S.H. et al. 2000, these proceedings Nam, S.-W. et al. 2000, these proceedings Pajot, F. et al. 2000, in Proc. XXXVth Rencontres de Moriond, Editions Frontieres, in press Phillips, T.G. 1988, in Millimetre and Submillimetre Astronomy, Wolstencroft & Burton, eds., p.1 Shafer, R.A. et al. 2000, in SPIE Proceedings, “Astronomical Telescopes and Instrumentation 2000”, Munich, Germany Wang et al. 1996, Applied Optics 35, 6629