Jun 23, 2016 - Carla Bernal,â Vıctor H. Cárdenas,â and Veronica Mottaâ¡. Instituto de Fısica y Astronomıa, Facultad de Ciencias,. Universidad de Valparaıso ...
Asymmetry in the reconstructed deceleration parameter Carla Bernal,∗ V´ıctor H. C´ardenas,† and Veronica Motta‡
arXiv:1606.07333v1 [astro-ph.CO] 23 Jun 2016
Instituto de F´ısica y Astronom´ıa, Facultad de Ciencias, Universidad de Valpara´ıso, Av. Gran Breta˜ na 1111, Valpara´ıso, Chile We study the orientation dependence of the reconstructed deceleration parameter as a function of redshift. We use the Union 2 and Loss datasets, by using the well known preferred axis discussed in the literature, finding the best fit reconstructed deceleration parameter. We found that a low redshift transition of the reconstructed q(z) is clearly absent in one direction and amazingly sharp in the opposite one. We discuss the possibility that such a behavior can be associated with large scale structures affecting the data. PACS numbers:
I.
INTRODUCTION
Although the ΛCDM model still remains as the simplest model that fits the observational data, implying the universe is currently expanding at an accelerated rate [1, 2] driven by the cosmological constant Λ, the model is unable to explain both the order of magnitude of its strength and why we live in such a special epoch where both the contribution of this constant and of dark matter are of the same order of magnitude. As a departure from this cosmological constant contribution, cosmologists have proposed the idea of dark energy (DE) [3], a theoretical fluid model characterized by a dynamical equation of state (EoS) parameter p/ρ = w(z), with z being the redshift. If this parameter is constant and equal to w = −1, it corresponds to the cosmological constant. The source of this dynamical DE could be either a new field component filling the universe, as a quintessence scalar field [4], or a modifying gravity [5]. Another venue explored to tackle this problem is based on relaxing the Copernican Principle (CP). This was, in fact, proposed shortly after the discovery of the accelerated expansion [6],[7]. In this case, the effect of DE could be explained away by large-scale nonlinear inhomogeneities. Almost all the work have been based on the spherically symmetric Lemaitre-Tolman-Bondi (LTB) model. In this context, a typical scenario that can mimic the late-time behavior of the ΛCDM model consists of positioning the observer near the center of a deep void 1 − 3 Gpc wide. The vast literature on inhomogeneous studies, in particular the LTB models, is summarized in [8], and [9]. Although it seems unnatural to assume we live inside a huge void (larger than the observed ones), the lesson here is that by modifying the theory through which we interpret the data, it is possible to abandon the also unnatural assumption of the existence of a negative pressure fluid
∗ Electronic
address: carlabernalb[at]gmail.cl address: victor.cardenas[at]uv.cl ‡ Electronic address: veronica.motta[at]uv.cl † Electronic
acting only recently. Assuming the CP is valid, direct explorations of possible departures from the ΛCDM model have been focused mainly through parameterizing specific physical quantities. For example, there are models where the EoS parameter w(z) is parameterized, others where the deceleration parameter q(z) = −¨ aa2 /a˙ is parameterized, and also those where the DE density ρde (z) is directly parameterized. One of the lessons we have learned from these studies is the apparent existence of a tension between the low-redshift observational constraints, and those from high-redshift. For example, there is evidence that the constraints obtained from SNIa, or gas mass fraction in galaxy clusters, points to a different region in the parameter space than those derived from baryon acoustic oscillation (BAO) and cosmic microwave background (CMB) data [10–15] As was showed in [14], once we use models that allows variations, whether in the EoS parameter w(z) or in the DE density X(z) = ρde (z)/ρde (0), the reconstructed deceleration parameter q(z) shows a low-redshift transition when SNIa and gas mass fraction in cluster datasets are used. The evidence for such transition disappears once data from BAO and CMB are added. Then an important connection was recognized. In [16, 17] the authors showed that, using the data from SNIa through the luminosity distance obtained from an LTB model, a similar low-redshift transition in the effective deceleration parameter appears, implying that such a feature can be considered a signal of the existence of a void (underdensity) in our neighborhood. A similar tension between the low-redshift observational constraints and those from high-redshift also manifest in measurements of H0 , as was recently studied in [18], where a strong tension is found by comparing local measurements of H0 and t0 with those from Planck. This tension emerges using the ΛCDM model as the “base” model. Although simple extensions of the ΛCDM model were studied, not all of them alleviated the tension. In [19] the authors showed that the assumption of a large local under-density on radial scales of a few Mpc it is enough to alleviate such a tension. Besides the already mentioned tension, during the last
2 in a flat universe, where E(z) = H(z)/H0 is the reduced Hubble function. Assuming an EoS parameterized by [45, 46] w(z) = w0 +
w1 z , 1+z
(2)
the reduced Hubble function takes the form E 2 (z) = Ωm (1 + z)3 + (1 − Ωm )X(z),
(3)
where Ωm comprises both the baryonic and non baryonic DM, and X(z) = e−
3w1 z 1+z
(1 + z)3(1+w0 +w1 ) .
(4)
From this, following previous works [11, 12], we reconstruct the deceleration parameter function q(z) = (1 + z)
1 dE(z) − 1. E(z) dz
(5)
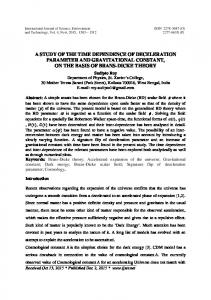
Here we perform the calculation considering error propagation, and display it in Figure 1. Using the best fit
0.5
0.0
qHzL
years several works indicate the existence of a preferred direction of expansion. For example, the large scale bulkflow [20–24], the low multipoles alignment in the CMB angular power spectrum [25], the large scale alignment of quasar polarization [26], and studies using SNIa [27–35]. These studies reported a dipole anisotropy within 1 − 2σ confidence level intriguingly pointing towards the same direction. It is also interesting to notice that some authors conclude that such asymmetry in SNIa data could emerge from a systematic error [36] or simply it does not exist [37]. Of course, there is also the interesting possibility that this behavior is caused by new physics. Certainly both, a possible existence of a huge structure in our neighborhood, and the asymmetry in parameter fitting emerging from the use of low-redshift data, are connected. In this way we use the result of [16] as our main hypothesis in this work. In this paper we want to use the reconstructed deceleration parameter as a probe for hints of a local underdensity and then delve into the effects of orientation on the reconstruction of the deceleration parameter. It is the purpose of this paper to explore how the reconstructed deceleration parameter behaves once the position of the SNIa in the sky is taken into account. In the next section we discuss the data we use in the calculations, and present the procedure used to find the change in the deceleration parameter. In section III we discuss the orientation dependence separating the data in hemispheres. Next, we describe our analysis using four regions with equal number of data points. Finally, we show and discuss the results.
-0.5
-1.0
-1.5 0.0
II.
THE UNION 2 DATA SET
In our previous work on the reconstruction of the deceleration parameter we have made use of different SNIa datasets. For example, we have worked with the Constitution [38], the Union 2 [39], the Union 2.1 [40], and the Loss-Union [41] sets. Because we are interested in studying the effects of the orientation dependence of the data we decided to use a well studied dataset for which different methods have found the same dipole anisotropy. In this work we chose to work with the Union 2 set. The Union 2 dataset consist of 557 SNIa in the range 0.015 < z < 1.4. Union 2 join the Union dataset [42], six SNIa at high redshift found by the Hubble Space Telescope, and low and intermediate redshift data from [43] and [44], respectively. To start with, let us perform the reconstruction using all the data, without considering their position in the sky. This is actually a calculation already made in [11] and [12]. We begin recalling that the co-moving radial coordinate is Z z c dz ′ r(z) = , (1) H0 0 E(z ′ )
0.5
1.0
1.5
2.0
z FIG. 1: Using the Union2 data set we plot the deceleration parameter with error propagation at 2σ. Here is possible to note a transition of q(z) a low-redshift at 1σ C.L.
values found for the parameters – Ωm = 0.420 ± 0.068, w0 = −0.86 ± 0.38, and w1 = −5.5 ± 5.9 – the reconstructed deceleration parameter shows a rapid variation at small redshift, a feature that is also apparent at ∼ 1σ C.L. Although intriguing, the feature has a low statistical significance. To study the consistency of the data with the ΛCDM model we follow the method proposed in [47], where the distance dσ (in units of σ) from the best fit point to the ΛCDM model is defined through the relation √ 1 − Γ(1, ∆χ2 /2)/Γ(1) = Erf(dσ / 2), (6) where the left hand side is the cumulative distribution function (for two parameters), and ∆χ2 = χ2(w0 ,w1 ) − χ2min is the χ2 difference between the best fit and the ΛCDM point (w0 = −1, w1 = 0). In our case, the Union 2 set – under this model – is only 0.62σ away from the ΛCDM.
3 As was shown in [14], the low redshift transition of q(z) at 2σ C.L is observed in both the more recent SNIa data and gas mass fraction data from galaxy clusters. The idea here is to study how this picture changes once the position of the SNIa data is taken into account. III. TESTING THE ORIENTATION DEPENDENCE USING HEMISPHERES
In this section we make use of previous works using the Union 2 set, which determine the maximum and minimum acceleration direction. In particular, we use the result of [27] using the hemispherical asymmetry technique, were they found a dipolar asymmetry with a maximum acceleration towards (l, b) = (309o, 18o ) and a minimum acceleration towards (l, b) = (129o , −18o), in galactic coordinates (see Fig.(2)).
50
b
ø FIG. 3: Here we show the reconstructed deceleration parameter q(z) using data from two hemispheres. The upper panel showing the one around the maximum acceleration point, and the bottom the one in the opposite direction. See Table I for the best fit values for each case.
0
ø -50
0
50
100
150
200
250
300
350
l
FIG. 2: Union 2 data set is plot using galactic coordinates. The points marked by a green (red) star correspond to the points of maximum (minimum) acceleration found in [27].
We start, in this section, by separating the SNIa data in two sets, each one belonging to an hemisphere. In the hemisphere corresponding to the maximum acceleration there are 116 supernovae and in the other the remaining 441. This huge asymmetry in the distribution is essentially due to the fact that in the minimum acceleration hemisphere, we found the SDSS stripe of SNIa data. The best fit values in each hemisphere are displayed in Table I: Ωm ω0 ω1 χ2min /dof A 103.65/113 0.21 ± 0.64 −1.3 ± 1.2 1.5 ± 3.4 B 427.57/438 0.46 ± 0.06 −0.41 ± 0.53 −9.2 ± 7.3 TABLE I: Best fit values of the cosmological parameters for the two hemispheres. Row A for the 116 SNIa in the maximum acceleration hemisphere. Row B the 441 SNIa in the opposite direction. See also Fig.(3).
We notice that the transition feature at low redshift is only evident in the direction of the minimum acceleration, meanwhile in the opposite direction the best fit is
in agreement with ΛCDM. Following the same procedure as in the previous section, we can estimate the confidence for each set of best fit parameters. In the case of the 116 SNIa in the maximum acceleration hemisphere we get a distance of 0.31σ away from the ΛCDM point. In the other hemisphere – in which we observe the low redshift transition of the reconstructed q(z) – we get a distance of 1.76σ away from the ΛCDM best fit. We also notice a large difference in Ωm best fit between hemispheres. This shows us how much the model (our CPL w0 w1 CDM) needs to stretch itself, once the direction of the SNIa is taken into account. Using the result of [16] as our main hypothesis – that a low redshift transition of q(z) can be considered a signal for a local under-density – the result we have found indicates the data (Union 2 set) is able to detect such an underdensity only in one (hemisphere) direction of the sky. This implies that the assumption of a spherically symmetric model for such under-density is not a good idea. Moreover, this result probably suggest the use of a metric with a dipolar asymmetry. At this point, we would like to discuss some of the preliminary results we have found. First of all, we have to stress that only SNIa data have been used. The low redshift transition apparent in Figures 1 and 3 disappear once data from baryon acoustic oscillation (BAO) and cosmic microwave background radiation (CMBR) are taken into account. In this sense, we are exploring a pos-
4 sible cause of the original tension between low and high redshift observational constraints discussed in the introduction. In this case, as is also the case with a similar tension in the determination of H0 , the origin seems to be, as the authors in [19] suggest, the existence of a local under density. However, in this work we add that such under density is only effective in one direction on the sky. It is also worth notice the effect of the number of points used in each hemisphere. The set pointing towards the maximum acceleration has only 116 SNIa. Although the best fit is only 0.3σ away from the ΛCDM values, indicating these data points are in agreement with the concordance model, the sparsity of data points increases the errors considerably. The actual redshift distribution is also worth mentioned in this context. In this hemisphere most of the data, around 65 points, have z < 0.2, with no data in the range 0.2 < z < 0.3, with 45 points distributed around redshift z ≃ 0.5, and almost one point for every redshift bin (△z = 0.1) for z > 0.8. The other hemisphere has a greater number of data points (441) with a redshift distribution that, although decreasing with redshift, it still maintain a large number of data points per redshift bin (△z = 0.1) until z ≃ 1.4. IV.
ANALYSIS BY REGIONS
The results obtained in the previous section used two sets of data with a very different number of points each. In this section we select regions in the sky, around the points of maximum and minimum acceleration, trying to get two sets of data of approximately the same number of points. Given that by separating in hemispheres produces that one of them has only a hundred data points, we decided to study regions containing at least 50 data as a minimum. Then, we increase the number of points to 100, 150 and 200. The regions consist of circular patches around the centers of maximum and minimum acceleration (found through the hemisphere comparison method by [27]). Given the anisotropic distribution of data, the regions have very different sizes. In what follow we present the analysis considering four regions: A with 50, B with 100, C with 150 and D with 200 data points.
A.
Region A
Let us discuss first the case having approximately 50 data points around each region. Towards the minimum acceleration region, we select 56 SNIa points with the redshift distribution shown in Fig. 4. Notice the lack of data for redshift larger than 0.655. The best fit values for our model gives, Ωm = 0.07 ± 0.61, w0 = 0.25 ± 0.59, and w1 = −6.7 ± 8.4. The reconstructed deceleration parameter with error propagation at one sigma is also shown in Fig. 4. Al-
FIG. 4: Redshift distribution for 56 SNIa around the minimum acceleration region, and the reconstructed deceleration parameter. The shaded region shows the 1σ error propagation.
though the best fit curve transit from an accelerated phase to a decelerated one around z ≃ 0.1, the reconstruction function does not shown any transition at one sigma. Actually, apparently there is no signal for the well known decceleration/acceleration transition occurring around z ≃ 0.6. Given that more than a half of the data (33 points) have redshifts z < 0.1, they certainly dominate the parameter estimation process, leading to this opposite transition (a q(z) changing from q < 0 for z > 0.1 to q > 0 for z < 0.1). Although this feature is statistically negligible in this particular case, the increment of the size of the region and with that, the number of data, the feature seems to persist as we will see, indicating a less negative q for z < 0.05 than for larger redshifts. In the direction around the maximum acceleration, we select 51 SNIa data points. The redshift distribution is shown in Fig. 5. Most of the data points are concentrated for z < 0.1, but this time there are 25 points around z ≃ 0.55 and two SNIa with redshifts higher than 1. The best fit values for our model gives, Ωm = 0.25 ± 0.57, w0 = −1.4 ± 1.4, and w1 = 1.8±4.2. The reconstructed deceleration parameter is also shown in Fig. 5. Here is clear that the best fit is consistent with a deceleration/acceleration transition around z ≃ 0.8, in agreement with ΛCDM. However, as is also the case around the minimum acceleration region, the trend disappear at 1σ. As a matter of conclusion, the use of nearly 50 data points per region, seems to be not enough to infer any clear trend. However, the best fit curve obtained in both cases, turns out to be in agreement with the behavior once more data is added.
5
FIG. 5: Redshift distribution for 51 SNIa around the maximum acceleration region, and the reconstructed deceleration parameter. The shaded region shows the 1σ error propagation.
B.
FIG. 6: Redshift distribution for 96 SNIa around the minimum acceleration region, and the reconstructed deceleration parameter. The shaded region shows the 1σ error propagation.
Region B
Lets try now regions containing nearly 100 data points each. This particular case is of interest also in comparison with the results from the analysis with hemispheres. In fact, here we have about 100 data points around the maximum acceleration, as was also the case in section III, but the difference here is that around the minimum region we are taking only 100 points instead of the more than 400 used in that case. Towards the minimum acceleration region, we select 96 SNIa points with the redshift distribution shown in Fig. 6. Notice the redshift distribution is now better than those with 50 data points (see Fig.4). Now the range between 0.1 < z < 0.7 has 57 points well distributed, although still there is a gap in the range 0.7 < z < 0.9. The best fit values for our model gives, Ωm = 0.66 ± 0.01, w0 = 3.9 ± 4.3, and w1 = −85 ± 77. The reconstructed deceleration parameter with error propagation at one sigma is also shown in Fig. 6. In this case the best fit curve shows a sharper transition at low redshift than the global one (see the reconstructed q(z) of Fig. (1) obtained with all data that peaked down to ≃ −0.5, meanwhile here the reconstructed peaked down to ≃ −2!!). As we mentioned before, the trend of q(z) increasing from z ≃ 0.1 to z = 0 that appears in the case using only 50 data points, here emerges strongly, even at 1σ. In the direction around the maximum acceleration, we select 101 SNIa data points. The redshift distribution is shown in Fig. 7. Most of the data points are still concentrated for z < 0.2, but this time there are 37 points around z ≃ 0.55. The best fit values for our model gives,
FIG. 7: Redshift distribution for 101 SNIa around the maximum acceleration region, and the reconstructed deceleration parameter. The shaded region shows the 1σ error propagation.
Ωm = 0.20 ± 0.72, w0 = −1.2 ± 1.2, and w1 = 1.4 ± 3.3. The reconstructed deceleration parameter is also shown in Fig. 7. Here is clear that the best fit is again consistent with a deceleration/acceleration transition around z ≃ 0.8, in agreement with ΛCDM. However, as is also the case using 51 data points, the trend disappear at 1σ (see Fig. 5). The use of nearly 100 data points per region is now enough to make a clear difference between the behavior
6 of the reconstructed q(z): towards the minimum acceleration region, the low redshift transition is clearly visible even at one sigma, but in the opposite direction the trend is completely different, being marginally consistent with ΛCDM. We have to stress here that a low redshift transition of q(z), a bump in the region 0 < z < 0.2, occurs in a region with a robust number of data points (see Fig. 6). C.
select 136 data points. The redshift distribution is shown in Fig. 9
Region C
In this region we select around 150 SNIa per region. In the one pointing to the minimum acceleration we get 152 data points, from which we obtain the best fit shown in Table II. The redshift distribution is shown in Fig.8. The reconstructed deceleration parameter is also shown
FIG. 9: Redshift distribution for 136 SNIa around the maximum acceleration region, and the reconstructed deceleration parameter. The shaded region shows the 1σ error propagation.
FIG. 8: Redshift distribution for 152 SNIa around the minimum acceleration region, and the reconstructed deceleration parameter. The shaded region shows the 1σ error propagation.
in that figure. χ2min /dof Region C 1) 124.03/133 2) 134.10/149 Region D 1) 190.72/194 2) 185.284/196
Ωm
ω0
As we notice looking at Fig. 8 and 9, using 150 data points we obtain essentially the same results as in the previous section (using around 100 points) and those obtained in section III using the hemispheres. However it is interesting to notice that, as we have mentioned before, from Fig. 8 it is clear that at 1σ the deceleration/acceleration transition occurring around z ≃ 0.5 is clearly visible in the reconstructed q(z), at the same level as is also visible the low-redshift transition (around z ≃ 0.2). In the opposite direction, from Fig. 9 at 1σ is not possible to talk about a deceleration/acceleration transition of q(z). It is interesting to investigate what happens once we add more data points per region. We select around 200 data points for region D. Our results show that the behavior found in that case persist once more data is added.
ω1
0.17 ± 1.24 −1.1 ± 1.7 1.2 ± 3.8 0.44 ± 0.13 −0.07 ± 0.96 −12 ± 14 0.40 ± 0.08 −0.64 ± 0.77 −7.9 ± 9.6 0.47 ± 0.11 −0.1 ± 1.1 −14 ± 16
TABLE II: Constraints on the cosmological parameters of CP L model for the two levels. Region C take approximately 150 SNIa points, and Region D approximately 200 SNIa points. The number 1) is for direction of maximum acceleration, 2) is for direction of minimum acceleration.
The same is done for the opposite direction, that pointing towards the maximum acceleration. In this case we
D.
Region D
In the region pointing towards the minimum acceleration we select 199 SNIa, and in the opposite direction (towards maximum acceleration) we select 197 SNIa. The redshift distribution and the reconstructed deceleration parameter in the first case are displayed in Fig. 10 meanwhile in the case around the maximum acceleration region are displayed in Fig. 11. The results show that adding these 61 data points (in the region around the maximum acceleration) is enough to change the best fit and obtain something similar to the global fit shown in Fig.1. This result should not be a
7 q(z) in the opposite direction. The analysis of the region with 200 data points converge – in both directions – to the global result presented in section II, that showing a low redshift transition for q(z). This is not surprising because the number of SNIa data points are more numerous around the minimum acceleration point.
V.
FIG. 10: Redshift distribution for 199 SNIa around the minimum acceleration region, and the reconstructed deceleration parameter. The shaded region shows the 1σ error propagation.
ANALYSIS USING THE LOSS SAMPLE
We have also performed the study of the consequences, in the reconstructed deceleration parameter, of the existence of an axis of maximal asymmetry using the Loss data set [41]. In order to find this axis, we follow the procedure of [27], using a flat ΛCDM as a base model, and start a scan of random axes looking for the maximum variation in the best fit of Ωm . Using the Loss sample we found that the direction of maximal acceleration points towards (l, b) = (309o, 31o ). In the hemisphere corresponding to the maximum acceleration, there are 216 supernovae and in the other the remaining 370. Again we observe the asymmetry in the distribution, although less severe than in the case of the Union 2 sample. In fact, using the Union 2 set we have verified the value (∆Ωm )max /Ωm = 0.43 ± 0.06 from [27]. Using the same procedure with the Loss sample we get (∆Ωm )max /Ωm = 0.30 ± 0.06. The best fit values in each hemisphere are displayed in Table III: χ2min /dof Ωm ω0 ω1 A 197.283/213 0.16 ± 1.08 −0.9 ± 0.9 0.2 ± 5.6 B 374.76/367 0.39 ± 0.07 −0.47 ± 0.43 −7.6 ± 6.2
TABLE III: Best fit values of the cosmological parameters using the LOSS sample separating the sky in two hemispheres. Row A for the 216 SNIa in the maximum acceleration hemisphere. Row B the 370 SNIa in the opposite direction. See also Fig.(12). FIG. 11: Redshift distribution for 197 SNIa around the minimum acceleration region, and the reconstructed deceleration parameter. The shaded region shows the 1σ error propagation.
surprise, because when adding more data points we are increasing the size of the region around the maximum acceleration point. Remember that using the hemispheres, the number of data points on the side of maximum acceleration was only 116. The result of the analysis for the regions with 100 and 150 data points are consistent with our previous result, showing a q(z) consistent with LCDM around the maximum acceleration point, and a low redshift transition for
In agreement with the previous analysis using the Union 2 data set, the result using the hemisphere towards the maximum acceleration is consistent with ΛCDM, showing no more than a 0.1σ departure from it (see Fig. 12). Our results are also in agreement with the previous case, the analysis with data from the hemisphere of minimum acceleration shows a sharp low redshift transition. In this case the best fit is around 1.5σ away from the ΛCDM value. It would be interesting to study this effect in the newest data set, as the JLA set [48] comprising more than 740 data points, and also using different parameterizations, as we have performed in [15]. These issues are under study.
8 Assuming the result of [16] as our main hypothesis – i.e., a low redshift transition of q(z) can be considered as a signal of a local under-density – our work indicates that the supernova data is able to detect such an underdensity only towards one direction in the sky. This result suggest that a better description of the data would be a background metric with a dipolar asymmetry.
FIG. 12: Reconstructed deceleration parameter q(z) using data from two hemispheres using the Loss sample. The panels show the one around the maximum (upper) and minimum (lower) acceleration points respectively. See Table III for the best fit values for each case.
VI.
DISCUSSION
In this paper we have study the effects in the reconstructed deceleration parameter using the well known dipolar asymmetry present in SNIa data. We have used the Union 2 set and the result of [27], a dipolar asymmetry with a maximum acceleration towards (l, b) = (309o , 18o ) and a minimum acceleration towards (l, b) = (129o , −18o) is found. The low reshift transition, previously recognized in [10–15], appears only towards the direction of minimum acceleration, and it is absent towards the opposite direction. This result was obtained separating the data in two hemispheres constructed along the maximal asymmetry axis. Using an approximately equal number of data points around each direction, we study four regions with 50, 100, 150 and 200 data. From this analysis we found hints of a low-redshift transition towards the minimum acceleration region that, apparently given the amount of data in that region, turns out to be dominant once all the sky is taken into account. Once this low redshift transition arise, in the opposite direction the reconstructed q(z) seems featureless showing no apparent evolution at 1σ, however being consistent with ΛCDM. We have also performed a similar analysis using the Loss dataset [41] finding the results displayed in Fig. 12, which are in agreement with those using the Union 2 dataset (see Fig. 3).
There remains to check if this asymmetry in the behavior of the reconstructed deceleration parameter is not due to the anisotropic distribution of data. This issue as been discussed in the past. As we have mentioned before, using the Union 2 dataset, the authors of [27] found a preferred axis in the data, but they also checked if such anisotropy can be obtained using simulated isotropic data. Their method suggest that only a 30% of the simulated data can reach such anisotropy, implying that the anisotropy of the Union 2 set is consistent with statistical isotropy. However, the coincidence of the axes (a total of six phenomenological axes identified in [27]) within a small angular region in the sky, makes this dipolar anisotropy a feature that needs further scrutiny. Using the Loss sample, the authors of [31] found a hint for anisotropy – most pronounced in the range 0.015 < z < 0.045 – but once they take into account large scale velocity perturbations, the results shows no evidence for any anomalous deviation from the isotropic ΛCDM. In [29] the authors studied this issue using the Union 2.1 and JLA set. Although they found that both datasets are statistically anisotropic, the correlation with the anisotropic distribution found turns out to be different: using the Union 2.1 they found a small correlation but using the JLA sample they found a stronger correlation. A similar study [37] using the JLA dataset also showed that by ignoring the velocity covariance may produce a hint of anisotropy from the data. In this context, it is interesting to notice here the result of the work [49] where the authors studied the JLA set, considering all the information from possible systematics (encoded in the covariance) in the analysis, finding a marginal (less than 3σ) evidence for the accepted cosmic acceleration. Altogether, the apparent detection of a local under density can be considered as a possible cause of the original tension between low and high redshift observational constraints discussed in [10–13, 15], which as a solution also agree with the analysis of [19] where they proposed the existence of a local under-density to alleviate the tension in the determination of H0 . Further study on this subject would be interesting. For example, the effects of using different parameterizations, and also the use of different SNIa data sets. Given that the SNIa data used in this work is obtained after the calibration of the whole set (by fitting globally also the α, β and M parameters, being the last one connected with the value of H0 ) it would be interesting to study the impact of the hemispherical asymmetry on such a calibration, and then on the cosmological parameters. All these issues are under study.
9 Acknowledgments
The authors want to thank Juan Maga˜ na for useful discussions. VHC acknowledges financial support through
[1] A. G. Riess et al., Astron. J. 116, 1009 (1998). [2] S. Perlmutter et al., Astrophys. J. 517, 565 (1999). [3] J. Frieman, M. Turner and D. Huterer, Ann. Rev. Astron. Astrophys. 46, 385 (2008). [4] J. Martin, Mod. Phys. Lett. A 23, 1252 (2008) [arXiv:0803.4076 [astro-ph]]. [5] S. Tsujikawa, Lect. Notes Phys. 800, 99 (2010) [arXiv:1101.0191 [gr-qc]]. [6] J.F. Pascual-Sanchez, Mod. Phys. Lett. A 14, 1539 (1999). [7] M.N. Celerier, Astron. Astrophys. 353, 63 (2000). [8] K. Bolejko, M.N. Celerier, & A. Krasinski, Classical and Quantum Gravity, 28, 164002 (2011). [9] V. Marra, & A. Notari, Classical and Quantum Gravity, 28, 164004 (2011). [10] Shafieloo A., Sahni V. and Starobinsky A.A., Phys. Rev. D 80, 101301, (2009). [11] Z. Li , P. Wu and H. Yu, Phys. Lett. B 695, 1 , (2011). [12] V.H. Cardenas and M. Rivera, Phys. Lett. B 710, 251 , (2011). [13] V.H. Cardenas , C. Bernal and A. Bonilla, MNRAS, 433, 3534, (2013). [14] V. H. Cardenas, Phys. Lett. B 750, 128 (2015) [arXiv:1405.5116 [astro-ph.CO]]. [15] J. Magana, V. H. Cardenas and V. Motta, JCAP 1410, no. 10, 017 (2014) doi:10.1088/1475-7516/2014/10/017 [arXiv:1407.1632 [astro-ph.CO]]. [16] R.A. Vanderveld , E.E. Flanagan and I. Wasserman, Phys. Rev. D 74, 023506 , (2006). [17] S. February , J. Larena , M. Smith and C. Clarkson, MNRAS, 405, 2231, (2010). [18] L. Verde, P. Protopapas and R. Jimenez, Phys. Dark Univ. 2, 166 (2013) [arXiv:1306.6766 [astro-ph.CO]]. [19] R. C. Keenan, A. J. Barger and L. L. Cowie, Astrophys. J. 775, 62 (2013) [arXiv:1304.2884 [astro-ph.CO]]. [20] R. Watkins, H. A. Feldman and M. J. Hudson, Mon. Not. Roy. Astron. Soc. 392, 743 (2009) [arXiv:0809.4041 [astro-ph]]. [21] A. Kashlinsky, F. Atrio-Barandela, D. Kocevski and H. Ebeling, Astrophys. J. 686, L49 (2009) [arXiv:0809.3734 [astro-ph]]. [22] A. Kashlinsky, F. Atrio-Barandela, D. Kocevski and H. Ebeling, Astrophys. J. 691, 1479 (2009) [arXiv:0809.3733 [astro-ph]]. [23] F. Atrio-Barandela, A. Kashlinsky, H. Ebeling, D. J. Fixsen and D. Kocevski, Astrophys. J. 810, 143 (2015) [24] U. Feindt et al., Astron. Astrophys. 560, A90 (2013) [arXiv:1310.4184 [astro-ph.CO]]. [25] Y. Akrami, Y. Fantaye, A. Shafieloo, H. K. Eriksen, F. K. Hansen, A. J. Banday and K. M. Grski, Astrophys. J. 784, L42 (2014) [arXiv:1402.0870 [astro-ph.CO]]. [26] D. Hutsem´ekers, L. Braibant, V. Pelgrims, & D. Sluse,
DIUV project No. 13/2009, and FONDECYT 1110230. C.B. and V.M. acknowledges financial support through FONDECYT 1120741. V.M. acknowledges the support from Centro de Astrof´ısica de Valpara´ıso.
Astron. Astrophys. 572, A18 (2014) [27] I. Antoniou and L. Perivolaropoulos., JCAP 12, 012A (2010), arXiv:1007.4347v3 [astro-ph.CO]. [28] R. Cai and Z. Tuo, JCAP 1202, 004 (2012). [29] C. A. P. Bengaly, A. Bernui and J. S. Alcaniz, Astrophys. J. 808, 39 (2015) [arXiv:1503.01413 [astro-ph.CO]]. [30] S. Appleby and A. Shafieloo, JCAP 1410, no. 10, 070 (2014) [arXiv:1405.4595 [astro-ph.CO]]. [31] S. Appleby, A. Shafieloo and A. Johnson, Astrophys. J. 801, no. 2, 76 (2015) [arXiv:1410.5562 [astro-ph.CO]]. [32] D. C. Dai, W. H. Kinney and D. Stojkovic, JCAP 1104, 015 (2011) [arXiv:1102.0800 [astro-ph.CO]]. [33] J. Colin, R. Mohayaee, S. Sarkar and A. Shafieloo, Mon. Not. Roy. Astron. Soc. 414, 264 (2011) [arXiv:1011.6292 [astro-ph.CO]]. [34] G. J. Mathews, B. Rose, P. Garnavich, D. Yamazaki and T. Kajino, arXiv:1412.1529 [astro-ph.CO]. [35] J. Beltran Jimenez, V. Salzano and R. Lazkoz, Phys. Lett. B 741, 168 (2015) [arXiv:1402.1760 [astro-ph.CO]]. [36] B. Javanmardi, C. Porciani, P. Kroupa, & J. PflammAltenburg, Astrophys. J. 810, 47 (2015). [37] D. Huterer, D. L. Shafer and F. Schmidt, arXiv:1509.04708 [astro-ph.CO]. [38] M. Hicken et al., Astrophys. J. 700, 1097 (2009) [arXiv:0901.4804 [astro-ph.CO]]. [39] R. Amanullah et al., ApJ, 716, 712, (2010). [40] N. Suzuki, D. Rubin, C. Lidman, G. Aldering, R. Amanullah, K. Barbary, L. F. Barrientos and J. Botyanszki et al., Astrophys. J. 746, 85 (2012) [arXiv:1105.3470 [astroph.CO]]. [41] M. Ganeshalingam, W. Li, and A.V. Filippenko, MNRAS, 433, 2240 (2013). [42] M. Kowalski et al. [Supernova Cosmology Project Collaboration], Astrophys. J. 686, 749 (2008) [arXiv:0804.4142 [astro-ph]]. [43] M. Hicken, , W. M. Wood-Vasey, S. Blondin, P. Challis, S. Jha, P. L. Kelly, A. Rest and R. P. Kirshner Astrophys. J. 700, 1097H, (2009) [arXiv:0901.4804 [astro-ph.CO]] [44] J. A., Holtzman et al. 2008AJ....136.2306H [arXiv:0908.4277 [astro-ph.CO]] [45] Linder E. V., Phys. Rev. Lett. 90, 091301, (2003) [astro-ph/0311403]. [46] M. Chevallier and D. Polarski, Int. J. Mod. Phys. D 10, 213 (2001) doi:10.1142/S0218271801000822 [gr-qc/0009008]. [47] L. Perivolaropoulos, J. Phys. Conf. Ser., 222, 012024 (2010). [48] M. Betoule et al. [SDSS Collaboration], Astron. Astrophys. 568, A22 (2014) doi:10.1051/0004-6361/201423413 [arXiv:1401.4064 [astro-ph.CO]]. [49] J. T. Nielsen, A. Guffanti and S. Sarkar, arXiv:1506.01354 [astro-ph.CO].