Asynchronous Collaborative Visualization on a Stick Francis T. Marchese Pace University
ABSTRACT This paper reports some initial results from the construction of an extensible visualization-oriented personal information manager that functions as well as an asynchronous collaborative visualization system. To our knowledge, this is not only the first software of its kind, but it is an easily assembled and may be extended out of readily available open-source components. KEYWORDS: visualization, collaborative computing, collaborative visualization, computer supported collaborative work. INDEX TERMS: H.2 [Database Management]: Data and Knowledge Visualization, Workflow Management; H.3 [Information Storage and Retrieval]: Data Sharing; H.5 [Information Interfaces and Representation (HCI)]: ComputerSupported Cooperative Work. 1
INTRODUCTION
Asynchrony is essential to group process. Asynchronous collaboration takes place at different times because collaborators neither require interactive coordination nor real-time notification of updates to shared artifacts. Indeed, work independence may be the most important attribute of asynchronous practice [1] where collaborators work independently on shared artifacts, thus minimizing communication. Typically, collaborative visualization is synchronous, where multiple users meet at a specified time to work together within a WYSIWIS (What You See Is What I See) environment. Because synchronous collaboration is such a powerful idiom for supporting work over a distance, most research has focused on building and characterizing synchronous collaborative visualization systems [2]. Since there has been limited focus on this line of research, we see an opportunity for important contributions to be made in the design and construction of such systems. We are aware of only three systems that have been built specifically to support asynchronous collaborative visualization - DecisionSite Posters [3], a web-based client that resides within an information visualization package; sense.us, a prototype web application for social visual data analysis [4]; and molecular wiki [5], an asynchronous collaborative visualization system for chemical applications that was created by integrating two technologies - an interactive three dimensional visualization program and a wiki. The research reported here is an extension of the efforts of Marchese and Brajkovska [5]. Specifically, it addresses how a visualization system may be designed to support both worker independence as well as collaboration. We do this by building a system that integrates a wiki with readily available open-source components that support visualization. The difference between this research and our previous work is that we employ a serverless wiki. The result is a portable system that may be installed and run 1 Pace Plaza, New York, NY 10038.
[email protected]
from a USB drive or uploaded to the web for supporting collaborative visualization. 2
REQUIREMENTS
Asynchronous collaboration systems that maintain work independence should exhibit the following general characteristics [5]: 1. Isolation of work practices. 2. Support for replication of data. 3. Automatic resolution of conflicts. 4. Version control. 5. Interactive real-time visualization. 6. Playback by means of replay by re-execution. 7. Support for disconnected use. 8. Information foraging. 9. Annotation. Construction of such a system may be simplified by noting that these requirements may be fulfilled employing off-the-shelf components. The first four requirements are met by utilizing a wiki system; requirements five through seven are met by domain specific visualization software; and the remaining two requirements may be met by either system. Wiki software is a perfect substrate for building an asynchronous collaborative visualization system because it is designed for collaboration and extensibility [6]. Whether through plug-ins or scripting, wikis may be adapted to include a wide variety of media such as interactive visualization programs. From a design perspective, the insertion of graphical applications into a wiki to create an asynchronous collaborative visualization system means that the need for specialized software designed to support collaborative visualization is unnecessary because the wiki becomes the foundation for sharing. It means as well that any visualization system that can be linked into the wiki, including specialized hardware such as 3D stereographic displays and videowalls, become integrated into the asynchronous collaboratory. 3
DESIGN
Molecular visualization software was selected as the domain specific application. Molecular visualization environments typically integrate data generation, visualization, and analysis [7], rendering a vast array of graphical representations not found in mainstream visualization systems. A number of molecular visualization systems support annotation, scripting, session recording, and playback. Two were selected for embedding in the wiki: Kinemage (Kinetic Image) [8] and Jmol [9]. These systems accept ASCII input files that contain source data, annotated display lists for visualization scenarios, and accompanying descriptive comments that can be shared, edited, appended to, and evolve over time. Both systems are available as Java applets, hence facilitating integration into the wiki. In addition, Jmol supports LiveConnect [10], the API that furnishes JavaScript with the ability to call methods of Java classes using the existing Java infrastructure. Jmol uses the API to allow invoking its funtionality from buttons embedded within wiki narrative text.
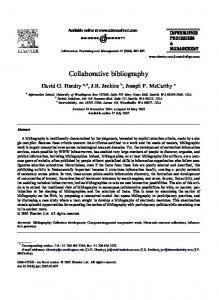
Figure 1. Snapshot of asynchronous collaborative visualization system showing wiki substrate (center) and two linked visualization applets (Kinemage (left) and Jmol (right).
Wiki selection was governed by the requirement that the system should function both as a personal information manager and a collaborative tool. For simplicity of installation the non-server based wiki called TiddlyWiki was selected [11]. TiddlyWiki is a complete wiki written in JavaScript, contained within a single HTML file that includes all content, functionality (including editing, saving, tagging and searching) and style sheets. This single file format makes TiddlyWiki highly portable – it can be emailed, loaded on a web server, or shared via a USB stick. There are a number of ways of inserting a Java applet into a wiki. Creating a plugin is one possibility. Another is to allow the wiki to execute HTML code including JavaScript. Although this latter method is suggested for intranet installations only, it was used for our experiment. 4
DISCUSSION
Figure 1 displays a snapshot of the system viewed on a three monitor display. Two instances of Jmol are running (right and center screen) and one instance of Kinemage (left). This molecular visualization software and others may be installed either as embedded applets within the wiki or as a pop-ups by employing a combination of HTML and JavaScript. Here, Kinemage loads directly when its journal is selected. The instance of Jmol is configured so as to load initially as an embedded applet. A JavaScript button is used to allow for running as a popup. A typical scenario for asynchronous collaboration using this system may begin with a scientist creating wiki entries that contain molecules, descriptive text, HTML and Javascript code that are inserted into a wiki page by means of a copy and paste mechanism. The entire wiki file is then uploaded to the scientist’s website. With the document in place, both visualization programs may be used to directly interact with the data. For Jmol, a rightclick of the mouse opens a pop-up menu, providing access to all its features. Alternatively, the scientist can read the descriptive text and click on the embedded buttons to load Jmol scripts that focus attention on the data components that the narrative addresses. For Kinemage, the scientist can interact with different visualization scenarios and update the attached narrative. A second scientist exploring the new wiki page may right-click on Jmol to open a console for on-the-fly input of script commands. The console shows the command history as well. This can be copied-and-pasted between the history and script input fields. The scientist may work with different combinations of script commands and add new commentary to the wiki.
5
CONCLUSION
This asynchronous collaborative visualization system has been constructed by assembling disparate components. It works in principle; thus meeting the original design requirements. The system’s usability remains an open issue. Work is underway to optimize usability, in particular providing templates and plug-ins to better integrate each component and in general make the system easier to use. REFERENCES [1]
W.K. Edwards, E.D. Mynatt, K. Petersen, M.J. Spreitzer, D.B Terry, and M.M. Theimer, “Designing and implementing asynchronous collaborative applications with Bayou,” In Proceedings of the 10th Annual ACM Symposium on User interface Software and Technology (Banff, Alberta, Canada, October 14 - 17, 1997). UIST '97. ACM Press, New York, NY, pp. 119-128. [2] I.J. Grimstead, D.W. Walker, and N.J. Avis, "Collaborative visualization: a review and taxonomy," In Ninth IEEE International Symposium on Distributed Simulation and Real-Time Applications, (Oct. 2005), pp. 61-69. [3] DecisionSite Posters, http://spotfire.tibco.com/Products/ DecisionSite-Posters.aspx, accessed June. 28, 2009. [4] J. Heer, F.B. Viégas, and M. Wattenberg, "Voyagers and voyeurs: supporting asynchronous collaborative information visualization," In Proceedings of CHI 2007, ACM Conference on Human Factors in Computing Systems, 2007. [5] F.T. Marchese and N. Brajkovska. “Fostering asynchronous collaborative visualization,” In Proceedings of the 11th International Conference on Information Visualization: IV'07 (July 04 - 06, 2007). IEEE Computer Society, Washington, DC, pp. 185-190. [6] B. Leuf and W. Cunningham, The Wiki Way: Quick Collaboration on the Web, Addison-Wesley Longman Publishing Co., Inc. 2001. [7] F.T. Marchese. “Molecular visualization at the interface,” In Trends in Interactive Visualisation / Advanced Information and Knowledge Processing Series edited by E. Zudilova-Seinstra, T. Adriaasen, and R.van Liere, Springer-Verlag, London, 2009, pp. 251-268. [8] D.C. Richardson and J.S. Richardson, “The kinemage: a tool for scientific communication,” Protein Science 1 (Jan. 1992), pp. 3-9. [9] A. Herráez, "Biomolecules in the computer: Jmol to the rescue," Biochemistry and Molecular Biology Education 34, 4, 2006, pp. 255261. [10] LiveConnect, http://devedge-temp.mozilla.org/library/manuals/ 2000/ javascript/1.3/guide/lc.html, accessed June 28, 2009. [11] TiddlyWiki, http://www.tiddlywiki.com/, accessed June, 28, 2009.