ment of a number of visualization software systems, and in particular a range of ..... none of the software needs tailoring for collaborative use, relying on the ability of each ..... ported through a custom 3D widget library. Viewing envi- ronments ...
Volume 0 (1981), Number 0 pp. 1–29
Distributed and Collaborative Visualization K.W. Brodlie† , D.A. Duce‡ , J.R. Gallop§ , J.P.R.B. Walton¶ and J.D. Wood† † School
of Computing, University of Leeds, Leeds LS2 9JT, UK of Computing, Oxford Brookes University, Oxford OX33 1HX, UK § BITD, Rutherford Appleton Laboratory, Chilton, Didcot OX11 0QX, UK ¶ The Numerical Algorithms Group Ltd, Wilkinson House, Jordan Hill Road, Oxford OX2 8DR, UK ‡ Department
Abstract Visualization is a powerful tool for analysing data and presenting results in science, engineering and medicine. This paper reviews ways in which it can be used in distributed and/or collaborative enviroments. Distributed visualization addresses a number of resource allocation problems, including the location of processing close to data for the minimization of data traffic. The advent of the Grid Computing paradigm and the link to Web Services provides fresh challenges and opportunities for distributed visualization—including the close coupling of simulations and visualizations in a steering environment. Recent developments in collaboration have seen the growth of specialized facilities (such as Access Grid) which have supplemented traditional desktop video conferencing using the Internet and multicast communications. Collaboration allows multiple users—possibly at remote sites—to take part in the visualization process at levels which range from the viewing of images to the shared control of the visualization methods. In this review, we present a model framework for distributed and collaborative visualization and assess a selection of visualization systems and frameworks for their use in a distributed or collaborative environment. We also discuss some examples of enabling technology and review recent work from research projects in this field. Categories and Subject Descriptors (according to ACM CCS): H.5.3 [Group and Organization Interfaces]: Collaborative computing I.3.2 [Computer Graphics]: Distributed/network graphics I.3.8 [Computer Graphics]: Applications
1. Introduction 1.1. Motivation
the data. Both distributed and collaborative visualization are underpinned by the recent advances in high bandwidth communications.
Visualization is a powerful tool for analysing data and presenting results, across a wide range of disciplines. Computers are used to create visual images from the data; the human mind is used to make inferences from this imagery, in order to better understand the data. Increasingly the visualization process involves a number of machines and a number of people. Distributed visualization allocates different parts of the machine processing to different computers, in order to improve performance. Grid computing offers new opportunities for this way of working. Collaborative visualization allocates different parts of the human processing to different people, perhaps geographically separated. This reflects the fact that major scientific research is team-based, and allows a range of human expertise to be brought to the analysis of
During the 1980s computer networking became widespread in many organizations, and led to the establishment of the discipline of Computer Supported Cooperative Working (CSCW) which gathers together researchers interested in how people work together, and how computers and related technologies affect the behaviour of groups of people. CSCW systems typically provide audio and video communication channels between participants in a cooperative session with the addition of groupware tools such as shared text editors, shared whiteboard, shared drawing tools, etc. [GHR95]. Given the significance of visualization as a medium of communication in a wide range of contexts, the question naturally arises—how is visualization
c The Eurographics Association and Blackwell Publishing 2004. Published by Blackwell � Publishing, 9600 Garsington Road, Oxford OX4 2DQ, UK and 350 Main Street, Malden, MA 02148, USA.
K.W. Brodlie et al. / Distributed and Collaborative Visualization
used within group working and how can this be supported in the CSCW system? The use of visualization in collaborative working might involve a group of people sitting around a meeting table discussing hardcopy output, or viewing a video. It might involve a group of people clustered around a workstation, with one person in the ‘driving seat’, discussing a visualization, perhaps making suggestions as to how the visualization could be changed in order to draw out other features in the data, for example by changing a colour map or using a different technique to present the data. Participants might take it in turns to ‘drive’ the visualization system, each working with their own particular data sets. It might involve a group of people geographically distributed within a specialist video-conferencing facility such as the Access Grid (see Section 5.2.3). Visualization itself has been a cornerstone of computing from its earliest days, but gained increased recognition following the landmark NSF Report of McCormick, de Fanti and Brown [MDB87] in 1987. This led to the development of a number of visualization software systems, and in particular a range of Modular Visualization Environments (MVEs). Early examples were apE [Dye90] and the first version of AVS [UFK∗ 89]. MVEs provide a set of building blocks which perform functions such as reading data, generation of visualizations such as contouring, and rendering. MVEs typically provide a visual editor with which to construct applications, by linking together a set of building blocks. It is perhaps the power of this visualization programming metaphor that has made MVEs so popular. The modular building blocks may be (but are not necessarily) implemented as separate processes. When this is done, this provides a natural way in which such systems may become distributed systems. Examples of systems of this kind include AVS [Lor95], Khoros [YAW95], IBM Data Explorer [AT95] (now OpenDX [Opeb]), and IRIS Explorer [Fou95, Walss]. In the early 1990s the advent of the World Wide Web led to another architecture, a client-server approach in which the visualization is defined through the client and presented in the client. The client-server interaction could take several different forms depending on how much of the computation of the visualization was done by the client and how much by the server. Such approaches are termed web-based visualization. Grid computing is currently attracting much attention and funding. The essence of Grid computing is “the large scale integration of computer systems (via high speed networks) to provide on-demand access to data-crunching capabilities and functions not available to an individual or group of machines” [Fos03]. Shalf and Bethel [SB03] write “the promise of Grid computing, paricularly Grid-enabled visualization, is a transparent, interconnected fabric to link data sources, computing (visualization) resources, and users into widely distributed virtual organizations”. The challenges they identify are familiar. How to support distributed heterogeneous
components, dynamic partitioning of visualization components between resources, and algorithms that maintain interactive performance in the presence of latency? As they point out, visualization system users want to use the best tool for the job, regardless of source. The Grid infrastructure is evolving to a service-based architecture in which functional capabilities of services are represented by interfaces which can be discovered along with semantic descriptions. In this paper we review the state of the art in distributed and collaborative visualization. The aim of which is to harness the processing power of many humans and many machines. Distinctions are drawn between: 1. Distributed visualization. This involves collaboration at the system level. Visualization systems following the Modular Visualization Environments (MVE) approach, for example, are generally designed so that it is possible to place modules on different computers. Of course this is most useful when it is a computationally intense visualization task, when some modules may usefully be located on a supercomputer, others locally on a workstation. One can also see simple web-based visualization in this class. Although several computers may be involved in the computation, such a distributed visualization system is still a single-user system. Working in a distributed environment does not by itself imply working in cooperation with other users. It is useful to distinguish parallel and distributed visualization. Parallel visualization involves the use of parallel processing resources to execute a visualization algorithm. The term parallel processing is normally used to describe the situation in which more than one processor among a group of processors is active at any one instant in executing the algorithm. The boundary between distributed and parallel processing can be fuzzy, but we view the difference in terms of the granularity of the task being performed and the inherent notion that more than one processor is necessarily active at any one time in parallel execution. 2. Collaborative visualization. Several people may work together to interpret a visualization. This is collaboration at the human level. It is interesting that the current MVEs did not have this as a design requirement, and until recently were all single-user systems. Similarly web-based visualization systems have been single-user. Cooperation is achieved by humans clustering around a single workstation, around a Responsive Workbench device or in a CAVE, for discussion, or through some means outside the visualization system (for example, sending visualization output to a collaborator for comment). 3. Distributed collaborative visualization. This brings the two concepts together, allowing collaboration at both the system and human level. A distributed collaborative visualization toolset should allow its geographically distributed users, not only to run remote resources, but to share images, interact and cooperate, across a network, in the intermediate steps which lead to the creation of the c The Eurographics Association and Blackwell Publishing 2004. �
K.W. Brodlie et al. / Distributed and Collaborative Visualization
final output. Collaborative visualization in which the participants are situated in a distributed virtual environment would also fall into this category, though detailed discussion of this approach is beyond the scope of this paper; the reader is referred to a recent review of this area by van Dam et al. [vDLS02].
time
different
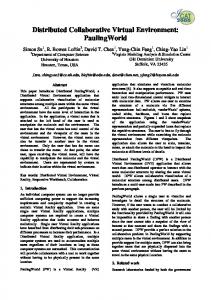
The organization of the paper is discussed in the next section. 1.2. Organization The paper is structured as follows. Section 2 explores models and conceptual frameworks for the field. First a model for Computer Supported Collaborative Working (CSCW) is described which addresses the human viewpoint. A 3-layer model is then described which addresses the system viewpoint. The layers express different kinds of commitment to resources, both human and system. Section 3 extends the discussion of two of the layers in the 3-layer model. Section 4 describes a range of factors that might be used to distinguish one visualization system from another. Section 5 looks briefly at different kinds of data sources and presentation environments for visualization. This paper does not attempt a thorough review of these areas, but offers some pointers to more detailed studies and to some current directions in these areas. Section 6 describes specific visualization systems which support distribution and collaboration. The selection is not exhaustive, but has been made with the intention of illustrating common architectures and approaches. A few systems on the fringes of current practice have been included where these illustrate particular ideas that have proved to be, or may prove to be, influential on the field. This section also includes discussion of work in progress in a number of current research projects, again chosen to illustrate current research directions in this field. Section 7 draws conclusions and reflects on future directions. 2. A Structure for the Field CSCW involves both people and machines. In the CSCW literature, Applegate’s place-time matrix is a widely cited classification scheme for cooperative working [App91]. This scheme, shown in Figure 1, focuses on the people involved in CSCW and the way in which the types of involvement may be classified. Two dimensions are used: time and place. Members of a CSCW group may be located at the same place or a different place, and be present in a CSCW session at the same time or at different times. There is thus the notion that a session may c The Eurographics Association and Blackwell Publishing 2004. �
same same
different
place
Figure 1: Applegate’s place-time matrix.
extend in time, and not all participants need be present at the same time. The same time, same place box corresponds to all members of the group being present in the same place at the same time. Systems to support such forms of working include conference rooms equipped with individual workstations to support decision-making processes. In visualization a group of users clustered around a single workstation, around a Responsive Workbench or in a CAVE, would fall into this box. Collaboration that involves exchange of letters, faxes, or emails, between members of a group, falls into the different time, different place box. This is also referred to as asynchronous collaboration. There is a notion of a group session. This captures the idea of a group of people working on a common problem over an extended period of time. There is a shared history of working contained in the trace of letters, faxes, emails, etc. exchanged between group members. The web typically falls into this box, though developments such as cooperative web browsing [JGKR96, Lia97, PMSS97, SW97] are extending the web to other forms of working. Video conferencing falls into the different place, same time box. This is also known as synchronous collaboration. Members of the group are co-present in time, but at different physical locations. Video conferencing may involve a specially equipped video conferencing suite (such as an Access Grid), with multiple cameras etc. at one extreme, or may be based on a suitably equipped workstation per participant. The latter approach can be characterized as collaboration as an extension of the normal working environment. This notion is taken further in the work of Fuch’s group at UNC Chapel Hill [Fuc97], which is investigating the use of cameras and sophisticated display technology to assign a region of each office to collaboration, so that one’s collaborators are brought into the office in an even more direct way than through workstation-based video conferencing. However, collaborative working is not just video conferencing. There is a need to share information other than through audio and video channels, and a need to share applications used in the creation, analysis and presentation of informa-
K.W. Brodlie et al. / Distributed and Collaborative Visualization
tion. “Groupware” falls into this category. Much work in distributed cooperative visualization aims to support this type of collaboration. In any one group activity, it is likely that several different types of collaborative working will be used, for example, formal face-to-face meetings, coupled with different time, different place styles of working between meetings, coupled with informal same time, different place sessions. This raises issues about seamless transitions between different types of working, and the organization of group memory so that it is equally accessible from different types of meeting. Researchers at Xerox PARC, for example, have worked extensively in this area [BHI93]. We also need to consider roles that participants take. In a lecture situation the lecturer and audience members have different roles and consequently may be expected to perform some tasks specific to the role as well as tasks that may be common across different roles. We can link these ideas about the participants’ view to a system view of distributed and collaborative visualization through a three layer model. This also provides links to more detailed models of visualization. The three layers are: • the conceptual layer which describes the visualization to be performed, independently of the visualization software with which it is to be realized; • the logical layer in which the visualization is expressed as a particular configuration of software entities, but independently of the physical resources with which the configuration will be realized; • the physical layer in which software entities are associated with physical resources. The conceptual layer abstracts away the details of visualization software and physical resources. It captures the intent of the designers of the visualization. A description in the conceptual layer will capture the participants’ perspective of the visualization, the role(s) and tasks that the participants are to perform, the nature of the data sources, the visualization itself and the control and viewing environment. Roles might include participant and leader roles. Typical data sources would be data repositories or simulations enabled for computational steering. A visualization might be to display an isosurface of a particular field in a data set from one source and an isosurface of a field from a second source, overlaid with coastline outlines. The control and viewing environment might be a remote teaching environment in which the lecturer alone can control the data sources and visualization parameters, and students can view the results without control of the view. The conceptual layer thus captures the visualization design independent of a realization. The process by which a conceptual visualization design is created might itself involve collaboration. The logical layer introduces the software entities in which the conceptual description is to be realized. It is convenient
to see this in two parts, the logical visualization design and the core software. In the traditional library context, the logical visualization design is the user program and the core software is the library of subprograms. In an MVE context the logical visualization design is a description of the composition of modules into a network and the core software is the set of modules provided by the MVE. The logical layer thus involves a binding of the conceptual visualization design to a particular software architecture. Examples of bindings to particular software architectures are described later in this paper (see Section 3.2). The relationship between the conceptual layer and the logical layer also involves refinement of the human user interface and a binding of these in the chosen software architecture and core software. The logical layer also includes constraints on the resources required by the logical visualization design. A computation might, for example, require a processor with particular characteristics. Constraints on the resources required to realize the chosen human user interface may also be included. The physical layer is a binding of the logical visualization design and core software to particular physical resources. For example, a visualization realized using a parallel visualization library might be bound to a particular parallel processing machine; a visualization realized using an MVE might include modules bound to processing resources remote from the main controlling executive. Interface devices are also included in the binding, for example, a particular graphical workbench or devices linked to an Access Grid. The binding also includes binding of links between entities to particular communication patterns, for example, shared memory, web service and Grid FTP. This model thus treats the realization of a visualization as a refinement process in which the abstract conceptual design is refined into a logical design using particular choices of core software and then into a physical design in which physical resources are associated with the core software and other software entities. The layer model is complementary to the classical reference model of Haber and McNabb [HM90]. They describe visualization in terms of the sequential composition of three types of processes, originally termed data enrichment, visualization mapping and rendering, but now (using terminology due to Upson et al. [UFK∗ 89]) often referred to as Filter, Map and Render. Wood, Wright and Brodlie [WWB97] have extended this model to encompass collaboration by introducing, potentially anywhere in the pipeline, intermediate import and export points for data and control information. This is described in detail in Section 3.2.2. These reference models can be used to express the visualization in each layer as a composition of Filter, Map and Render stages. Figure 2 illustrates the twin concepts of logical and physc The Eurographics Association and Blackwell Publishing 2004. �
K.W. Brodlie et al. / Distributed and Collaborative Visualization
tions through the RFB. This person is shown top right in the figure. The figure also shows the binding of the logical description to physical resources—as well as the binding of the interface, we have a binding of the data to a file descriptor (either local or remote); a binding of software components to a file descriptor (again local or remote); and finally a binding of the execution of the components to a machine descriptor. (At present we do not distinguish the display of the visualization from the interface; this would also be possible.) The concepts introduced in this section allow us to describe within a single framework many different approaches to visualization. We expand on these in the next section.
3. Logical and Physical Layers
Figure 2: Example of the logical and physical layers in the model.
The 3-layer model introduced in Section 2 distinguishes between the overall description or intent of the visualization application (conceptual layer), the software entities (logical layer) and allocation of physical resources (physical resources). The logical and physical layers are described here in more detail.
3.1. A possible collaboration ical layer environments for a common conceptual scenario. The logical layer has been reduced to a description in which there are two visualization sessions in progress, each associated with an individual researcher. The sessions are shown as dataflow networks expressed in the Wood, Wright and Brodlie reference model, but the concept does not only apply to MVE-type systems—the sessions might be user programs making library calls, or Remote Method Invocation (RMI) calls; or they might be command-driven packages. Collaboration is shown in the logical description as a shared area into which data may be placed by one session, and retrieved by another. This covers both synchronous and asynchronous collaboration—in synchronous collaboration we would see the shared area as transient, and in the asynchronous case, as persistent. The physical layer describes the real-world realization of the logical layer. Here we see that the two logical sessions have been constructed by researchers, through an interface. (These are the people on the left of the figure.) Indeed this is a continual process which exists throughout a session, whereby controls are operated, commands are given and views are displayed. One researcher can place material in the shared area for the other to retrieve. An alternative, rather simple, form of collaboration is also shown in the figure. This is the desktop sharing concept, sometimes known as Remote Frame Buffer (RFB), whereby the interface of one researcher is distributed to another researcher (see Section 6.2.1). If permission is given, the other researcher can input command and control operac The Eurographics Association and Blackwell Publishing 2004. �
We begin by describing a possible collaboration, outlining the roles of the participants and what they do. The scope of the collaboration develops with time. A user begins by using a visualization package to analyse some data on their desktop system. The user then decides to make use of a large dataset held in a remote managed archive. The archive hosts a simple visualization package which is accessed via a web page, so the user visualizes the data remotely, receiving images back to the web browser. This helps decide which subset of the data is of most interest. The user now needs a visual comparison between the local data and the remote archive, so downloads a data subset and plots both it and the local data on the same picture. More data is needed from the remote archive, but a new download each time is cumbersome to use. It so happens that the visualization package has a file import mechanism, which allows the user to specify a web URL and the subset to be extracted. Reliance can be placed on the local web client to cache the remote data for repeated use. The visual comparisons show up some discrepancies and help is needed from a colleague on another continent, who has the necessary further skills. So we have user U1 who uses visualization package V1 to analyse local data D1 and remote data DR . The resulting image is sent to the new colleague U2 . To try and understand the problem further, U2 examines the data with a visualization package V2 with which they are
K.W. Brodlie et al. / Distributed and Collaborative Visualization
more familiar. U1 makes D1 available via the web and tells U2 how to access it and DR . They then agree that user U2 starts using package V1 . This is sufficiently flexible that U1 is able to provide a partially computed result from V1 and supplies it to U2 , who sets up V1 to read, compute and display it. Ideally, since U2 is not so familiar with V1 , U1 assists by passing across the necessary scripts to implement that part of the visualization design. U2 manipulates a control parameter (for instance, an isosurface threshold) and has an idea about what the original discrepancy might be due to. U1 agrees to take the opportunity of controlling the threshold parameter from U2 and manipulates it too. U2 offers access to further data D2 . They then agree that they should share the insight they have gained and arrange to call U3 and U4 . They plan to show these other colleagues how they reach their conclusion by showing what they did step by step. U3 and U4 are just two people who have the same observer role in the collaboration, a situation which is quite likely when the number of participants grows large. Naturally U1 and U2 also use tools to handle audio and video information between themselves and later on with U3 and U4 also. 3.2. Logical layer The example collaboration just described shows that the participants had a number of choices available to them and their use of collaborative software was able to take different forms, depending on the users’ requirements at different times. The logical layer is a suitable place to set out common software architectures. Some aspects of the example collaboration can be thought of as following a service model; other aspects require a more general approach which we pick up in the section on generalised MVE architectures (see Section 3.2.2). The term service is used here in the sense in which it is used in Web Services and the service-oriented computing paradigm. 3.2.1. Service model for distributed and collaborative visualization Motivation. The World Wide Web grew from its initial focus to have a much wider impact as a distributed computing environment. The earliest applications of web technology in visualization were not service based, but were simply for descriptive visualization–in Bergeron’s categorization [Ber93]–where a prepared visualization of scientific data was placed as an image, or perhaps a VRML/X3D model within a web page. It is still often used in this way of course, providing a very useful means of publishing results. Most visualization systems now allow VRML as an output option—see Walton [WK97] for example. However it was realized that it is also possible to carry
out analytical or exploratory visualization, where the investigative process itself is carried out on the web environment. Use of web technology allows distributed visualization for a single user, but it also provides a means of asynchronous collaborative working, where the participants use the system in turn. Furthermore with no additional software other than web tools, participants can simultaneously access a web page containing original data or partial results. Web-based visualization projects are discussed in detail in Section 6.4. One of the trends in current developments is concerned with identifying appropriate components for distributed and collaborative visualization using Web Services or grid services, based on OGSA (the Open Grid Services Architecture) and we describe some of this work in Sections 6.3.3 and 6.3.5. To analyse the service model, we need to determine which components are provided by the service and which are with the client. When collaboration is involved, we need to identify which components are shared. Shared. In a collaborative application, some components exist just once and perform their tasks on behalf of all participants. The resulting data is distributed to all participants. Individual. Other components are under the control of each participant which allows individuals to inspect results in the way most suited to their experience and environment. In the client/server model, the shared components can be associated with the server and there are multiple clients, in principle one for each participant. In practice the shared components can be initiated by one of the participants. A visualization service provider is faced with a range of possible ways in which to offer a service and we can distinguish a number of general cases which we explore in the next sections. Client-based visualization. We distinguish client-based from server-based systems by determining where the visualization execution takes place. Here we consider the case where the visualization is executed on the client. A key issue is the location of the data that are to be visualized. Provision of data can be viewed as a service, which is how we illustrate it here. There are different approaches to client-based visualization, depending on how much software is assumed to be already installed on the client machine, and how much is transferred over the network on demand. (i) Visualization design and core software both present on the client. In this first approach, the distribution involves only the data, which is located remotely at a URL. The visualization software is held locally, and executes locally— and so this is a client-based approach. Typically the data is c The Eurographics Association and Blackwell Publishing 2004. �
K.W. Brodlie et al. / Distributed and Collaborative Visualization
Service Provider
Client
Shared (Service)
Individual (clients)
Data Design & Core A Design
Data Design & Core B
Core Figure 3: Client-based: visualization design and core on client.
fetched from the URL as a particular MIME-type, causing the appropriate browser plug-in or helper application—in other words the visualization application—to be launched. A sensible application of this approach would be where data is held centrally, say data collected by a government agency, and can then be examined by any interested party who has the appropriate client software. Equally this mode supports a form of collaboration where a researcher places data at a URL for download and visual analysis by others. It is also possible to launch the local visualization software directly, as the file import mechanism in many packages allows access to a URL.
Figure 4: Client-based collaboration: visualization design and core on both clients.
Service Provider
Client
Data Design
Core Figure 5: Client-based : visualization design downloaded to the client and core software already present on the client.
This client/service provider split is illustrated in Figure 3. Since large remote files are inconvenient to handle, especially if only a small amount of data is required, a further development allows a subset of the remote dataset to be extracted. DODS, Distributed Oceanographic Data System [Sgo03], consists of a data server, which can provide a front end for several data formats, and a client library which can be relinked with any application that already supports the netCDF library. A DODS-enabled application is capable of selecting a subset of the variables in the archive and a selected set of values of any base variable. The DODS server can also return CSV (Comma Separated Values) which enables a DODS data archive to be read by an Excel spreadsheet client. Development of these ideas continues under the umbrella of the OPeNDAP project [OPea]. This and the subsequent categories of service model can be extended to handle collaborative visualization. We show how the present category is extended in Figure 4. This diagram shows that the data is retrieved by two participants. Each can use their familiar, individually chosen visualization core software: for example, one using IRIS Explorer, another using MATLAB. Although the variety of images that may result from using different visualization systems could lead to problems of interpretation, this variety could be fruitful so long as the participants are able to communicate their visual results to each other. In this case with c The Eurographics Association and Blackwell Publishing 2004. �
somewhat limited collaboration, none of the software needs tailoring for collaborative use, relying on the ability of each chosen system to read directly from a URL. (ii) Visualization design downloaded from server: core software present on client. As mentioned above, we can distinguish between the visualization design and the core software. For an MVE, for example, the design is in the form of a pipework of modules which can be held remotely and the core software is the library of modules themselves and the basic MVE infrastructure. Thus one can see the MVE as an empty workspace into which a visualization program can be transferred and run. Thus a set of example or demonstration pipelines could be held on a server. This has significant potential for education and training as studied by Yeo [Yeo98]. Note that the data could be local or remote (via a URL) thus enabling both data and design to be delivered as shown in Figure 5. (iii) Visualization design and core software both downloaded to the client. In this approach, the distribution involves both the design and the core software, which is located remotely at a URL. This is fetched to the local machine where it is executed to create the visualization. Typically the software is fetched as a Java applet, to run within the framework of a Java Virtual Machine.
K.W. Brodlie et al. / Distributed and Collaborative Visualization
3.2.2. Generalized MVE architectures for collaboration Server
Client
Data Design Core Render Image Figure 6: Server-based: images transferred and displayed on the client.
This case is similar to Figure 5, but in addition the core software is downloaded to the client. Server-based visualization. Here we consider architectures where the visualization execution takes place on a server. (i) Image display on client. One extreme is that as much as possible takes place on the server. This is suitable if a remote data archive allows plots to be specified, for instance the Space Physics and Aeronomy Research Collaboratory [Spa] at the University of Michigan, USA. If we apply this to a collaborative situation, the application is centralized and each participant receives the results in terms of images or movie files. This is probably the most commonly used approach in distributed collaborative visualization. Any visualization system can be used and generic tools can be used to disseminate the results. PNG or JPEG can be used for 2D images and MPEG for movies. For institutions which are in a position to host such a facility, the Access Grid (see Section 5.2.3) offers an infrastructure to disseminate images and movie files. If the application is centralized, it is nonetheless possible to provide any participant with some control, but—again—it relies on generic tools. This is illustrated in Figure 6. (ii) Model rendering on the client. In this approach, the distribution involves carrying out part of the visualization task remotely, and transfering an intermediate representation to the local machine for eventual display. This is similar to Figure 6, with the Render function moved to the client. Web standards provide us with a range of formats that can be used for the intermediate representation, depending on the nature of the data, for example: VRML/X3D for Geometry and SVG for 2D Geometry.
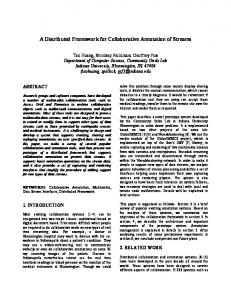
An MVE offers intermediate possibilities for sharing control and distributing output. These arise because modules may be introduced which provide support for collaborative working. Thus it becomes possible to pass data and control information between instances of the visualization systems run by different users in the collaborative session. In this way it is also possible to see collaborative visualization as an extension of ordinary single-user visualization. Collaborators may be introduced into a visualization session seamlessly. Collaboration becomes an extension to, not a replacement for, the normal working environment. As mentioned earlier in section 2, Wood, Wright and Brodlie [WWB97] introduced a model for this type of collaborative working, based on the familiar Haber and McNabb visualization model. The extension of the model to encompass collaboration is accomplished by introducing, potentially anywhere in the pipeline, intermediate import and export points for data and control information. The model in its most general form is shown in Figure 7. The key concepts captured by the notation are: • The generation of a visualization design may be described by a three-stage processing pipeline, following the Haber and McNabb model. • Each processing stage is controlled by a set of parameters. • A distributed collaborative visualization system can be modelled by a collection of pipelines, each of which represents the processing stages “owned” by a particular participant. These pipelines may be complete (contain all stages) or partial (contain only some stages, e.g. only the rendering stage). • Control information may be exported from one pipeline to others in order to synchronize parameter values between pipeline stages. Duce et al. [DGC∗ 98] developed a similar model—the MANICORAL model. One additional feature in that is the explicit representation of the interaction mechanism that allows a user to control the parameters of a module, through the introduction of an associated control module. This encapsulates and simplifies issues related to arbitration between different input sources and dynamic changes in control and arbitration. We note in passing that these MVE models deal with concepts and abstractions that might also arise when composing visualizations from collections of components that are Web Services or OGSA-based and that the models described here might be applicable in that context also. For a visualization system to be a suitable basis for the kind of collaborative working described in these models, there need to be well-defined points at which data can be identified as passing between components of the system. AVS and AVS/Express (see Section 6.1.2) have been adapted c The Eurographics Association and Blackwell Publishing 2004. �
K.W. Brodlie et al. / Distributed and Collaborative Visualization
control raw data
data
F
M
R
image
data control process parameters Figure 7: Wood’s model for collaborative visualization. F denotes the filter transformation; M the visualization mapping; and R the rendering. The horizontal arrows represent the progression of raw data through the transformation pipeline, emerging as an image. Control information can be imported from or exported to another pipeline at any stage. This is represented by the process parameters symbol. Similarly, data can be imported from or exported to another pipeline at any stage. This is denoted by the vertical arrows branching from the horizontal arrows between each processing stage.
in this way and the work done in the COVISA project (see Section 6.1.7) has become commercially available as part of the IRIS Explorer system. Compared with the service model described earlier, the MVE architecture offers a number of strengths. • It allows for the possibility of the visualization core being dispersed, according to need, so that, for example, Filter may be in one place and Map and Render may be executed on every participant’s system, which allows some degree of local control. Furthermore some participants may prefer to receive images relying on filtering, mapping and rendering being controlled by an expert, whereas other participants may wish to control the rendering themselves. • Where the service model envisages the responsibility for the shared components being in one place, the MVE architecture allows responsibility for shared components to be divided, as the participants’ expertise increases. For instance, one participant may control the input of data, pass the filtered data to another participant who has an experimental mapping algorithm he wants to share, then the mapped data is delivered to all participants. Experimental Internet applications such as collaborative dance, music or theatre could be a model here. In principle any collaborative visualization participant can be responsible for some modules, receive input and then offer output or the possibility of sharing control. • The MVE architecture allows data to flow both ways between participants. Suppose we start with one participant controlling some shared modules (Filter and Map). All the other participants receive the output and spin the resulting 3D scene. Someone notices an interesting feature and wishes to communicate it back to everyone else and delivers viewing parameters or an image to them all.
c The Eurographics Association and Blackwell Publishing 2004. �
3.3. Physical layer The physical layer binds the logical design and core software to particular physical resources. We outline the kinds of decision that can be made. • An archived data source could be the master copy of a real data archive or a mirror copy available over the Grid or a locally cached subset. • In the logical layer, decisions were made about the placement of subsets of the visualization application according to the roles played by individual participants. Here in the physical layer, a user’s visualization application could be placed on a compute host according to computing and networking resources and may also depend on access rights. The software could be placed: on the user’s local desktop computer; on a specific high performance computing engine, such as a cluster; or on a computer on the Grid with the best available fit. In principle, all the visualization processing functions could be placed elsewhere on the Grid, with the local desktop carrying out no more than a coordinating role. • Rendering could take place on a local PC; or on a nearby computer with a powerful graphics accelerator; or a raytraced movie sequence could be calculated on a render farm. • The input and output environment needs to be chosen and this is discussed more fully in Section 5. • In addition to using shared application software, collaborating participants need a means of communicating with each other and need conferencing and whiteboard tools. In Figure 8, a possible collaborative logical environment is shown and also its binding to physical resources. Here the Filter and Map components are placed on a host controlled by one of the participants. Both participants render the data. Since one of the participants would like to show the rendered
K.W. Brodlie et al. / Distributed and Collaborative Visualization
laborative systems across a heterogeneous set of workstations, rather than tie a solution to a single platform. This goal, of interoperability between platforms (hardware and operating system), is definitely achievable, in contrast to the interoperability between visualization systems. • Functionality. We can view collaboration functionality in terms of what information can be exchanged between users in a session:
Figure 8: Logical and physical layer for collaboration.
result, both of them use a desktop sharing system such as VNC as described in Section 6.2.1. 4. Analysis Factors for Collaborative Visualization In this section, we describe a framework within which different collaborative visualization systems may be compared and contrasted. It sets out a range of factors that might distinguish one system from another. For potential developers of new collaborative visualization systems, it gives a checklist against which a new design can be evaluated. The presentation here is based on the work of Wood in his PhD thesis [Woo98], and his experiences in developing the COVISA extension of IRIS Explorer [WWB97], but is also influenced by Duce et al. [DGJ∗ 98] and the earlier work by Pang [PW97]. Some of the description is specific to MVEs, where we talk of functionality involving modules, but other parts apply more widely. • Base Visualization System. – In an ideal world, one would like to be able to collaborate between different visualization systems, since different researchers in a team project may have a preference for using different systems. Such a goal is very difficult to achieve, since there is no standard functionality, nor a common architectural model. Moreover each system has its own proprietary internal data format, and so it is difficult to exchange intermediate data between different systems. Thus in what follows, we shall assume that collaboration is between users of a specified base visualization system. • Multiple Platforms. – In a collaborative session, it is more natural for each individual user to be able to use their own desktop system. There is therefore a requirement to support col-
– Exchange of data. The system should be able to share data from any point within a pipeline (rather than simply being able to share the raw data, or the end-product of the visualization). This allows different collaborators to look at the data in different ways, and allows some data to be kept private from other users (see privacy below). – Exchange of parameters. The system should allow sharing of parameter input to modules; this enables, for example, two collaborators to jointly steer the visualization, by sharing control of modules in their (probably) common pipeline. – Exchange of modules. The system should allow one user to automatically launch a module into the environment of their collaborators. This should also allow the automatic copying of the parameter set. – Exchange of networks. This extends the point above to cover a number of modules along with their interconnections. This would allow, for example, a more experienced user to set up a network for a novice, or allow a collaborator to send a fragment of a network to other collaborators complete with parameter settings and connections. This is potentially useful to help collaborators who join late to catch up with the current state of the system. • Participation. These aspects relate to how a user interfaces to the collaborative system: – Setting up. The initial setting up of a collaborative session should be as simple as possible, requiring the least effort on the part of the participant. Ideally, all elements required for setting up should be put in place by an administrator if possible. – Joining/leaving. It may not be possible for all collaborators to be available at the start of a conference, or to remain until the end. Facilities should exist for users to join and leave at any time. – Automatic launch/connection. As the collaborative system extends the modular paradigm of dataflow, where modules can be added to the system at any time, it is important to aid users by automating the external connections of the shared elements. – Floor control. Users should be able to set the type of conference control that they require. This can be used to offer different levels of access to a session to indic The Eurographics Association and Blackwell Publishing 2004. �
K.W. Brodlie et al. / Distributed and Collaborative Visualization
vidual users—for example to create a ‘See What I’m Showing’ style of conference. – Privacy. In addition to participating in a conference where all elements are shared, users need to work privately while still remaining part of the conference. This is particularly important where one party may wish to protect some information used in the analysis, but share other information. This could happen in a consultancy scenario, where a client seeks help from an outside consultant: the client may well wish to keep private some of the data in a visualization pipeline (since it could be of value to a competitor), but is happy to allow the consultant access to data after it has passed some way through the pipeline - just a subset perhaps. Another scenario could be a standards collaboration between different companies, where some proprietary information needs to be protected by each company, but other data can be shared. – Global View. The ability to view the network editor of other collaborators is useful to reassure users that they understand what each user is doing. It also improves the collaborative map building process since an expert user can more easily aid a novice. However, this will be more than a simple view of any collaborator’s entire pipeline since the ability to have private work contexts may mean that some pipeline elements are not shared. Note that this starts to place severe demands on the screen real estate, and so recent developments in large screen projection displays (such as Access Grid, see section 5.2.3) become very useful here. • System. The following factors relate to the behaviour of the implemented system: – Performance. The addition of collaborative elements to the single user system should not lower the overall performance of the tool. Also, shared data objects should be routed as quickly as possible between collaborators. Of increasing importance in this regard is the use of compression technologies, as the size of datasets continues to grow. – Reliability. Data objects passed into the collaborative session should be guaranteed to arrive at the correct output points intact. All participants should also be guaranteed that the data objects they are sharing are identical for all collaborators. – Robustness. The system should be able to survive the failure of any one part without the entire session collapsing. For example, if one user is suddenly unavailable the rest should be able to continue. – Scalability. Where the system is used for demonstration by one person to a group, there is a need for the system to be scalable. However, in situations where all participants are actively engaged in the visualization process, scalability of the system beyond four or five c The Eurographics Association and Blackwell Publishing 2004. �
users is less important - since the cognitive load on the participants will become a greater issue. • Target User. The tools need to be applicable to a broad range of users, with different skill levels in their use of visualization systems. In particular, we need to address two distinct classes of user: – Visualization Programmers. These would be considered an expert user of the base visualization system. They would be comfortable with dynamically constructing visualization pipelines determined by the current direction of their investigation. – Visualization End User. These are not expert users of any particular visualization system, yet derive benefit from using tailored visualization applications. 5. Visualization Input and Output In this section we consider data sources and presentation environments. The presentation environment is in effect the binding of the user interface to the physical layer in the reference model described in Section 2. 5.1. Input The source of the data to be visualized can take a variety of forms: data stored in some kind of repository (e.g. local filestore or data portal), data generated by a program (e.g. some kind of simulation) and data streamed from an instrument of some kind. The Grid is raising interesting challenges about resource discovery and the possibilities for using semantic markup as introduced by the Semantic Web to enable higher level forms of resource discovery. Atkinson et al. [ACK∗ 03] is a good survey of the issues of data access and integration. The issue of which data formats should visualization systems support is a complex one which is beyond the scope of this paper. We note that there is increasing interest in the use of XML to markup scientific data in some communities. The paper by Brodlie et al. [BWD∗ 02] gives a review of some pertinent activities. Large scale scientific computations often take the form of simulations: mathematical models that may run for very protracted periods of time tracking the evolution of some physical phenomenon. An example is black hole simulations [BS03] carried out using the Cactus Grid-enabled problem solving environment [Cac]. An important question for such simulations is how to interact with the simulation whilst it is in progress, perhaps modifying the parameters in response to observed phenomena in the evolving simulation. The research questions here are how to provide a computational steering interface to a simulation, such that the user can view the state of the simulation through visualization and change the parameter settings, without disrupting the simulation and to do this in a Grid environment. Projects
K.W. Brodlie et al. / Distributed and Collaborative Visualization
such as RealityGrid [Reaa] and gViz [gpw] are addressing these issues. 5.2. Presentation environments 5.2.1. Mayer’s taxonomy Nowadays there are many alternatives to the pervasive desktop CRT. Mayer [May97] divides the experience of viewing visual media into four categories: the “postage stamp” experience in which the field of view is constrained by technology and bandwidth, the ubiquitous “television experience”, the “theatre experience” which provides richer emotional involvement and the “immersive experience” where as Mayer puts it “mere eye scan motion is not enough and the viewer begins to engage head scan motion ... the viewer can leave the centre of focus and turn both their head and attention to discover and study details of the screen and contextual environment”. 5.2.2. Small devices Modern PDA devices equipped with colour display and wireless network capability (for example the HP iPAQ pocket pc range) fall into the “postage stamp” category. These devices are being used in distributed collaborative visualization applications, see for example the work of Stegmaier et al. [SME02] and there appears to be growing interest in the use of this kind of device in portable wireless video conferencing, including Access Grid conferencing [TLM∗ 02]. Mayer’s paper hints that the postage stamp experience can be enhanced to the level of the higher categories by careful design of the presentation. To realize this in a collaborative working setting where some participants are in the postage stamp category whilst others enjoy a theatre setting is a challenging research topic. The minimal graphics ideas of Herman and Duke may well find application here [HD01]. 5.2.3. Large format displays Large format displays may be considered to be in the theatre category. A recent collection of papers edited by Funkhouser and Li [FL00] covered this area. Topics included multiprojector display systems, research challenges in system architecture, remote visualization by distribution of compressed high-resolution images and case studies in using large format displays. The “Office of the Future” project at the University of North Carolina at Chapel Hill [WFR∗ 00] takes the view that the office will one day have ceiling mounted digital projectors and cameras that work together to support high-resolution projected imagery, human-computer interaction and dynamic image-based modelling. A related project at UNC, the “office of real soon now” (see Bishop and Welch [BW00]) describes experiments with large screen
projection as the only computer display, using readily available equipment. The authors write enthusiastically of the experience and note the impact it has on local collaboration where a group of collaborators can share the viewing experience. Uselton [Use02] has reported experience with use of this kind of technology at Lawrence Livermore National Laboratory. The Access Grid [Acc] also fits into the theatre experience category. It is providing a rich environment for large scale distributed meetings. remote lectures and collaborative working across an increasing range of institutions. Access Grid facilities include large format projection displays, high quality video and audio channels, and the possibility for group interaction with applications. A commercial version of the Access Grid called the inSORS Grid has recently appeared on the market from inSORS Integrated Communications [inS]. Brodlie et al. [BWB∗ 02] reported on experimental use of the COVISA collaborative visualization system within an Access Grid context to a UK e-Science meeting in September 2002. An impressive demonstration of collaborative visualization in the Access Grid, led by Lakshmi Sastry (Rutherford Appleton Laboratory) and John Brooke (University of Manchester), was given during the SC Global programme at the SC 2003 conference in November 2003. 5.2.4. Virtual environments A full discussion of the place and potential of virtual environment technology in visualization is beyond the scope of this paper. A recent review of this topic is given in a paper by van Dam et al. [vDLS02]. We consider a few examples in this section. For many visualization problems VR is a promising technology. Gallop [Gal96] provides an introduction to the application of VR in this field. The CAVE [CNSD93], is extensively used for scientific visualization. The need to cooperate at a distance is no less when VR is involved. VRML/X3D on the Web provides a way to cooperate using 3D visualization with the participants at different places, and working at different times. This approach has the advantage of relying on a formal (ISO/IEC) and accepted standard. Some examples of the use of VRML are discussed in Section 6.4. Several projects have experimented with cooperative VR. This allows people at different locations to set up representations of themselves (avatars), explore the same world together and communicate with each other about what they observe. For example DIVE [CH93a, CH93b, DIV, MVS∗ 02] allows several networked participants to interact in a virtual world over the Internet. This kind of technology can be applied to visualization results if the geometric output can be input to the cooperative VR system. The multiple users in the virtual world would together explore the abstract scene created by the visualization system. c The Eurographics Association and Blackwell Publishing 2004. �
K.W. Brodlie et al. / Distributed and Collaborative Visualization
However this is a passive way of approaching visualization. Experience shows that users want shared control over the process and not just shared exploration of the output. The results of the VIVRE project [VIV] also shows that users studying large problems with VR expect to use the virtual environment to exercise control over the visualization process [BGW99]. It is therefore a natural step to allow dynamic cooperative control of the visualization process from the virtual environment. However this is not common as yet. Researchers at the University of Stuttgart are extending COVISE (discussed in Section 6.1.4) by adding VR capability to the system [COVb, COVa]. The user works in a CAVE and some of the user controls in COVISE are available in the virtual environment. The user can access further controls outside the CAVE. Steed et al. [SACP03] at University College London also used collaborative virtual environments in the visualization of MRI imaging scans. Interaction is supported through a custom 3D widget library. Viewing environments include a Trimension ReaCTor facility (similar to a CAVE). Augmented reality techniques also find application in collaborative visualization. The Studierstube project [Stu] allows multiple users in a “study room” to collaborate whilst studying 3-dimensional scientific visualization. Each participant wears an individually head-tracked see-through head mounted display and thus has their own personal view. It is plain that each person’s view is individually rendered thus increasing the computational load. New visualization calculations can be triggered from any participant’s virtual environment. Subsequent work in this project has included the use of augmented reality in mobile collaborative working. There is a growing interest in expanding the scope of immersive technology to include aural and haptic senses in addition to the visual sense. The Visual Haptic Workbench is an example of this trend [BIJH00].
6.1. Visualization systems For each of the systems below, we first describe some aspects of their architecture and features, before commenting on their use in a distributed or collaborative environment, illustrated with examples where possible. Our selection (which is not intended to be exhaustive) is a mixture of commercial and public-domain systems; information on their availability can be obtained from the references (usually web-based) in this subsection. 6.1.1. Amira Amira [Amia] is an object-oriented visualization system, based on Open Inventor [Wer94]. Unlike many of the other visualization systems discussed here (see Sections 6.1.2, 6.1.7, 6.1.9), it is not based on a dataflow model. Instead, data objects are persistent in memory and accessed by Amira modules using the C++ interfaces of the data classes. Because data are passed between modules as C++ objects (as in a normal C++ program), there is no overhead for module communication. Users can extend Amira (adding new modules, data classes, editors and I/O methods) by deriving from an existing C++ class. Amira users create applications via a visual programming interface by connecting Amira modules together. Using Amira to display the results of a simulation could be done [Amib] by standard methods such as connecting to the simulation via file transfer, or by embedding the simulation into an Amira module, or by writing a new module which communicates with the simulation via sockets or shared memory. AmiraVR is an extended version of Amira designed for use with large-screen displays (Section 5.2.3) and in virtual environments (Section 5.2.4). It contains extensions for 3D tracking, multi-pipe rendering and stereo display. 6.1.2. AVS5 and AVS/Express
6. Systems and Frameworks In this section, we describe some standalone visualization systems and packages (see Section 6.1), concentrating on their distributed or collaborative functionality. We then discuss a few enabling technologies for distributed and collaborative visualization (see Section 6.2) which could be used alongside existing systems (even those which do not have these features built-in). Also in this section (see Section 6.3), we describe a number of recent research projects which have contributed to our understanding of collaborative visualization, alongside a number of current projects from the UK e-Science programme. Finally, in Section 6.4, we describe the particular area of web-based visualization, where a number of distributed solutions have been proposed over the past decade. c The Eurographics Association and Blackwell Publishing 2004. �
AVS/Express [AVSb] provides an application development environment for visualization using a visual network editor. Although in many respects an MVE, it is based on an objectoriented model which is accessible via the visual editor (and a script language V) that allows successively deeper levels of the module structure to be accessed. An application can be built making use of the higher-level modules resulting in an obvious AVS/Express look-and-feel or alternatively can be built using the many lower-level facilities—including a GUI toolkit—resulting in a more highly tailored interface. It is possible to create packaged run-time applications which has helped the product to gain acceptance in commercial markets, as well as the science, research and educational market. Although the idea of a visually specified network of modules was already known, Express’s predecessor, AVS5 [AVSa], is believed to be the first commercial system to apply the concept to computer-assisted visualization,
K.W. Brodlie et al. / Distributed and Collaborative Visualization
having been in active use since around 1989 [UFK∗ 89]. The name AVS (without qualification) was originally associated with this product but has gradually come to be associated with the newer product, AVS/Express. The digit 5 refers to the version that original AVS had reached when AVS/Express was introduced. AVS5 is still updated with minor releases and platform updates, while AVS/Express continues to be under active development. Part of the AVS/Express application can be executed on another host machine, by means of the Remote Module Support facility, which is controlled from a V file. AVS5 also supports the use of remote modules. The MANICORAL project [DGJ∗ 98] used AVS/Express as the basis of an experimental distributed collaborative system. The Collaborative AVS project [Joh98] used AVS5 to build a distributed collaborative system (called cAVS), which is available for use [cAV]. The project was originally based at the San Diego Supercomputing Center before moving to the University of Texas. AVS/Express Multipipe Edition is a version of AVS/Express which contains multi-pipe rendering extensions for use in virtual environments (Section 5.2.4). It is currently targetted at high-level SGI systems running IRIX and clusters of Windows-based PCs. 6.1.3. Cactus Cactus [Cac] consists of a central core component, called the flesh, and a set of modules called thorns. The thorns implement a range of computational codes which can run on distributed computing resources while being connected to, and orchestrated by, the flesh. The flesh controls when thorns will execute and how data is routed between them. Cactus comes with a set of thorns such as mesh generators etc. and also provides a low level API to allow users to integrate their own code as thorns. The systems can be controlled by scripts that determine the choice and execution order of thorns, rather than the graphical interfaces of other systems such as SCIRun (see Section 6.1.11).
use for collaborative visualization, though since the documentation says it links to IRIS Explorer, which offers collaborative tools (see Section 6.1.7), then collaboration could in principle be achieved in this fashion. 6.1.4. COVISE COVISE [WLR93] (COllaborative VISualization Environment) falls into the modular visualization environment category and was originally developed by Wierse et al. It allows a user to run modules both locally and remotely, employing a data manager process on each host to manage the flow of data beween modules. Like other distributed MVEs, such as IRIS Explorer (see Section 6.1.7), modules connected together on the same host communicate data through shared memory, while modules connected beween hosts pass data via the local data managers. The user interface is connected to the modules through a controller process. Collaborative working was originally achieved by replicating the user interface on the desktop of each collaborator and connecting it to the single controller process started by the first user. Control is managed on a master/slave basis where the master can drive the system and the slaves get to see the results. As changes are made and the output updated, the new 3D scene is passed from the controller process to each user interface for local rendering. More recently, a company named Vircinity [Vir] is marketing several new versions of COVISE, one of which offers collaboration. This operates differently from the original in that now the whole system is replicated at each site and the user interfaces are synchronized together. This can yield better performance since only small user interface changes need be shared across the network rather than potentially large 3D scene descriptions. Data is assumed to have been shared before the start of the session. 6.1.5. Ensight
Cactus builds on the Globus Toolkit [Glob] to provide secure access to remote resources, together with secure communications and job scheduling on remote resources. It also uses a number of other standard libraries and toolkits such as PETSc for scientific computation and HDF5 for data output.
Ensight [Ensa] is a standalone application aimed at the visual analysis and postprocessing of engineering data. It offers a standard set of visualization and plotting algorithms with interfaces to several engineering solvers for CFD and FEA problems but, being aimed at end-users rather than developers, is not extensible (no new algorithms can be added, although users can create their own readers to import data in custom formats).
Visualization is provided via standard products such as OpenDX (see Section 6.1.9), Amira (see Section 6.1.1) and IRIS Explorer (see Section 6.1.7). These systems effectively operate as thorns connected to the Cactus system via special modules written for each system which are able to read the data formats exported by Cactus (for example, HDF5) using the Cactus API (in addition, some work is apparently being done to develop a thorn to output Cactus data in the OpenDX native format). No specific mention is made of its
A more advanced version of the package (called Ensight Gold) incorporates extra features for handling large data sets including parallel processing, multipipe rendering for output to immersive environments, and collaboration. The collaboration architecture [Ensb] is a master/slave one: it allows the display from a pilot user’s Ensight session to be sent to that of a copilot user, so that all actions of the pilot are reproduced on the copilot’s machine. At any point in the collaboration, the copilot can take over control by requesting to be c The Eurographics Association and Blackwell Publishing 2004. �
K.W. Brodlie et al. / Distributed and Collaborative Visualization
the pilot; if this request is successful, the users swap roles. Collaboration is currently limited to two participants. 6.1.6. IDL and PV-Wave IDL [IDL] and PV-Wave [PV-] are array-oriented languages for the creation of visualization and analysis applications. We discuss them together because they share a common heritage in design and architecture (PV-Wave was an offshoot of the original IDL development tree), and still have much in common, even at the level of specific commands. Users of these systems can enter commands from the keyboard, where they are immediately executed, or combine them into scripts which are compiled and executed. Both systems contain a large number of high-level graphics, image processing and numerical analysis functions, along with routines for the control of an application’s interface. In the past, IDL and PVWave have been viewed [Wal93] as being stronger for the display of data in one and two dimensions than in three; this has been improved in later releases. Thus, IDL now includes Object Graphics, which provides an object-oriented interface to graphics commands which are based on OpenGL, and PV-Wave now includes new functions which allow access to some of the VTK (see Section 6.1.13) algorithms. Although IDL and PV-Wave are both proprietary languages, they incorporate interfaces to standard languages such as C and Fortran, and also support communication with other applications using Remote Procedure Calls. There is also a Java-based interface to PV-Wave [JWA] through which a Java client can send data and graphics commands to PV-Wave running on the server. PV-Wave then generates a graphics file which is returned to the Java client and displayed. 6.1.7. IRIS Explorer IRIS Explorer [Fou95, Walss] is a modular visualization system based on the data flow model. The system provides a large selection of modules, listed in the Librarian, which the user launches into the workspace (Map Editor) and connects together with wires to form a dataflow pipeline, or map. The system can be extended by users adding their own code as modules and integrating them into IRIS Explorer using the provided API. These modules could be anything from visualization algorithms generating geometry to simulations producing data. This system provides a mechanism to allow modules within a pipeline to be run on a number of remote computing resources. The user opens a new Librarian on each remote resource with the authentication being managed by rsh. Each remote Librarian lists local modules which can be dragged into the Map Editor and connected into the Map in the same manner as locally running modules. Remote modules are simply differentiated by having the name of the host on which they are executing on their control panel. c The Eurographics Association and Blackwell Publishing 2004. �
IRIS Explorer transparently manages the data transfer between resources as the data passes along the pipeline, using shared memory for modules connected together on the same host and through sockets for modules connected across host boundaries. Collaborative working can be achieved using a set of provided modules originally developed as part of the COVISA [WWB97] project. These modules allow connection to a collaborative session and provide a tool to aid sharing of the map construction process. In addition, data and control can be shared between the separate instances of IRIS Explorer being run by each collaborator. The modules can be used in the exploration phase of visualization where the map may be changing as new modules are tried and different data is shared, and also in pre-defined maps packed as applications for end-users. In the UK e-Science gViz project (see Section 6.3.3), IRIS Explorer is being extended to operate in a distributed fashion within Grid-based computing environments. 6.1.8. MATLAB MATLAB [MAT] is a high-level scripting language and a problem-solving environment for mathematical and scientific calculations. Like other script-based systems such as IDL and PV-Wave (see Section 6.1.6), users can either enter commands from the keyboard for immediate execution, or combine them into scripts (called m-files in the case of MATLAB) for more efficient interpretation. Although the original design goal of MATLAB was the provision of interactive high-level access to numerical analysis libraries, the system quickly expanded to include graphics commands which can be used for visualizing numerical results. More recently, MATLAB has been extended via packages of mfiles called Toolboxes into specific application areas such as signal processing, optimization and mathematical finance. MATLAB is a single-processor application, but a number of projects have investigated running it in a distributed environment. For example, the Parallel Toolbox [HLP96] runs MATLAB processes on multiple processors. Communication is via PVM, and so is primarily intended for a network of workstations. The MultiMATLAB system [TMC∗ 96] system of Trefethen et al. has similar design goals, but here the processes communicate via MATLAB-style commands built on MPI. MultiMATLAB incorporates distributed visualization by first setting up a graphics window within each process for it to draw into, and then arranging the windows into a grid on the screen. We have been unable to find any examples of collaborative visualization using MATLAB. 6.1.9. OpenDX OpenDX [Opeb] is a modular visualization system based on the dataflow model. It originally began as the IBM commercial product Visualization Data Explorer, but was offered by
K.W. Brodlie et al. / Distributed and Collaborative Visualization
IBM as an Open Source project in 1999. There is an active mailing list and improvements continue to be made to the system. Many example applications of its use are available within the distribution. Others may be obtained from Treinish [Opec] and via the project website [Opeb]. Like other MVEs (see Sections 6.1.2 and 6.1.7), OpenDX can access modules on multiple hosts, but we are not aware of any work to develop a collaborative visualization system based on it. 6.1.10. pV3 pV3 [pV3] is a library for the real-time visualization of large-scale transient (unsteady) systems. Based on an earlier system called Visual3 [Visi] (pV3 stands for parallel Visual3), it has been re-designed specifically for the coprocessing visualization of data generated in a distributed compute arena. One of its design goals is to allow the compute solver to run as independently as possible–thus for example, pV3 can be configured to plug into the simulation, display the transient data, and unplug from the calculation. pV3 provides a centralized interface to a distributed computation. The pV3 user inserts calls to the pV3 API into the simulation code which extract visualization data from the simulation data structures and passes it to the pV3 server. pV3 uses PVM for passing data around the network (though it can also use MPI). Without a pV3 server running, the number of members of the PVM group pV3Server is checked at each simulation timestep. If no servers are found, no action is taken. When a pV3 server starts, it enrols in the pV3Server group and, when the solution is next updated, the visualization session begins. At each subsequent timestep, the appropriate visualization data is calculated, collected together and sent to the active server(s), which display the data. Since the number of pV3 servers is unrestricted, a collaborative application could be constructed by starting up a set of them at different locations and connecting them to the simulation. The view which each server provides to their user is independent, but one server can pass its 3D viewpoint to the other servers in the group so that they are all looking at the same part of the data. pV3 also supports a soft cursor (for each additional server) so that one can see where another user is pointing. Computational steering (which is also supported by pV3) is controlled in these settings so that only one user can modify the state of the simulation at any time. The control can be handed over to another user, if desired. 6.1.11. SCIRun SCIRun [PJ95] is an MVE developed at the Scientific Computing and Imaging (SCI) Institute at University of Utah. It allows the user to connect a set of pre-written routines together in a workspace to form a dataflow network. These
routines execute as independent threads within a single executable, in contrast to other MVEs such as IRIS Explorer (see Section 6.1.7) which run modules as individual processes. Despite SCIRun operating as a single executable, the opportunity still exists for users to extend it by adding their own code. In this case, it is compiled directly into the system itself. Advantages of using threads are that there is marginally less overhead during startup, when compared to forking new processes, and all threads may access data directly without having to be connected through shared memory. A disadvantage of threads is that they must exist on the same machine, and in that respect SCIRun has been targeted at shared memory parallel systems. To extend beyond this limitation, more recent implementations of SCIRun have employed “bridging” [JPWH02] which essentially allows SCIRun to access features of commonly available libraries. One level of bridging supports socket communication to external processes. SCIRun has been used for computational steering within the Uintah [dMPJ00] which is designed to run on massively parallel distributed memory architectures. At present, no collaborative components built directly into SCIRun have been reported, but it has been used with VNC [SCI] (see Section 6.2.1) to provide collaboration through screen sharing. 6.1.12. VisAD VisAD [HDP92] is a Java component library for interactive and collaborative visualization and analysis of numerical data. It makes use of Java’s RMI technology, which allows methods of remote Java objects to be invoked from other Java virtual machines, possibly on different hosts (or on different Java interpreters on the same host). VisAD’s Java interface can be called from Jython, which is an implementation of Python in Java. The VisAD developers provide a one-stop installation package for VisAD and Jython and provide additional Jython VisAD functions for further convenience. It is envisaged that some VisAD users will work entirely within Jython. The VisAD spreadsheet program provides a simple visualization capability without requiring programming. Each spreadsheet cell may display data read from a file or derived by computation on data in other cells using a formula text box. Each cell is itself a VisAD data object. VisAD applications can run in any of three networked modes: standalone, server or client. Standalone mode is the ordinary non-networked application mode. Server mode is almost identical to standalone mode, except that, once the data setup is complete, the application listens for (and responds to) clients in the background. In client mode, the application connects to the server application and has it send the information necessary to construct copies of any (or all) of the server’s Displays. (Display is the top-level object in the VisAD visualization architecture. It contains a c The Eurographics Association and Blackwell Publishing 2004. �
K.W. Brodlie et al. / Distributed and Collaborative Visualization
window into which data objects are rendered, along with some associated controls.) Once that is done, the server and client remain connected and forward any significant changes to each other, so that the Display(s) remain synchronized. A client’s Display information comes from the server. All data for the copied Display comes from the server as well, so if the server application is terminated, the client’s Display will no longer work. The VisAD home page [Visc] contains a number of examples of collaborative applications. For example, the Milky Way Galaxy Designer is an interactive application which allows the user to adjust model parameters in order to match a sky map to earth observation data. In collaborative mode, all users see the same set of parameter values, and all can adjust them. Documentation on how to make a VisAD application collaborative is also available [Visd]. Another example (the 2D Shallow Fluid Model) demonstrates the use of VisAD in computational steering. Here, users can set the initial configuration of the simulation and change its parameters (both physical and numerical) during the run. The construction of distributed applications in VisAD is facilitated by its event-driven design [Vise]. Typically, a VisAD object will implement the methods of a listener interface before registering itself as a listener with another object. Whenever something interesting changes within this second object, it passes an event to all its listeners which, through RMI, could be on other machines. Thus, VisAD could be used in the development of an application which is distributed across a number of machines in a network. 6.1.13. VTK VTK [VTKa, SML03] is an object-oriented software system for 3D computer graphics, image processing and visualization. It consists of a C++ class library, together with several interpreted interface layers including Tcl/Tk, Java and Python which can be used to access the classes and build applications (applications can also be written in C++, of course). VTK is based on the dataflow model; application builders use it to create a VTK pipeline whose elements correspond to the elementary steps in the Haber-McNabb visualization reference model [HM90]: a Source for data, a Filter to convert the data into geometry and a Mapper to map the geometry to graphics. VTK has been used as part of a tool for the development of collaborative visualization applications for CAVEtype environments [VTKc]. These types of systems require the rendering of the same geometry multiple times simultaneously to different graphics pipes, which VTK does not support (since its geometry structure cannot be traversed by multiple processes simultaneously). Accordingly, the geometry, once created in VTK, was then passed to IRIS Performer for (multi-pipe) rendering [VTKb]. Other elements of the tool [VTKc] included an application framework to assist with the construction of tele-immersive applications. c The Eurographics Association and Blackwell Publishing 2004. �
VTK has also been used as the visualization component of the ICENI toolkit (see Section 6.3.4). 6.2. Enabling technologies for distributed collaborative visualization Here, we briefly discuss a few examples of enabling technologies, including remote display and rendering (see Sections 6.2.1 and 6.2.2), some of the more general work on peer-to-peer technology (see Section 6.2.3) and the emerging areas of Web Services and Grid Services (see Section 6.2.4). 6.2.1. Shared desktop display A very simple yet powerful approach to collaborative visualization is to make use of a tool for remote display. Probably the two best known of these are VNC, which is multiplatform, and Microsoft NetMeeting, which is Microsoftspecific. These allow the desktop of one machine (the server) to be displayed on a number of clients (the viewers). The success of these methods stems from efficient compression of the frame buffer so that it becomes feasible to transmit it to a number of viewers, even when there are frequent screen changes (although too frequent changes reduce the performance considerably). VNC. VNC stands for ‘Virtual Network Computing’ and was first developed at AT&T. It is now being developed in two strands: RealVNC [Reab] is being evolved by the original developers as an open source project; TightVNC [Tig] is a derivative of VNC, offering different compression algorithms. VNC has been successfully used in Access Grid visualization experiments [BWB∗ 02], and Stegmaier et al. [SME02] use VNC for efficient image compression (having rendered OpenGL remotely). A nice feature of VNC is that input control can be passed between server and viewers. Microsoft technologies. Microsoft have included remote display with their NetMeeting product for several years, and more recently have included it with MSN Messenger [MSN] (version 4.7). The ‘passport’ service is used to handle authentication. 6.2.2. Remote rendering SGI Vizserver. Vizserver [Viz] is an SGI product designed to allow remote access to the high performance graphics offered by its hardware. Traditionally, to benefit from the graphics performance of machines like an SGI Onyx with Infinite Reality graphics, users had to be able to view a display connected directly to the machine. Vizserver allows users to have access to that performance by running the server component of the software on the Onyx and connecting to it using client software provided by SGI. Once connected, the client software opens a local window and displays an SGI desktop from which users may run any normal SGI application. The OpenGL output from these programs is rendered
K.W. Brodlie et al. / Distributed and Collaborative Visualization
to a buffer on the server and the pixels transferred across the network to the client. The user is able to select from a number of compression schemes to trade off visual quality with frame rate. Collaboration is achieved by allowing multiple (up to 5) clients to attach to one Vizserver and each receive the same image. Clients are available for WindowsNT/2000/XP, Solaris and Linux. Each distinct session attached to the server uses the graphics resources of a whole graphics pipe. Vizserver has been used at Manchester University to help surgeons at Manchester Royal Infirmary access 3D views of patient data whilst in the operating theatre [Usi, Joh03, MJ03]. Vizserver is used to give access to the 32-processor SGI Onyx at Manchester University from a laptop in the operating theatre. This display is projected onto the theatre wall so surgeons can manipulate threedimensional reconstructions of the patient’s organs whilst operating on them in real life. Chromium. Chromium [HHN∗ 02] is an open source graphics library [Chrb] which allows distributed network rendering for OpenGL applications. It does this by intercepting OpenGL API calls, and then modifying, deleting, replacing or augmenting them. Thus, for distributed rendering, the commands are split across a collection of graphics cards. A particular feature of Chromium is that it is non-invasive—no modification (or even recompiliation) of the application is required. Beerman has used Chromium has been used as the basis for the Cluster Rendering Utility Toolkit (CRUT) [Clu] which is directed towards the enabling of the use of clusters as an interactive remote resource. Chromium is also being used in the ICENI project (see Section 6.3.4) for distributed rendering across the network. 6.2.3. Peer-to-peer technologies A powerful model for distributed computing has been developed in the JXTA Project for Peer-to-Peer (P2P) computing [JXT]. JXTA provides a networking framework to support P2P programming between a group of peers. Existing single-user applications written in Java can become collaborative, by replicating the application at each peer, and using the concept of JXTA Pipes to share any interface controls between the peers. Commercially, JXTA has been used in the VistaBoard charting system [Visg], and in the context of Grid computing it has been used in the Triana system [TSP02]. 6.2.4. Web Services and Grid Services Web Services [WSO] is an increasingly popular framework for creating distributed applications. It uses standards such as the Web Services Description Language (WSDL) to describe the functions that can be accessed remotely. Tools exist to interpret these descriptions to discover services and
automatically generate compatible code stubs. Applications typically use the Simple Object Access Protocol (SOAP) as a means of accessing those remote functions. SOAP uses XML to encode the request and also the returned result. Much work has been done using Java and systems such as Apache Tomcat [Tom], IBM’s WebSphere [Web] and Microsoft’s .NET [.NE]. Web service based applications can be built in other languages such as C/C++ using libraries such as gSOAP [gSo, vEGP03]. Grid Services is looking to extend the Web Services framework by adding among other things, security and the ability to discover and instantiate transient services. Grid services information can be found at the Global Grid Forum [Gloa] web site. 6.3. Collaborative Visualization Projects In this subsection, we discuss a few research projects which are using or developing methods of collaborative visualization. With the exception of one project (Section 6.3.6), all of these are currently active in the UK eScience programme [UK ]. Before looking at recent work however, we describe two older projects—CSpray and FASTexpeditions—which have been successful in this field. CSpray [PWG95] was the collaborative version of the Spray [PS93] visualization system developed at UCSC. Spray took a novel approach to the visualization process by using a spray can metaphor and smart particles (or sparts); users selected a spray can and manipulated it in 3D to aim into the data space. Pressing the top of the can sprayed the sparts into the volume where they interacted with the data generating abstract visualization objects (AVOs). AVOs could take the form of lines, spheres or polygons and could implement visualizations such as coloured dust particles, streamlines and contours. The collaborative extension worked through individual users being able to create spray cans which they could use to generate AVOs. These cans could be private and used only by their creator, or public and used by all. The AVOs created could be shared by all collaborators or kept private to allow a user to create visualizations independently of other collaborators. Viewpoints could be shared, and the current position of collaborators within the scene could be viewed. FASTexpeditions [FASb] was the collaborative extension to the Flow Analysis Software Toolkit (FAST [FASa]) developed at NASA Ames. FAST is a toolkit of programs that run simultaneously allowing the user to visualize the result of numerical simulations. It was designed primarily to visualize unstructured data from CFD type applications. The FAST system allowed the generation of an audit trail of interactions that can be saved so as to allow a session to be replayed. This audit trail was used in both the web component and the collaborative component of FASTexpeditions. In the web environment the audit trail was used as the trigger to start FAST as a helper application to the web browser. Once the audit trail file is downloaded and read into the loc The Eurographics Association and Blackwell Publishing 2004. �
K.W. Brodlie et al. / Distributed and Collaborative Visualization
caly executing copy of FAST it took control of the system, guiding the user through the visualization process. In the collaborative setting, multiple distributed copies of FAST were running (one per user) and the audit trail file was streamed in real time from one user’s copy (the pilot, in FASTexpedition’s terminology) to the rest (the passengers). Thus the pilot was able to control all of the visualization systems and guide the passengers through the visualization process. The pilot was distinguished from the other users by a token; passing this to one of the passengers causes them to become the pilot.
the portal user. It consists of a set of interfaces on the client side, which talks to the GAPtk server using SOAP [SOA]; the server communicates with the Grid using Globus [Glob]. The main results from the project will be a set of software modules and services that can be embedded within portals for problem solving environments. The toolkit is being used to provide visualization capabilities within the GODIVA [GOD] project, which is investigating ocean circulation and its effect on climate change. 6.3.3. gViz - Visualization Middleware for e-Science
6.3.1. climateprediction.net The climateprediction.net [cli] public-resource computing project aims to harness the spare CPU cycles of a million individual users’ PCs to run a massive ensemble of climate simulations using an up-to-date, full-scale, threedimensional atmosphere-ocean climate model. The ensemble of runs is required in order to establish uncertainty limits on model predictions, leading to better-informed policy decisions regarding climate change. Participants in the project download the model and carry out a series of runs, each of which is characterized by a unique set of parameter values that are obtained from a cental server. Results are uploaded to the server at the end of each run for later analysis. Visualization plays an important role in this project, both on the desktop, and in the analysis phase. Unlike some other public-resource projects, a high degree of long-term participant interest is needed because of the resource requirements of each run. Accordingly, desktop visualization has been added [SFW04] to the model in order to show its realtime evolution. An important design consideration for the visualization is the need to take the background of the participants into account—the interface must be simple enough to be run by inexperienced PC users with a limited scientific background, and yet compelling enough to be readily grasped, since one of the broader aims of the project is to raise awareness of the issues surrounding climate change.
gViz [gpw] is a project funded by the UK e-Science Core Programme, and has two main targets: first, to grid-enable two existing visualization systems, IRIS Explorer (see Section 6.1.7) and pV3 (see Section 6.1.10), so that visualization tools are available as early as possible for users of computational grids; second, to develop some longer term thinking on distributed and collaborative visualization, where XML languages are used to describe visualization data, and visualization programs themselves. In terms of IRIS Explorer, a demonstrator has already been built in which the modules in a network can be distributed across a set of Grid resources, but controlled from the desktop. This is achieved in a secure manner using Globus middleware to replace the existing insecure rsh mechanism. The COVISA collaborative facilities (see Section 6.1.7) are immediately available, and so we have a framework for Grid-enabled distributed collaborative visualization. An important application of this is in computational steering, where the simulation model runs on a remote server, but is controlled from the desktop. Indeed, a separate computational steering API is being developed: this will lead to a more flexible approach where the simulation runs externally to the visualization system, and the visualization system will act as a front-end monitoring tool which can connect to the simulation to check its progress, change parameters, or receive results for display.
6.3.2. GAPtk
The grid-enabled version of pV3 will be created by replacing its PVM-based communications with a web service mechanism using the gSOAP package. The distributed computation will provide a web service offering data for visualisation and the pV3 “servers” will then connect to this as web service clients. gSOAP provides an efficient C/C++ web service implementation, with both SSL and GSI security options.
The Grid-Aware Portals toolkit (GAPtk) project [GAP] aims to provide scientists with a set of visualization utilities based on the Web and Grid services model along with appropriate APIs that will enable them to exploit the power of the Grid for their data analysis. One of the primary goals of the project is to retain existing familiarity with domain-specific application environments. The layered architecture of the toolkit is designed to hide the Grid computing structure from
The use of an XML language to describe visualization data promises to lead to better inter-operability of visualization systems, and the more effective development of new visualization software (which can be written to operate on these standard datatypes). Using XML to describe visualization programs—for example the way in which pipelines are constructed in an MVE application—will pave the way for the exchange of visualizations between users of different
The desktop visualization has been implemented using a public-domain implementation of Open Inventor [Wer94]. The analysis phase of the project, during which data from the individual runs will be collated and compared, will provide opportunities for the application of distributed collaborative visualization systems (see Section 6.1).
c The Eurographics Association and Blackwell Publishing 2004. �
K.W. Brodlie et al. / Distributed and Collaborative Visualization
systems. In fact, it could almost be seen as a realization of the conceptual layer discussed in Section 2.
client). Current work involves moving this to an OGSAbased architecture, in which standard grid service technologies replace file transfer between components.
6.3.4. ICENI
Because of difficulties experienced in integrating existing MVEs into larger distributed applications, RealityGrid has selected VTK (see Section 6.1.13) as a lower-level environment in most of their “fast track” work, along with enabling technologies such as VizServer and Chromium (see Sections 6.2.2, 6.2.2). In addition, ICENI—which uses much of the same technology (see Section 6.3.4)—is being used within the “deep track” to enable collaborative visualization and computational steering within RealityGrid [ICEa].
The goal of the ICENI [ICEb] project is the provision of high-level abstractions for scientific computing which will allow users to construct and define their own applications through a graphical composition tool that is integrated with distributed component repositories. The project aims to deliver this environment across a range of platforms and devices on the Grid using a scheduling service. ICENI is being implemented in Java and JINI, but is able to interoperate with the Open Grid Services Architecture (OGSA) [FKNT].
6.3.6. Visual Beans One of the applications of ICENI—at least, for demonstration purposes—is computational steering and visualization [SND02]. The ICENI framework is used to link together a visualization client and server, and to pass data to the server from a running application. The visualization server hands the data off to a renderer (current demos are based on VTK (see Section 6.1.13)) which can then send the graphical output back to the visualization client. This can either be done using standard OpenGL remote rendering, or using Chromium (see Section 6.2.2). The ICENI project has also made use [KSND03] of the way Chromium can be configured with the ACE networking framework [ACE] in order to send its graphics as a video stream directly to a multicast address [Chra]; this effectively provides a bridge between Chromium’s distributed rendering and the Access Grid. Collaborative visualization can be supported either by connecting multiple renderers to the server (for the display of different datasets from the same application) or by connecting multiple clients to a renderer (for the display of the same dataset at multiple locations). 6.3.5. RealityGrid RealityGrid [Reaa] is a project which aims to examine how scientists in the condensed matter, materials and biological sciences communities can make more effective use of the distributed computing and visualization resources provided by the Grid. Development of RealityGrid is being run along twin tracks: a “fast track” uses currently-available Grid middleware to construct a working grid, while a “deep track” is harnessing computer science research to creating a flexible problem-solving environment in which to embed the RealityGrid. RealityGrid is making use of visualization as part of distributed applications in which the simulation in one place communicates with the visualization in another and a steering client in a third. The RealityGrid steering architecture is built around a library, calls to which are embedded into each of the three components (simulation, visualization and
The main aim of the Visual Beans project [Vish] was to investigate the role of component technology together with advanced middleware platforms to support the construction of dynamically adaptable distributed cooperative visualisation software. The project developed and extended a middleware platform called TOAST (which is CORBA-based) to provide a component framework that is inherently reconfigurable: components can be dynamically added, removed and replaced at run-time. The platform also supports migration of components to designated target locations. A number of experimental systems were constructed as demonstrators and proof-of-concept implementations of the framework and visualization components, the latter constructed using VisAD (see Section 6.1.12). 6.4. Web-based Visualization Projects An important class of distributed visualization applications are based on Web technologies, and in particular on the client-server concept. In this section we describe a number of projects in which different aspects of web-based visualization have been explored. We follow the classification introduced by Brodlie [Bro00]: Full service where the visualization is created remotely by the service provider—here the visualization design and core software are both supplied by the visualization service provider, and the service provider also executes the software for the user; Software delivery where the service provider transfers the software needed to create the visualization over the network to the user—here the design at least is transferred, plus perhaps some core software, but the execution is the responsibility of the user; and Local operation, or Data Only where the visualization software is assumed to be already available locally, and is just triggered by download of data over the web—here the design and core is with the user, who also has responsibility for the execution. 6.4.1. Full Service In this category, the main visualization processing is carried out on a server and graphical data is transmitted to the client, c The Eurographics Association and Blackwell Publishing 2004. �
K.W. Brodlie et al. / Distributed and Collaborative Visualization
for viewing within the browser. There are different styles, determined by the extent of the rendering delegated to the client: the graphics data may be in the form of a rendered image, requiring only image display software; or it may be in the form of a 3D VRML (or X3D) model, requiring a VRML browser on the client. This approach makes modest demands on the client side—in terms of processing power (only rendering is required); in terms of software availability (only image or 3D graphics software needed, and commonplace in browsers anyway, with VRML/X3D an ISO standard for 3D Internet graphics); and in terms of training (only ability to use image or VRML tools is required). Nothing comes free of course, and this approach requires the presence of a server with the following ingredients: processing power to create the visualization as an image or 3D model; visualization software itself; and human involvement to create suitable visualization applications. Moreover, if several clients connect at once, then the processing requirement on the server can be quite severe. In early versions of this approach, the user interaction was through an HTML form, but in later versions a Java applet is usually used in order to provide a richer interaction environment. An early example of this approach is described by Wood et al. [WBW96], based on IRIS Explorer as the visualization system. The basic principle of the method is as follows. The user enters details on an HTML form to specify the location of the dataset (as a URL say), and a recipe for the style of visualization required. The form is processed by a CGI script on the server, and a visualization server is executed. This invokes IRIS Explorer, using its scripting language (Skm) to define an appropriate pipeline. The output of the pipeline is a VRML file, which the visualization server returns to the browser for viewing.
to gain access to the data saved by the earlier user. They can use this as a starting point for their own study of the data: they can add their own textual comment on the visualization, or they may choose to change some of the defining parameters, creating a new visualization. If this new visualization is of interest, its defining parameters may be saved for later use by other collaborators. This sequence of stored definitions effectively forms a tree of exploratory visualizations, built over a period of time by the collaborators. Note that this approach can even be used by a group working in the same place, and so it could also be placed in the same-place, different-time quadrant of the Applegate matrix. As mentioned earlier, more recent examples of server-side web-based visualization tend to use Java applets to provide a more flexible GUI than the forms interface used by Wood and colleagues. In the Vis-a-Web system, Pagendarm and Trapp [TP97, Pag99] provide an applet front-end to allow users to access the HighEnd visualization system running on a server; a novel feature is the fact that software from different sources can be used to make a single visualization— VRML files from different sources can be combined before transfer to the browser. Lefer [Lef98] builds a web-based system using VTK (see Section 6.1.13) as underlying software. Treinish [Opec], in a paper on visualization design for operational weather forecasting, describes how OpenDX (see Section 6.1.9) can be used in a Web environment. He envisages partitioning OpenDX into a client-server system, with a Java-based applet on the client interacting with OpenDX on a server. Finally, Walton [Wal97] envisaged the publication of visualizations as VRML scenes in which the visualization algorithm, containing instructions for modifying the geometry, is directly incorporated into the scene as a scripting node.
A demonstrator [Air] was created to view air quality information in the UK. The data is collected on an hourly basis at a number of locations throughout the UK, and the Atomic Energy Authority (AEA) publish the data on a Web site. The demonstrator allows a user to select the time and location of data, and the pollutant to be analysed. The approach can in principle be extended to the presentation of many different types of public service information—such as road traffic data and weather forecast details.
An important thread of activity was sparked by the work of Hendin et al. [HJS97]. They describe a web-based approach to volume rendering which exploits 2D texture mapping hardware. On the server, three stacks of rectangular faces are constructed, each stack orthogonal to one of the co-ordinate axes. These are stored as a VRML scenegraph. On the client-side, the current viewpoint is used to select the ‘most orthogonal’ stack and this is rendered using texture hardware.
Wood [WWB97] also extended his system to allow a number of collaborators to investigate data over a period of time, giving a form of asynchronous collaboration. It works as follows. A first user creates a visualization using the form front-end to the IRIS Explorer system running on the server. If an interesting visualization results, they may choose to store the parameters which defined that visualization. Note that these parameters completely define the visualization, and of course require much less storage than saving, for example, the VRML output.
This work has been developed further in a series of papers by the graphics group at Erlangen. Engel and Ertl [EE99] improve the clipping operation, and introduce a collaborative aspect. The server keeps a record of participating users, and allows the broadcast of viewpoint, clipping region or transfer function from one user to the other collaborators. In later work, Engel et al. [EHT∗ 00] describe an approach which uses 3D texture hardware on a remote server, transmitting the resulting images to the client for display within an applet.
Other users in the collaboration can fetch the HTML page
Engel et al. [EWE99] have studied isosurface extraction
c The Eurographics Association and Blackwell Publishing 2004. �
K.W. Brodlie et al. / Distributed and Collaborative Visualization
as a server-based application. The creation of the surface using a Marching Cubes algorithm is carried out on the server, and the resulting polygonal data structure is streamed to the client. They study two variants: one in which VRML is used, the other in which an OpenGL ‘immediate rendering’ approach is used. The OpenGL approach is substantially faster, for a large number of triangles. Another Webbased isosurface service for medical data is described by Kim et al [KLK∗ 98]. A key aspect of this work is decimation applied to the polygonal mesh before transmission back as VRML to the client. A Visible Human Web Service is offered by EPFL, Switzerland [HGF∗ 00, Visf]. This uses a Java applet frontend to select the slice of interest through the Visible Human (this can be at any orientation, and at any position); the request is passed to a server process which extracts the relevant slice and returns to the applet for display. Finally an extreme case of this approach occurs when the visualization requires a very substantial compute time. Iserhardt-Bauer et al. [IBHE∗ 01] describe a medical Web service for neuroradiological diagnosis. The request for a visualization in the form of a video is placed via a web interface; an automatic process then segments the data, renders a sequence of frames following a suitable camera path, and creates a video; finally an e-mail is sent to the user informing them that the video is ready, and telling them the URL from which it may be downloaded. 6.4.2. Software Delivery In the ‘Full service’ examples above, the use of Java applets is essentially limited to the provision of a good user interface, and the actual visualization process is handled remotely by a server. However there is an important group of examples where the Java applet carries out the visualization itself, as well as providing the user interface. An early example is described by Michaels and Bailey [MB97]. VizWiz is a Java applet which creates isosurface, cutting plane or elevation grid visualizations, from data supplied by the user. A difficulty with this general approach is that the data must be held locally on the server which delivers the applet, for security reasons. This is not ideal! It is likely that the data will either be held locally by the user on the client, or in the case of shared public data, at some URL (not necessarily where the applet is). Michaels and Bailey solve the problem for local data by using the Netscape file upload option, which transfers a local file to the server. A major snag is that the data is transferred to the server and back again, just to circumvent security restrictions! An alternative solution has been proposed by Kee [Kee96] and Stanton [Sta97], allowing data from any URL. The data are fetched temporarily to the server by a Java application (distinct from the visualization applet) which executes on the server and, being an application, is not subject to the secu-
rity restrictions of applets. However, again there is large data transfer involved. Another example of this approach is given by Wegenkittl and Groeller, in their FROLIC [WG97] system. This creates visualizations of dynamical systems, using a variant of Line Integral Convolution and other methods. The systems are defined analytically, and so there is no problem with uploading data. There are two fundamental limitations to this approach: first, the user is limited by the power of their desktop machine; second, the upload of data seems against the spirit of Java applets. However neither of these limitations apply in applets which are aimed at teaching or demonstration: here the examples can be simple and need not be computationally demanding, and the data can be provided from the server, as part of the demonstration. Many excellent examples of visualization applets for teaching can be found on the web: for instance, Falstad [Fal] has some applets for maths and physics teaching; the Vestac project [Ves] has some statistics applets. In terms of the design and core software distinction introduced in Section 2, one can view the applet as the design and the Java Virtual Machine as the core software. If we follow this idea through to MVEs, we get a similar idea where the design—that is, the description of the dataflow pipeline— is supplied by the visualization service provider, while the core software—that is, the MVE operating environment and module code—is the responsibility of the user. Thus one can see the MVE as an empty workspace into which a visualization program, that is, a specific pipeline of modules, can be transferred across the Web. Thus a set of ‘example’, or ‘demonstration’ pipelines can be held on a server, and associated with a particular MIME type; on being fetched by the browser, the pipeline can be automatically loaded into the empty workspace as the application is launched. This has significant potential for education and training, and was prototyped by Yeo [Yeo98] using IRIS Explorer as the MVE. The pipeline of modules is then available for use in the normal manner by the user. An interesting variation would use the distributed computing capability of MVEs, where modules can run remotely—allowing the visualization service provider to at least share some of the responsibility for execution. 6.4.3. Local operation Although we describe the local operation classification last, historically it was the original approach. The first instance we are aware of is the system described by Ang et al. [AMD94]. Their work focussed on volume visualization, and they defined the MIME-type ‘hdf/volume’ to identify volumetric data in the NCSA Hierarchical Data Format (HDF) representation. On receiving a file of this MIMEtype, they were able to invoke the inter-client communicac The Eurographics Association and Blackwell Publishing 2004. �
K.W. Brodlie et al. / Distributed and Collaborative Visualization
tion facilities of the Mosaic browser, to fire up the user interface of their volume visualization system, VIS. Another early example of this is the Web version of Vis5D (now evolving as Vis-5D+ [Visb]). Vis-5D data files retrieved over the web can be set to launch the Vis-5D application on the client. The original Vis-5D web pages [Visa] give examples of its use in this way, for instance to provide daily weather forecast visualizations from data delivered by the US National Weather Service. This is the most limited of the three approaches and is probably mainly of interest now for historical reasons. Most MVEs will allow data to be read in from a URL directly, and so this functionality becomes available in a different way. 7. Conclusion As networks become more pervasive and collaboration becomes more and more important in many areas of life, it is natural to ask what computing can contribute. In many areas of science and engineering and increasingly in other areas too, visualization plays a key mediating role in communications between humans. As the area of distributed and collaborative visualization matures, we are seeing research ideas being translated into products in the market place. For example, the COVISA extension of IRIS Explorer is now an integral part of the commercial release. The usage of these systems in the field is likely to stimulate a further round of research, as strengths and weaknesses emerge. We may also look forward to a future where the providers of automated visualization services start to exploit the service-oriented architectures described in this review. We can expect them to harness web service and Grid service technologies, in order to deliver visualization to the desktop of the scientist, the engineer, or the clinician—indeed the market must be very large. We have attempted in this paper to give a review of approaches to supporting the use of visualization in collaborative situations, through what we have termed distributed and collaborative visualization. We have examined approaches based on a service-oriented model, looking at both MVEs and web-based approaches. This is a field in which we may expect to see continued growth over the coming years, as Grid computing becomes more pervasive and as high quality networking becomes more available and more affordable. Recent research in Grid-based visualization has just been published in a special issue of IEEE Computer Graphics and Applications [SB03]. It is interesting to note that a distributed and collaborative approach was used in the preparation of this paper by the five authors. The text was developed individually, but with regular review meetings to discuss, critique and re-organize, held using Access Grid nodes at Leeds, RAL and Oxford: the same time, different place quadrant of the Applegate matrix. c The Eurographics Association and Blackwell Publishing 2004. �
Acknowledgements DAD and JRG gratefully acknowledge fruitful discussions with colleagues at the University of Lancaster in the Visual Beans project and colleagues in the gViz project. KWB and JDW likewise thank all those who have contributed to our understanding of the subject—notably Helen Wright (now at the University of Hull) and many students at the University of Leeds. JPRBW thanks Bob Haimes for helpful discussions. We appreciate funding from EPSRC, in particular recent funding from the e-Science Core Programme towards the gViz project.
References [Acc]
ACCESS G RID WEBSITE:. http:// www.accessgrid.org. 12
[ACE]
F RAMEWORK:. ACE N ETWORKING http://www.cs.wustl.edu/ ~schmidt/ACE.html. 20
[ACK∗ 03] ATKINSON M., C HERVENAK A., K UNSZT P., NARANG I., PATON N. W., P EARSON D., S HOSHANI A., WATSON P.: Database Access Integration and Management. In The Grid: Blueprint for a new computing infrastructure (2003), Foster I., (Ed.), Morgan Kaufmann. 11 [Air]
A IR QUALITY DATA:. http:// www.visualization.leeds.ac.uk/. 21
[AMD94]
A NG C. S., M ARTIN D. C., D OYLE M. D.: Integrated Control of Distributed Volume Visualization Through the World Wide Web. In Proceedings of IEEE Visualization ’94 (1994), Bergeron D., Kaufman A. E., (Eds.), IEEE Computer Society Press. 22
[Amia]
A MIRA:. http://www.amiravis.com/. 13
[Amib]
AND SIMULATION OUTPUT :. A MIRA http://www.amiravis.com/ usersguide30/faq.html#A193. 13
[App91]
A PPLEGATE L. M.: Technology Support for Cooperative Work: A Framework for Studying Introduction and Assimilation in Organizations. Journal Organizational Computing 1 (1991), 11–39. 3
[AT95]
A BRAM G., T REINISH L.: An Extended Dataflow Architecture for Data Analysis and Visualization. Computer Graphics 29, 2 (1995), 17–21. 2
[AVSa]
AVS5:. http://help.avs.com/AVS5/. 13
K.W. Brodlie et al. / Distributed and Collaborative Visualization
[AVSb]
AVS/E XPRESS:. http://www.avs.com/ software/soft_t/avsxps.html. 13
[cAV]
C AVS PROJECT WEBSITE :. http:// www.tacc.utexas.edu/cavs/. 14
[Ber93]
B ERGERON D.: Visualization Reference Models (panel session position statement). In Proceedings of IEEE Visualization ’93 (1993), Nielson G. M., Bergeron D., (Eds.), IEEE Computer Society Press. 6
[CH93a]
C ARLSSON C., H AGSAND O.: DIVE–A Multi User Virtual Reality System. In Proceedings of VRAIS ’93 (September 1993), IEEE Computer Society Press. 12
[CH93b]
[BGW99]
B OYD D. R. S., G ALLOP J. R., WALTON J. P. R. B.: Putting You In The Picture: Enhancing Visualization With A Virtual Environment. In IEEE Visualization ’99—Late Breaking Hot Topics (1999). Available from http://www.nag.co.uk/doc/ TechRep/PDF/tr1_03.pdf. 13
DIVE–A C ARLSSON C., H AGSAND O.: Platform for Multi-User Virtual Environments. Computers and Graphics 17, 6 (1993), 663– 669. 12
[Chra]
C HROMIUM AND M ULTICASTING:. http:// www-unix.mcs.anl.gov/~jones/ Chromium/flxspu.htm. 20
[Chrb]
C HROMIUM SOURCE:. http:// sourceforge.net/projects/ chromium/. 18
[cli]
CLIMATE prediction. NET WEBSITE :. http:// climateprediction.net/. 19
[Clu]
C LUSTER R ENDERING U TILITY T OOLKIT:. http://graphics.stanford.edu/ ~mhouston/VisWorkshop03/ Dale.html. 18
[BHI93]
[BIJH00]
[Bro00]
[BS03]
[BW00]
B LY S. A., H ARRISON S. R., I RWIN S.: MediaSpaces: Bringing People Together in a Video, Audio and Computing Environment. Communications of the ACM 36, 1 (1993), 28–47. 4 B REDERSON J., I KITS M., J OHNSON C. R., H ANSEN C. D.: The Visual Haptic Workbench. In The Fifth PHANToM Users Group Workshop (PUG 00) (2000), pp. 46–49. 13 B RODLIE K. W.: Visualization over the World Wide Web. In Proceedings of the 1997 Scientific Visualization Conference (Dagstuhl ’97) (2000), IEEE Computer Society Press, pp. 23– 29. 20 B ETHEL E. W., S HALF J.: Grid-Distributed Visualizations Using Connectionless Protocols. IEEE Computer Graphics and Applications 23, 2 (March/April 2003), 51–59. 11 B ISHOP G., W ELCH G.: Working in the Office of ‘Real Soon Now’. IEEE Computer Graphics and Applications 20, 4 (July/August 2000), 76– 78. 12
[BWB∗ 02] B RODLIE K. W., W OOD J. D., B OYD D. R. S., S ASTRY L., G ALLOP J. R., CollaboO SLAND C., B UNN S. E.: rative Visualisation Using Access Grid. http://www.comp.leeds.ac.uk/kwb/ all_hands/BOF.pdf, 2002. 12, 17 [BWD∗ 02] B RODLIE K. W., W OOD J. D., D UCE D. A., G ALLOP J. R., G AVAGHAN D., G ILES M., H AGUE S. J., WALTON J. P. R. B., RUDG YARD M., C OLLINS B., I BBOTSON J., K NOX A.: XML for Visualization. In Proceedings of the EuroWeb 2002 conference (2002), British Computer Society, Electronic Workshops in Computing(eWiC). 11 [Cac]
C ACTUS PROJECT WEBSITE:. http:// www.cactuscode.org/. 11, 14
[CNSD93] C RUZ -N EIRA C., S ANDIN D. J., D E FANTI T. A.: Surrond-Screen Projection-Based Virtual Reality: The Design and Implementation of the CAVE. In Computer Graphics Proceedings, Annual Conference Series, 1993 (1993), ACM Press, pp. 135–142. 12 [COVa]
COVISE:. http://www.hlrs.de/ structure/organisation/vis/ covise/. 13
[COVb]
COVISE AND VR:. http:// www.hlrs.de/structure/ organisation/vis/covise/ features/cover/. 13
[DGC∗ 98] D UCE D. A., G IORGETTI D., C OOPER C. S., G ALLOP J. R., J OHNSON I. J., ROBINSON K., S EELIG C. D.: Reference Models for Distributed Cooperative Visualization. Computer Graphics Forum 17, 4 (1998), 219–233. 8 [DGJ∗ 98]
D UCE D. A., G ALLOP J. R., J OHNSON I. J., ROBINSON K., S EELIG C. D., C OOPER C. S.: Distributed Cooperative Visualization— The MANICORAL Approach. In Eurographics UK Chapter Conference 1998 (1998), University of Leeds. 10, 14
[DIV]
DIVE:. http://www.sics.se/dce/ dive/online/diveinfo.html. 12
[dMPJ00]
DE
S T. G ERMAIN D., M C C ORQUODALE J., c The Eurographics Association and Blackwell Publishing 2004. �
K.W. Brodlie et al. / Distributed and Collaborative Visualization
PARKER S., J OHNSON C. R.: Uintah: A Massively Parallel Problem Solving Environment. In Ninth IEEE International Symposium on High Performance and Distributed Computing (2000). 16 [Dye90]
DYER D.: A dataflow toolkit for visualization. IEEE Computer Graphics and Applications 10 (1990), 60–69. 2
[EE99]
E NGEL K., E RTL T.: Texture-based Volume Visualization for Multiple Users on the World Wide Web. In Virtual Environments ’99. Proceedings of the Eurographics Workshop in Vienna, Austria (1999), Gervaut M., Schmalstieg D.„ Hildebrand A., (Eds.), pp. 115–124. 21
[EHT∗ 00] E NGEL K., H ASTREITER P., T OMANDI B., E BERHARDT K., E RTL T.: Medical Volume Rendering over the WWW. In Proceedings of IEEE Visualization 2000 (2000), Ertl T., Hamann B.„ Varshney A., (Eds.), IEEE Computer Society, pp. 449–452. 21 [Ensa]
E NSIGHT:. 14
[Ensb]
E NSIGHT G OLD:. http:// www.ceintl.com/products/ collab.html. 14
[EWE99]
E NGEL K., W ESTERMANN R., E RTL T.: Isosurface Extraction Techniques for Web-based Volume Visualization. In Proceedings of IEEE Visualization ’99 (1999), Ebert D., Gross M.„ Hamann B., (Eds.), IEEE Computer Society, pp. 139–146. 21
http://www.ceintl.com/.
[Fal]
FALSTAD:. http://www.falstad.com/ mathphysics.html. 22
[FASa]
FAST:. http://www.nas.nasa.gov/ Software/FAST/. 18
[FASb]
FAST EXPEDITIONS WEBSITE:. http:// www.nas.nasa.gov/Software/FAST/ FASTexpeditions/home.html. 18
[FKNT]
F OSTER I., K ESSELMAN C., N ICK J., T UECKE S.: The Physiology of the Grid: An Open Grid Services Architecture for Distributed Systems Integration. In Open Grid Service Infrastructure WG, Global Grid Forum, June 22, 2002. Available at http://www.globus.org/research/ papers/ogsa.pdf. 20
[FL00]
F UNKHOUSER T., L I K.: Large-format displays. IEEE Computer Graphics and Applications 20, 4 (July/August 2000), 20–21. 12
[Fos03]
F OSTER I.:
The Grid: Computing Without
c The Eurographics Association and Blackwell Publishing 2004. �
Bounds. Scientific American April (2003), 62 – 67. 2 [Fou95]
F OULSER D.: IRIS Explorer: A Framework for Investigation. Computer Graphics 29, 2 (1995), 13–16. 2, 15
[Fuc97]
F UCHS H.: Building Telepresence Systems: Translating Science Fiction Ideas into Reality. Computer Graphics Forum 16, 3 (1997), C– 189. 3
[Gal96]
G ALLOP J. R.: Virtual Reality–Its Application to Scientific Visualization. Eurographics Tutorial Notes, EG96 TN3. Eurographics Association, 1996. ISSN 1017-4656. 12
[GAP]
GAP TK PROJECT WEBSITE:. http:// www.e-science.clrc.ac.uk/web/ projects/gaptk. 19
[GHR95]
G REENBERG S., H AYNE S., R ADA R.: Groupware for Real-time Drawing: A Designer’s Guide. McGraw-Hill, 1995. 1
[Gloa]
G LOBAL G RID F ORUM WEBSITE:. http:// www.gridforum.org/. 18
[Glob]
G LOBUS:. 14, 19
[GOD]
GODIVA PROJECT WEBSITE:. http:// www.e-science.clrc.ac.uk/web/ projects/godiva. 19
[gpw]
G V IZ PROJECT WEBSITE :. http:// www.visualization.leeds.ac.uk/ gViz/. 12, 19
[gSo]
G S OAP :. http://www.cs.fsu.edu/ ~engelen/soap.html. 18
[HD01]
H ERMAN I., D UKE D.: Minimal Graphics. IEEE Computer Graphics and Applications 21, 6 (November/December 2001), 18–21. 12
[HDP92]
H IBBARD W., DYER C. R., PAUL B. E.: Display of Scientific Data Structures for Algorithm Visualization. In Proceedings of Visualization ’92 (1992), Kaufman A. E., Neilson G. M., (Eds.), IEEE Computer Society Press, pp. 139– 146. 16
http://www.globus.org/.
[HGF∗ 00] H ERSCH R. D., G ENNART B., F IGUEIREDO O., M AZZARIOL M., TARRAGA J., V ETSCH S., M ESSERLI V., W ELZ R., B IDAUT L.: The Visible Human Slice Web Server: a First Assessment. In Proceedings of IS and T/SPIE Conference on Internet Imaging, SPIE Vol 3964 (2000), pp. 253–258. 22 [HHN∗ 02] H UMPHREYS G., H OUSTON M., N G R., F RANK R., A HERN S., K IRCHNER P.,
K.W. Brodlie et al. / Distributed and Collaborative Visualization
K LOSOWSKI J. T.: Chromium: A Stream Processing Framework for Interactive Rendering on Clusters. ACM Transactions On Graphics 21, 3 (2002), 693–702. 18 [HJS97]
[HLP96]
[HM90]
H ENDIN O., J OHN N., S HOCHET O.: Medical Volume Rendering Over the WWW. In Proceedings of Medicine Meets Virtual Reality 1997 (1997), Westwood J., (Ed.), IOS Press. 21 H OLLINGSWORTH J., L IU K., PAUCA P.: Parallel Toolbox for MATLAB. Tech. rep., Wake Forest University, 1996. 15 H ABER R. B., M C NABB D. A.: Visualization Idioms: A Conceptual Model for Scientific Visualization Systems. In Visualization In Scientific Computing (1990), Shriver B., Neilson G. M.„ Rosenblum L. J., (Eds.), IEEE Computer Society Press, pp. 74–93. 4, 17
[IBHE∗ 01] I SERHARDT-BAUER S., H ASTREITER P., E RTL T., E BERHARDT K., T OMANDL B.: Case study: Medical web service for the automatic 3d documentation for neuroradiological diagnosis. In Proceedings of IEEE Visualization 2001 (2001), IEEE, pp. 425–428. 22
and Computation: Practice and Experience, 14 (2002), 1337–1349. 16 [JWA]
JWAVE:. http://www.vni.com/ products/wpd/jwave/. 15
[JXT]
JXTA WEBSITE:. http://www.jxta.org. 18
[Kee96]
K EE A.: Visualization over WWW Using Java. Master’s thesis, School of Computer Studies, University of Leeds, U.K., 1996. 22
[KLK∗ 98] K IM N., L EE D., K IM J., K IM Y., C HO H.: Web based 3D medical image visualization on a PC. In Medinfo : Proceedings of the Ninth World Congress on Medical Informatics (1998), vol. 9, IOS Press, pp. 1105–1110. 22 [KSND03] KONG G., S TANTON J., N EWHOUSE S., DAR LINGTON J.: Collaborative Visualisation over the AccessGrid using the ICENI Grid Middleware. In preparation. 20 [Lef98]
L EFER W.: A Distributed Architecture for a Web-based Visualization Service. In Proceedings of the Eurographics Workshop on Visualization in Scientific Computing (1998), Eurographics Association. 21
[ICEa]
ICENI AND R EALITY G RID:. http:// www.lesc.ic.ac.uk/projects/ reality.html. 20
[Lia97]
L IAO T.: WebCanal: a Multicast Web Application. In Proceedings of the Sixth International World Wide Web Conference (1997). 3
[ICEb]
ICENI PROJECT WEBSITE:. http:// www.lesc.ic.ac.uk/iceni/ index.html. 20
[Lor95]
L ORD H. D.: Improving the Application Development Process with Modular Visualization Environments. Computer Graphics 29, 2 (1995), 10–12. 2
[IDL]
IDL:. 15
[MAT]
[inS]
IN SORS:. 12
MATLAB WEBSITE:. http:// www.mathworks.com/products/ matlab/. 15
[May97]
M AYER T.: New Options and Considerations for Creating Enhanced Viewing Experiences. Computer Graphics 31, 2 (1997), 32–37. 12
[MB97]
M ICHAELS C., BAILEY M. J.: VizWiz: A Java Applet for Interactive 3D Scientific Visualization Over the Web. In Proceedings of IEEE Visualization ’97 (1997), Yagel R., Hagen H., (Eds.), IEEE Computer Society Press, pp. 261– 268. 22
[MDB87]
M C C ORMICK B. H., D E FANTI T. A., B ROWN M. D.: Visualization in Scientific Computing. Computer Graphics 21, 6 (1987). 2
[MJ03]
M C C LOY R. F., J OHN N. W.: Remote Visualization of Patient Data in the Operating Theatre during Helpato-pancreatic Surgery. In CARS 2003 Computer Assisted Radiology and Surgery, London, UK (2003). 18
http://www.rsinc.com/idl/. http://www.insors.com/.
[JGKR96] JACOBS S., G EBHARDT M., K ETHERS S., R ZASA W.: Filling HTML Forms Simultaneously: CoWeb–Architecture and Functionality. Computer Networks and ISDN Systems 28, 711 (1996), 1385–1395. 3 [Joh98]
J OHNSON G.: Collaborative Visualization 101. Computer Graphics 32, 2 (1998), 8–11. 14
[Joh03]
J OHN N. W.: High Performance Visualization in a Hospital Operating Theatre. In Theory and Practice of Computer Graphics (TPCG03) (2003), IEEE Computer Society Press, pp. 170– 175. 18
[JPWH02] J OHNSON C., PARKER S., W EINSTEIN D., H EFFERNAN S.: Component-Based Problem Solving Environments for Large-Scale Scientific Computing. Journal on Concurrency
c The Eurographics Association and Blackwell Publishing 2004. �
K.W. Brodlie et al. / Distributed and Collaborative Visualization
[MSN]
MSN M ESSENGER WEBSITE:. http:// messenger.microsoft.com. 17
[MVS∗ 02] M ORTENSEN J., V INAYAGAMOORTHY V., S LATER M., S TEED A., L OK B., W HITTON M. C.: Collaboration in Tele-Immersive Environments. In Eighth Eurographics Workshop on Virtual Environments (May 2002), pp. 93–101. 12 [.NE]
.NET:. http://www.microsoft.com/ net/. 18
[OPea]
OP E NDAP WEBSITE:. http:// www.opendap.org/. 7
[Opeb]
O PEN DX:. 2, 15, 16
[Opec]
WEATHER APPLICATIONS :. O PEN DX http://www.research.ibm.com/ weather/vis/w_vis.htm. 16, 21
PAGENDARM H.-G.: Visualization Within Environments Supporting Human Communication. Future Generation Computer Systems 15 (1999), 109–117. 21
[PJ95]
PARKER S. G., J OHNSON C. R.: SCIRun: A scientific programming environment for computational steering. In Proceedings of Supercomputer ’95 (New York, 1995), Meuer H. W., (Ed.), Springer-Verlag. 16
[PMSS97] PARNES P., M ATTSSON M., S YNNES K., S CHEFSTROM D.: The mWeb Presentation Framework. In Proceedings of the Sixth International World Wide Web Conference (1997). 3 PANG A., S MITH K.: Spray Rendering: Visualization Using Smart Particles. In Proceedings of IEEE Visualization ’93 (1993), Nielson G. M., Bergeron D., (Eds.), IEEE Computer Society press, pp. 302–309. 18
[PV-]
PV-WAVE:. http://www.vni.com/ products/wave/. 15
[pV3]
P V3:.
http://raphael.mit.edu/ pV3/pV3.html. 16
[PW97]
PANG A. T., W ITTENBRINK C. M.: Collaborative 3D Visualization with CSpray. IEEE Computer Graphics and Applications 17, 2 (1997), 32–41. 10
[PWG95]
PANG A., W ITTENBRINK C. K., G OODMAN T.: CSpray: A Collaborative Scientific Visualization Application. In Proceedings of Multimedia Computing and Networking (1995). 18
[Reaa]
R EALVNC:. http://www.realvnc.com. 17
[SACP03] S TEED A., A LEXANDER D., C OOK P., PARKER C.: Visualizing Diffusion-Weighted MRI Data Using Collaborative Virtual Environment and Grid Technologies. In Theory and Practice of Computer Graphics (TPCG03) (2003), IEEE Computer Society Press, pp. 156– 161. 13 [SB03]
S HALF J., B ETHEL E. W.: The Grid and Future Visualization System Architectures. IEEE Computer Graphics and Applications 23, 2 (March/April 2003), 6–9. 2, 23
[SCI]
SCIRUN AND VNC:. http:// web.gat.com/pubs-ext/ MISCONF02/A23983.pdf. 16
[SFW04]
S TAINFORTH D. A., F RAME D., WALTON J. P. R. B.: Visualization For Public-Resource Climate Modeling. In Joint Eurographics - IEEE TCVG Symposium on Visualization (2004), Deussen O., Hansen C., Keim D. A.„ Saupe D., (Eds.). To appear. 19
[Sgo03]
S GOUROS T.: DODS User Guide, Version 1.11. University of Rhode Island, Graduate School of Oceanography, 2003. Available at http://www.unidata.ucar.edu/ packages/dods/. 7
[SME02]
S TEGMAIER S., M AGALLON M., E RTL T.: A Generic Solution for Hardware-Accelerated Remote Visualization. In Joint EUROGRAPHICSIEEE TCVG Symposium on Visualization (2002) (2002), Ebert D., Brunet P.„ Navazo I., (Eds.), Eurographics, pp. 87–94. 12, 17
[SML03]
S CHROEDER W. J., M ARTIN K. M., L ORENSEN W. E.: The Visualization Toolkit: An Object Oriented Approach to 3D Graphics, 3rd ed. Kitware, Inc., 2003. 17
[SND02]
S TANTON J., N EWHOUSE S., DARLINGTON J.: Implementing a Scientific Visualisation Capability Within a Grid Enabled Component Framework. In Proceedings of 8th International Euro-Par Conference, volume 2400 of Lecture Notes in Computer Science, Paderborn, Germany (2002). Available at http://www.lesc.ic.ac.uk/iceni/ pdf/europar2002.pdf. 20
[SOA]
SOAP:. http://www.w3.org/TR/SOAP/. 19
[Spa]
S PACE P HYSICS AND A STRONONY R E SEARCH C OLLABORATORY WEBSITE :.
http://www.opendx.org/.
[Pag99]
[PS93]
[Reab]
R EALITY G RID PROJECT:. http:// www.realitygrid.org. 12, 20
c The Eurographics Association and Blackwell Publishing 2004. �
K.W. Brodlie et al. / Distributed and Collaborative Visualization
http://intel.si.umich.edu/ sparc/. 8 [Sta97]
S TANTON P.: Java Visualization Software. Final year project, School of Computer Studies, University of Leeds, U.K., 1997. 22
[Stu]
S TUDIERSTUBE WEBSITE:. http:// www.cg.tuwien.ac.at/research/vr/ studierstube/AVS/html/. 13
[SW97]
S COTT A., W OLF H.: Collaborative Browsing in the World Wide Web. In Proceedings of the 8th Joint European Networking Conference (1997). 3
[Tig]
T IGHT VNC:. http://www.tightvnc.com. 17
[TLM∗ 02] T HORSON M., L EIGH J., M AAJID G., PARK K., NAYAK A., S ALVA P., B ERRY S.: AccessGrid-to-Go: Providing AccessGrid access on Personal Digital Assistants. In Proceedings of the Access Grid Retreat, 2002 (2002), Available at http://www.evl.uic.edu/paper/pdf/ AG2GoFinal2002.PDF. 12 [TMC∗ 96] T REFETHEN A. E., M ENON V. S., C HANG C.-C., C ZAJKOWSKI G. J., M YERS C., T RE FETHEN L. N.: MultiMATLAB: MATLAB on Multiple Processors. Tech. Rep. CTC96TR293, Cornell Theory Center, 1996. Available at http://www.cs.cornell.edu/Info/ People/lnt/multimatlab.html. 15
[UK ]
UK E -S CIENCE WEBSITE:. http:// www.escience-grid.org.uk/ index.htm. 18
[Use02]
U SELTON S. P.: Case study: The ‘Office of Real Soon Now’ for Visualization. In Proceedings of Visualization 2002 (2002), Pfister H., Bailey M., (Eds.), IEEE Computer Society Press. 12
[Usi]
U SING V IZSERVER FOR REMOTE MEDICAL VISUALIZATION :. http://www.sgi.com/ features/2002/sep/manchester/. 18
[vDLS02]
VAN DAM A., L AIDLAW D., S IMPSON R.: Experiments with Immersive Virtual Reality for Scientific Visualization. Computers and Graphics 26, 4 (2002), 535–555. 3, 12
[vEGP03]
VAN E NGELEN R., G UPTA G., PANT S.: Developing Web Services for C and C++. IEEE Internet Computing 7, 3 (2003), 53–61. 18
[Ves]
V ESTAC PROJECT WEBSITE:. http:// www.kuleuven.ac.be/ucs/java/. 22
[Vir]
V IRCINITY COMPANY WEBSITE:. http:// www.vircinity.com/. 14
[Visa]
V IS -5D:. http://www.ssec.wisc.edu/ ~billh/view5d.html. 23
[Visb]
V IS 5 D SOURCE:. http:// vis5d.sourceforge.net/. 23
[Visc]
V IS AD:. http://www.ssec.wisc.edu/ ~billh/visad.html. 17
[Tom]
T OMCAT WEBSITE:. http:// jakarta.apache.org/tomcat/ index.html. 18
[Visd]
V IS AD COLLABORATIONS:. http:// www.ssec.wisc.edu/~dglo/ visad-collab/. 17
[TP97]
T RAPP J., PAGENDARM H.-G.: A prototype for a WWW-based visualization service. In Visualization in Scientific Computing ’97 (1997), Lefer W., Grave M., (Eds.), Springer, Wien, pp. 21–30. 21
[Vise]
V IS AD EVENTS:. http:// www.ssec.wisc.edu/~dglo/ visad-events/. 17
[Visf]
H UMAN VISUALIZATION :. V ISIBLE http://visiblehuman.epfl.ch. 22
[Visg]
V ISTA P ORTAL WEBSITE:. http:// www.vistaportal.com. 18
[Vish]
V ISUAL B EANS WEBSITE:. http:// www.acu.rl.ac.uk/VisualBeans/. 20
[Visi]
V ISUAL 3:. http://raphael.mit.edu/ visual3/visual3.html. 16
[VIV]
VIVRE WEBSITE:. http:// www.tessella.co.uk/projects/ vivre/index.htm. 13
[TSP02]
TAYLOR I., S HIELDS M., P HILP R.: GridOneD: Peer to Peer visualization using Triana: A Galaxy Formation Test Case. In Proceedings of UK e-Science All Hands Meeting, September 2002 (2002). 18
[UFK∗ 89] U PSON C., FAULHABER T., K AMINS D., S CHLEGEL D., L AIDLAW D., V ROOM J., G URWITZ R., VAN DAM A.: The Application Visualization System: a Computational Environment for Scientific Visualization. IEEE Computer Graphics and Applications 9, 4 (1989), 30–42. 2, 4, 14
c The Eurographics Association and Blackwell Publishing 2004. �
K.W. Brodlie et al. / Distributed and Collaborative Visualization
[Viz]
V IZSERVER:. http://www.sgi.com/ software/vizserver/. 17
[VTKa]
VTK:. http://public.kitware.com/ VTK/. 17
[VTKb]
VTK—M ULTI - PIPE RENDERING:. http:// brighton.ncsa.uiuc.edu/ ~prajlich/vtkActorToPF/. 17
[WK97]
WALTON J. P. R. B., K NIGHT D.: Rock ‘n’ Roll: Using VRML2.0 for Visualization. IRIS Explorer Technical Report TR27 IETR (NP3159), NAG Ltd, 1997. Available from http://www.nag.co.uk/doc/ TechRep/HTML/tr2_97.html. 6
[WLR93]
W IERSE A., L ANG U., RÜHLE R.: Architectures of Distributed Visualization Systems and their Enhancements. Presented at 4th Eurographics Workshop on Visualization in Scientific Computing, Abingdon, U.K., 1993. 14
[VTKc]
VTK AND CAVE S:. http:// www.evl.uic.edu/cavern/ cavernpapers/viz98/. 17
[Wal93]
WALTON J. P. R. B.: Get The Picture–New Directions In Data Visualization. In Animation And Scientific Visualization: Tools & Applications (1993), Earnshaw R. A., Watson D., (Eds.), Academic Press, pp. 29–36. 15
[Woo98]
W OOD J. D.: Collaborative Visualization. PhD thesis, School of Computer Studies, University of Leeds, U.K., 1998. 10
[WSO]
WSO:. http://www.webservices.org/. 18
[Wal97]
WALTON J. P. R. B.: World Processing: Data Sharing with VRML. In The Internet in 3D: Information, Images and Interaction (1997), Earnshaw R. A., Vince J. A., (Eds.), Academic Press. 21
[WWB97] W OOD J. D., W RIGHT H., B RODLIE K. W.: Collaborative Visualization. In Proceedings of IEEE Visualization ’97 (1997), Yagel R., Hagen H., (Eds.), pp. 253–259. 4, 8, 10, 15, 21
[Walss]
NAG’s IRIS ExWALTON J. P. R. B.: plorer. In Visualization Handbook (2004, in press), Johnson C. R., Hansen C. D., (Eds.), Academic Press. Available from http://www.nag.co.uk/doc/ TechRep/Pdf/tr2_03.pdf. 2, 15
[WBW96] W OOD J. D., B RODLIE K. W., W RIGHT H.: Visualization Over The World Wide Web and its Application to Environmental Data. In Proceedings of IEEE Visualization ’96 (1996), Yagel R., Nielson G. M., (Eds.), IEEE Computer Society Press, pp. 81–86. 21 [Web]
W EB S PHERE:. http://www-3.ibm.com/ software/info1/websphere/ index.jsp. 18
[Wer94]
W ERNECKE J.: The Inventor Mentor. Programming Object-Oriented Graphics with Open Inventor, Release 2. Addison-Wesley, 1994. 13, 19
[WFR∗ 00] W ELCH G., F UCHS H., R ASKAR R., T OWLES H., B ROWN M. S.: Projected Imagery in your ‘Office of the Future’. IEEE Computer Graphics and Applications 20, 4 (July/August 2000), 62–67. 12 [WG97]
W EGGENKITTL R., G ROELLER E.: Fast Oriented Line Integral Convolution for Vector Field Visualization via the Internet. In Proceedings of IEEE Visualization ’97 (1997), Yagel R., Hagen H., (Eds.), IEEE Computer Society Press, pp. 309–316. 22
c The Eurographics Association and Blackwell Publishing 2004. �
[YAW95]
YOUNG M., A RGIRO D., W ORLEY J.: An Object Oriented Visual Programming Language Toolkit. Computer Graphics 29, 2 (1995), 25– 28. 2
[Yeo98]
Y EO A.: Client-based Web Visualization. Master’s thesis, School of Computer Studies, University of Leeds, U.K., 1998. 7, 22