Environmental Toxicology and Chemistry, Vol. 20, No. 5, pp. 1059–1066, 2001 Printed in the USA 0730-7268/01 $9.00 1 .00
ATRAZINE REMEDIATION IN WETLAND MICROCOSMS HEATHER B. RUNES,† PETER J. BOTTOMLEY,‡ ROBERT N. LERCH,§ and JEFFREY J. JENKINS*† †Oregon State University, Department of Environmental and Molecular Toxicology, 1007 Agricultural and Life Sciences, Corvallis, Oregon 97331, USA ‡Oregon State University, Department of Microbiology, 220 Nash, Corvallis, Oregon 97331, USA §U.S. Department of Agriculture, Agricultural Research Service, Cropping Systems and Water Quality Research Unit, Columbia, Missouri 65211 ( Received 20 June 2000; Accepted 21 September 2000) Abstract—Laboratory wetland microcosms were used to study treatment of atrazine in irrigation runoff by a field-scale-constructed wetland under controlled conditions. Three experiments, in which 1 ppm atrazine was added to the water column of three wetland, one soil control, and one water control microcosm, were conducted. Atrazine dissipation from the water column and degradate formation (deethylatrazine [DEA]; deisopropylatrazine [DIA]; and hydroxyatrazine [HA]) were monitored. Atrazine dissipation from the water column of wetland microcosms was biphasic. Less than 12% of the atrazine applied to wetland microcosms remained in the water column on day 56. Atrazine degradates were observed in water and sediment, with HA the predominant degradate. Analysis of day 56 sediment samples indicated that a significant portion of the initial application was detected as the parent compound and HA. Most probable number (MPN) assays demonstrated that atrazine degrader populations were small in wetland sediment. Wetland microcosms were able to reduce atrazine concentration in the water column via sorption and degradation. Based on results from this study, it is hypothesized that plant uptake contributed to atrazine dissipation from the water column. Keywords—Atrazine
Deethylatrazine
Deisopropylatrazine
Hydroxyatrazine
Wetland
hazardous at low levels. In addition, they are difficult to analyze, while other contaminants, such as metals, do not form degradation products and are easier to measure [7,8]. Atrazine was chosen to evaluate the treatment of pesticide runoff from a container nursery in a region of intensive agriculture in the Tualatin River Watershed near Portland, Oregon, USA. Atrazine is a selective triazine herbicide used to control broadleaf and grassy weeds in a variety of agricultural commodities with 75 to 85 million pounds applied annually to U.S. agricultural soils [9]. Atrazine half-lives in water are variable and range from several days to several months [10–12]. Atrazine is moderately water soluble (33 ppm) and exhibits low volatility (;1027 mm Hg), which gives a low Henry’s law constant (;1027) [12]. Direct and indirect atrazine photolysis result in the production of N-dealkylated and hydroxy analogs [13]. Atrazine can be degraded by either biotic or abiotic processes in soil and sediment [14,15] to produce deethylatrazine (DEA) and deisopropylatrazine (DIA). Evidence exists in the literature for the presence of atrazine-degrading micro-organisms in rhizosphere soil [16]. Dechlorination may occur abiotically or biotically, leading to the production of hydroxyatrazine (HA), the primary hydrolytic product [17,18]. Atrazine fate and transport in the Des Plaines natural wetlands in northeastern Illinois, USA, was studied. Results indicated that wetlands delayed and reduced atrazine peaks and removed 26 to 64% of inflow concentration [19]. McKinlay and Kasperek [20] reported that subsurface flow–constructed wetlands containing one of several types of marsh plants were able to decontaminate water polluted with atrazine via a microbially based mechanism associated with the rhizosphere. Walton and Anderson [21] suggested that the microbial communities associated with the rhizosphere may play an important role in the degradation of hazardous organic chemicals
INTRODUCTION
Pesticide use practices, both in agricultural and in urban areas, has resulted in contamination of ground- and surface water [1,2]. In a recent U.S. Geological Survey study (phases I and II) of Willamette Basin (Oregon, USA) surface water, 20 of 47 pesticides analyzed were detected more than once [1]. Atrazine (2-chloro-4-ethylamino-6-isopropylamino-1,3,5triazine) was detected most frequently at a median concentration of 0.052 mg/L [1]. During phase III of this study [2], 36 of 86 pesticides analyzed were detected, and atrazine was found in 99% of samples analyzed (0.071-mg/L median concentration). A cluster analysis of phase III data revealed associations between pesticide detections in surface water and land-use patterns. Other important variables included geographical location, intensity of agricultural activities, and watershed size [3]. A recent atrazine risk assessment conducted in midwestern watersheds recommended site-specific risk assessments in areas with intensive atrazine use [4]. The potential for adverse impacts of pesticide use on water quality vary greatly in scope and severity. Therefore, pollution prevention efforts should focus on areas of intensive farming adjacent to vulnerable water resources. The use of constructed wetlands for the treatment of agricultural runoff is gaining in popularity as a relatively inexpensive alternative to traditional treatment methods [5]. Currently, more than 300 constructed wetlands are used in the treatment of agricultural, municipal, industrial, and storm water waste in the United States [6]. Although constructed wetlands have successfully treated many types of wastewater, little evaluation of their treatment of pesticides has been done [7]. This may be due, in part, to the fact that these organic compounds and their transformation products are often considered * To whom correspondence may be addressed (
[email protected]). 1059
1060
Environ. Toxicol. Chem. 20, 2001
in soils because of their increased density and greater diversity in rhizosphere versus nonrhizosphere (nonvegetated) soil. Microbial densities in the plant rhizosphere are an order of magnitude or more above those in nonrhizosphere soils, which could translate into an increase in the degradation rate for xenobiotics in the rhizosphere via cometabolism [21,22]. The large volume of active rhizosphere per surface area associated with wetland plants suggests that if xenobiotics penetrate the rhizosphere and are susceptible to microbial degradation, constructed wetlands may be useful for reducing xenobiotic concentrations in wastewater [23]. Binding of atrazine and its degradates to wetland sediment may also be an important mechanism of loss from the water column. Glotfelty et al. examined atrazine edge-of-field runoff into an estuary; bottom sediments did not reveal detectable atrazine residues [10]. Huckins et al. studied atrazine fate in 0.5- to 1-L wetland microcosms simulating prairie wetland potholes and found that at the end of a six-week study, approx. 40% of total atrazine detected was present in the sediment [24]. Chung et al. [25] observed atrazine and HA in wetland sediment from a system without wetland plants. These studies provide evidence that wetland sediment is an important sink for atrazine residues. This study had two objectives: to characterize the fate of atrazine in the water and sediment compartments of wetland microcosms containing Typha latifolia (cattail), the dominant wetland plant at our field site, and to investigate the presence of atrazine degrading microorganisms in rhizosphere soil using most probable number (MPN) assays. Static wetland microcosms were used to simulate field-scale atrazine treatment by constructed wetlands. Because of the static nature of the wetland microcosms, atrazine treatment was expected to represent the upper limits of remediation potential for wetland systems. MATERIALS AND METHODS
Chemicals Analytical standards of atrazine, DEA, DIA, and HA were $95% pure (Chem Service, West Chester, PA, USA). The following radiolabeled compounds were donated by Novartis (Greensboro, NC, USA): [U-ring-14C]atrazine (96.8% radiopurity) and [U-ethyl-14C]atrazine (98.5% radiochemical purity). Internal standards were as follows: phenanthrene-d10 (Pd10) (98% pure, Chem Service) and terbuthylazine-2-hydroxy (HT) (95% pure, Crescent Chemical, Hauppauge, NY, USA) for gas chromatography/mass spectrometry (GC/MS) and high-performance liquid chromatography (HPLC) analyses, respectively. Stock solutions of HA were made in 0.1 N reagent-grade HCl, and working standards were prepared in 2:3 CH3OH:5 mM KH2PO4 (pH 7.5) (v/v) (40% CH3OH) at concentrations of 100 to 5,000 mg/L. Atrazine, DEA, and DIA stock solutions were prepared in ethyl acetate, and working standards were prepared in ethyl acetate at concentrations of 63 to 500 mg/L. Pd10 was prepared in CH3OH, and HT was prepared in 0.1 N HCl. All solvents and KH2PO4 were HPLC or GC grade (Fisher Scientific, Pittsburgh, PA, USA). The KH2PO4 solutions were adjusted to the appropriate pH using reagent-grade NaOH (50% w/v solution).
Wetland microcosms The wetland microcosms consisted of 265-L Rubbermaidt containers (93 3 73 3 57 cm, length 3 width 3 height; Rubbermaid, Winchester, VA, USA), which were oval in
H.B. Runes et al.
shape. Each microcosm was filled with approx. 15 cm or 128 kg of soil (originally a subsurface agricultural soil) from a constructed wetland near Portland, Oregon, USA. The soil used was classified as a silt loam (10% sand, 70% silt, and 20% clay) and was slightly acidic (pH 6.03) with an organic matter content of 4.7%. Three microcosms were planted with 25 Typha latifolia rhizomes (Balance Restoration Nursery, Lorane, OR, USA) and filled with 60 L of dechlorinated tap water to form a distinct water layer above the sediment. Plants were allowed to grow undisturbed for one month prior to initiation of experiments. Because spider mites compromised plant health following experiment 2, wetland microcosms were replanted prior to initiation of experiment 3. Two additional microcosms were constructed: a water control containing 60 L of water and a soil control (experiment 3 only) containing 15 cm of soil and 60 L of water. Wetland microcosms were kept in a temperature-controlled greenhouse (22–248C) receiving only natural light. A constant water volume was maintained in each microcosm by addition of water every 2 to 3 d, corresponding to a 1-cm-or-less drop in the water level. Studies were conducted from May to September 1998 and from July to September 1999.
Experimental design On day 0, 60 mg of analytical-grade atrazine dissolved in 25 ml of acetone were added dropwise from a volumetric pipette to each microcosm in a pattern that evenly distributed the droplets. All stock solution concentrations were confirmed by GC/MS analysis. Three hours prior to sampling, the water level was adjusted to 60 L. Water samples (100 ml for atrazine, DEA, and DIA and 100 ml for HA) were collected using a 60-cc polypropylene syringe. Samples were collected 1, 3, 5, 7, 10, 14, 21, 28, 35, 42, 49, and 56 d after application. To maintain plant vigor, fertilizer (5 ml of 18% N, 2% P) was added to microcosms biweekly. One-hundred-milliliter water samples were collected once a week for nutrient analysis (nitrate, ammonia, and organic phosphate). Sediment samples were taken from each microcosm prior to atrazine application and on day 56. Five soil core samples were taken from each microcosm using an 18-mm-diameter soil-coring device that was inserted to the bottom of the microcosm container. Sediment was air dried overnight in a fume hood, composited, and sieved to ,2 mm and stored at 2108C. All matrix spikes were created and frozen on September 23, 1999. Twenty percent of all water and sediment samples were duplicates or matrix spikes. Other parameters monitored included pH (Orion, Beverly, MA, USA), oxidizing-reducing potential (Sensorex, Stanton, CA, USA), and dissolved oxygen (Hanna Instruments, Bedfordshire, UK). Greenhouse temperature was recorded hourly using a HOBOt (Onset Computer Corporation, Cape Cod, MA, USA) temperature data logger.
Extraction procedures For atrazine, DEA, and DIA, 100-ml water samples (containing 1% MeOH) were extracted using solid-phase extraction (SPE) C18 cartridges (500 mg, 6-ml polypropylene reservoir; J.T. Baker, Union City, CA, USA) following filtration through 55-mm glass-fiber filters (Whatman, Clifton, NJ, USA) [26]. Briefly, SPE cartridges were conditioned, and samples were passed through the SPE cartridges followed by elution with ethyl acetate. The Pd10 was added (2 mg), and samples were evaporated using an N-evap sample concentrator (Organom-
Environ. Toxicol. Chem. 20, 2001
Atrazine remediation in wetland microcosms
ation, Berlin, MA, USA) to either 1 ml or 200 ml followed by GC/MS analysis. For 100-ml samples concentrated to a final volume of 1 ml, the limits of quantitation (LOQ) were 250, 1,000, and 1,000 ng/L, and the limits of detection (LOD) were 25, 40, and 250 ng/L for atrazine, DEA, and DIA, respectively. One-hundred-milliliter water samples for HA analysis were extracted as follows. Water samples were filtered through 55mm glass-fiber filters to remove particulates. Following filtration, samples were enriched on C18 SPE cartridges (500 mg, 6 ml polypropylene reservoir; Varian, Sunnyvale, CA, USA) conditioned with 8 ml CH3OH and 16 ml Milli-Q water (MilliPore, Bedford, MA, USA). Following enrichment, the cartridges were allowed to dry for 1 h. The HA was eluted from the SPE cartridges with 3.4 ml of 9:1 CH3OH:5 mM KH2PO4, pH 7.5. Subsequently, 2 mg of HT were added, and the eluant was evaporated to dryness using an N-evap. The sample was reconstituted in 1 ml of 40% CH3OH and filtered through 0.45mm nylon Acrodisct syringe filters (Gelman Sciences, Ann Arbor, MI, USA) prior to HPLC/UV analysis. The LOQ and LOD for HA were 2.0 and 0.6 mg/L, respectively. For atrazine, DEA, and DIA soil samples, extraction was based on a modified method [27]. Briefly, 20-g soil samples were extracted twice with 100 ml of 4:1 CH3OH:Milli-Q water (80% CH3OH) in 250-ml Teflon-lined screw-cap centrifuge tubes. Samples were centrifuged for 30 min at 4,000 g, and the supernatants were combined. The methanol was evaporated using a Turbovap II Concentration Workstation (Zymark Corporation, Hopkinton, MA, USA) with a water bath heated to 608C. The remaining water was extracted three times with chloroform, which was collected and evaporated to dryness. The sample was reconstituted in 1 ml of ethyl acetate, sonicated, and vortexed for 1 min each before GC/MS analysis. The LOQs for atrazine, DEA, and DIA in 20-g soil samples were 1.0, 1.5, and 1.5 ng/g, respectively. The LODs for atrazine, DEA, and DIA in 20-g soil samples were 0. 5, 1.0, and 1.0 ng/g, respectively. For HA soil samples, extraction was based on a modified mixed-mode extraction method [28]. A 20-g soil sample was weighed into a 250-ml centrifuge tube with a cap lined with aluminum foil. The mixed-mode extractant (MME), 3:1 of 0.5 M KH2PO4, pH 7.5:CH3CN (v/v), was heated to 388C, and 65 ml were added to each sample. The samples were shaken for 2 h on an orbital shaker in a temperature-controlled room maintained at 388C. Following the extraction, samples were centrifuged for 30 min at 2,000 g. The extraction was repeated twice with 40 ml of MME per extraction (2 and 1 h), and all extracts were combined. The total extract volume was recorded, and the supernatant was transferred to a Turbovap flask (Zymark) for evaporation of CH3CN under a stream of nitrogen and in a water bath heated to 608C. Sample cleanup and enrichment were performed using 20-g SAX SPE cartridges (Varian) followed by 2-g SCX cartridges (Varian). Samples were ultimately redissolved in 1 ml of 40% CH3OH and analyzed by HPLC/UV. The HA’s LOQ and LOD for a 20-g soil sample were 5.0 and 3.0 ng/g, respectively. Twenty percent of all water and soil samples were quality control samples. These included duplicate and matrix spike samples. All soil spikes were stored at 2208C for 4.5 to 7 months, and recoveries were in the range of 71 to 127%. In addition, 20% of water samples extracted were Milli-Q water blanks or spikes.
1061
GC/MS analysis Analysis of atrazine, DEA, and DIA was performed using a Hewlett Packard 6890 GC and a 5972 mass-selective detector (GC/MS; Wilmington, DE, USA) that was run in selected ion monitoring mode. Operating conditions were as follows: ionization voltage (70 eV), electron multiplier 2,100 V, and capillary interface at 2808C. Separation of the compounds was accomplished with a fused-silica capillary column of (50%Phenyl) methylpolysiloxane (DB-17) of 0.25-mm film thickness, 30-m 3 0.25-mm i.d. (J&W Scientific, Folsom, CA, USA). Helium was used as the carrier gas at a flow rate of 1 ml/min. The column temperature was set to 908C for 2 min and then ramped at 308C/min to 2158C, where it was held for 5 min. The injector temperature was 2258C. Quantification of the base peak of each compound was based on the response of the 188 ion of the internal standard, Pd10, whose retention time (RT) was 9.13 min. The ions monitored and RTs for the compounds were as follows: 187, 172, 145, and RT 8.08 min for DEA; 173, 158, 145, and RT 8.22 min for DIA; and 215, 200, 173, and RT 8.45 for atrazine.
HPLC/UV analysis Analysis of HA was by octyl (C8) reverse-phase HPLC using a Hewlett Packard 1050 series HPLC equipped with a UV detector. The HPLC conditions were as follows: column, 150 3 4.6-mm i.d. octyl 5m (Phenomenex, Torrance, CA, USA); mobile phase 2:3 CH3OH: 5 mM KH2PO4, pH 7.5; flow rate 1 ml/min; UV detection, 220 nm; and injection volume, 40 ml. The RTs for HA and HT were 7.60 and 17.9 min, respectively.
MPN assays Populations of atrazine-degrading micro-organisms were enumerated using MPN assays conducted with [14C] ring-labeled or with [14C] ethyl-labeled atrazine [29] and sediment samples taken prior to experiment 1 (pre-exposure) and on termination of experiment 2 (postexposure). A 5-g (dry weight) composite soil sample from the three wetland microcosms and one composite sample from the soil control microcosm were suspended in mineral salts medium, creating either a 1/5 or 1/ 10 dilution followed by four to five additional dilutions. The mineral salts medium contained the following ingredients: 6.8 g/L KH2PO4 (anhydrous), 0.5 g/L NH4NO3, 0.2 g/L MgSO4·7 H2O, 0.05 g/L CaCl2, 0.05 g/L yeast extract, 10 ml of trace elements solution, 3.3 ml sodium EDTA solution (0.3%), and 1 ml of 0.4% FeCl3 in 0.1 N HCl. Ten milliliters of each dilution were transferred to an incubation vial containing 1.0 mg/L atrazine (0.1 mCi ethyl-labeled atrazine 1 cold atrazine). Four replicates per dilution plus a sterile soil control (sterilized for 30 min at 1218C) and a mineral salts medium control (contained no soil) were used. Incubation vials were sealed with rubber stoppers fitted with center wells (Kontes, Redmond, WA, USA). The center wells contained a filter-paper wick soaked with 100 ml of 1-M NaOH to trap 14CO2, and the vials were incubated in the dark for 115 d at room temperature. The filter-paper wicks were removed periodically and placed in a 20-ml plastic scintillation vial containing 10 ml of scintillation fluid (Scinti Safe Econo 2; Fisher Scientific). Samples were counted (background and quench corrected) using a Beckman 3801 Liquid Scintillation Spectrophotometer (Fullerton, CA, USA). An MPN dilution series was scored positive if mean cumulative counts were greater than the mean of the sterile
1062
Environ. Toxicol. Chem. 20, 2001
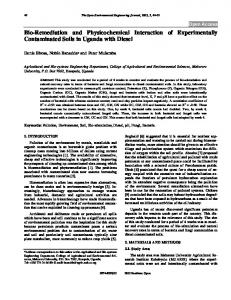
Fig. 1. Atrazine (a), deethylatrazine (DEA) (b), and deisopropylatrazine (DIA) (c) in the water column of wetland (n 5 3) and water control microcosms (n 5 1) for experiment 1.
soil and mineral salts medium control counts. Atrazine-degrading populations were enumerated using the Most Probable Number Calculator, Version 2.80, program for PCs (U.S. Environmental Protection Agency, Cincinnati, OH). RESULTS
Water quality measurements Water quality parameters were monitored during all three experiments. The water pH ranged from 5.8 to 8.9 but was generally neutral to slightly basic for all microcosms. The dissolved oxygen water content ranged from 1.4 to 10.7 mg/ L but was generally near 6.0 mg/L. The oxidizing-reducing potential was also variable (49–394 mV). Nutrient data varied because of biweekly fertilization events. The range of values for phosphate, nitrate, and ammonium were from ,LOD (0.01) to 20.6, ,LOD (0.02) to 26.9, and ,LOD (0.02) to 31.2 mg/ L for all experiments, respectively.
H.B. Runes et al.
Fig. 2. Atrazine (a), deethylatrazine (DEA) (b), and deisopropylatrazine (DIA) (c) in the water column of wetland (n 5 3) and water control microcosms (n 5 1) for experiment 2.
Atrazine dissipation from microcosm water Experiment 1. The initial water concentration in wetland and water control microcosms was 0.82 and 0.64 mg/L, respectively. Based on mean values (n 5 3), atrazine dissipation from the water column of wetland microcosms for all experiments was biphasic (Figs. 1a, 2a, 3a). The first phase showed rapid dissipation for 10 d following application (Fig. 1a). The data point for day 14 was not included in Figure 1a or in the calculation of k and half-life (Table 1) because of an abnormally large amount of evapotranspiration between days 10 and 14. This required the addition of a large volume of water to the wetland microcosms prior to sampling, possibly resulting in desorption from the sediment. The second phase exhibited a slower rate of dissipation than the first phase (Fig. 1a). Only 7% of the atrazine applied remained in the water on day 56. In the water control microcosm, dissipation was not biphasic, and 62% of the atrazine applied remained in the water on day 56 (Fig. 1a). Both DEA (Fig. 1b) and DIA (Fig. 1c) were found in wetland microcosm water. The maximum concentrations for DEA and DIA in wetland microcosms were 8 and 17 mg/L, respec-
Environ. Toxicol. Chem. 20, 2001
Atrazine remediation in wetland microcosms
Fig. 3. Atrazine (a), deethylatrazine (DEA) (b), and deisopropylatrazine (DIA) (c) in the water column of wetland (n 5 3), water control (n 5 1), and soil control microcosms (n 5 1) for experiment 3 (,QLwe 5 less than quantitation limit for wetland microcosms; NDw 5 no detection for water control microcosm).
1063
tively; DEA and DIA were formed in the water control with maximum concentrations of 18 and 20 mg/L, respectively. The HA was detected in wetland microcosms and in the water control microcosm at or below the LOQ of 2 mg/L. Wetland sediment samples for all experiments indicated that atrazine, DEA, DIA, and HA accumulated in this compartment (Table 2). The analysis of sediment samples collected on day 67 showed that atrazine was the most prevalent residue, followed by HA, DIA, and DEA, respectively. A mass balance for atrazine and degradates in both the water and the sediment compartments of all microcosms was performed (Table 3). The majority of residues (67%) were detected in the sediment compartment of wetland microcosms (128 kg of sediment/microcosm) in the form of atrazine and HA. The water compartment of wetland microcosms contained significantly less residue than the water control microcosm on day 56. Experiment 2. Atrazine application was repeated two weeks following termination of the first experiment. The initial water concentration in wetland and water control microcosms was 0.78 and 0.64 mg/L, respectively. Biphasic atrazine dissipation was observed (Fig. 2a), and half-lives were comparable to experiment 1 (Table 1). Approximately 12% of the atrazine remained in the wetland microcosms on day 56, while 54% remained in the water control (Table 3). The maximum wetland microcosm concentration for DEA was 20 mg/L, and the maximum DIA concentration was 14 mg/L (Fig. 2b and c). The maximum DEA and DIA water concentrations for the water control microcosm were equivalent, 25 mg/L. The HA was detected often at or below the LOQ in both the wetland and the water control microcosms. The maximum HA concentration for wetland and water control microcosm water were observed on days 21 (4.0 mg/L) and 56 (9.1 mg/L), respectively. On day 0, atrazine, DEA, DIA, and HA residues were detected in wetland sediment samples (Table 2). Additional atrazine, HA, and DEA accumulated in sediment samples, but DIA concentration decreased from day 0 to day 56. Atrazine and DEA accumulation was less than observed during experiment 1, but HA accumulation was comparable to that observed during experiment 1. Residue data for the mass balance calculation for this, and subsequent experiments were corrected for carryover. Again, the sediment compartment of wetland microcosms contained
Table 1. Atrazine first-order rate constant (k) and half-life values for dissipation from the water column of wetland microcosms for experiments 1 to 3 Phase I Microcosma Experiment 1 Wetland Water control Experiment 2 Wetland Water control Experiment 3 Wetland Water control Soil control
Phase II
k (per d)
Half-life (d)
Period (d)
k (per d)
Half-life (d)
Period (d)
k (per d)
Half-life (d)
Period (d)
0.14 NCb
5.0 NC
1–10 N/Ac
0.024 NC
29 NC
21–56 N/A
0.036 NC
19 NC
1–56 N/A
0.11 NC
6.3 NC
1–10 N/A
0.033 NC
21 NC
14–56 N/A
0.030 NC
23 NC
1–56 N/A
0.18 NC NC
3.9 NC NC
1–10 N/A N/A
0.077 NC NC
9.0 NC NC
14–56 N/A N/A
0.072 0.0061 0.016
9.7 115 44
1–56 1–56 1–56
Wetland 5 with plants, soil control 5 without plants, water control 5 water only. No correlation at p 5 0.05. c NA 5 not applicable. a
b
Overall
1064
Environ. Toxicol. Chem. 20, 2001
H.B. Runes et al.
Table 2. Sediment atrazine, deethylatrazine (DEA), deisopropylatrazine (DIA), and hydroxyatrazine (HA) concentration (mg/g) in wetland and soil control microcosms for experiments 1 to 3 Mean 6 SD (mg/g) Experiment
Day
Microcosma
Atrazine
DEA
DIA
HA
0 67 0 56 0 0 56 56
Wetlandb Wetland Wetland Wetland Wetland Soil controld Wetland Soil control
,dlc 0.13 6 0.015 0.13 6 0.015 0.15 6 0.054 0.0094 6 0.0021 0.026 0.032 6 0.0090 0.14
,dl 0.012 6 0.0094 0.012 6 0.0094 0.014 6 0.024 ,dl 0.0063 0.0054 6 0.0002 0.011
,dl 0.030 6 0.0014 0.030 6 0.0014 0.020 6 0.022 0.012 6 0.0018 0.0080 0.0085 6 0.0007 0.0069
,dl 0.099 6 0.024 0.099 6 0.024 0.19 6 0.14 0.21 6 0.069 0.18 0.28 6 0.050 0.23 6 0.0023
1 1 2 2 3 3 3 3
Wetland 5 with plants, soil control 5 without plants. n 5 4. Less than detection limit. d n 5 1 or 2. a
b c
the majority of residues, which were largely atrazine and HA. Less total residue was accounted for in the wetland microcosms during this experiment compared to experiment 1 (Table 3). Experiment 3. In July 1999, the last microcosm study was initiated. The initial water concentration in wetland, water control, and soil control microcosms was 1.1, 1.1, and 1.0 mg/L, respectively. Data points for atrazine water concentration on day 21 in the water control microcosm and day 35 in the soil control microcosm were not included in Figures 3a, b, or c because of an analysis error (day 21 sample) and loss of the day 35 sample. Phase I (Fig. 3a), phase II, and overall halflives were shorter than observed for the previous experiments (Table 1), and biphasic dissipation was not as pronounced as previously observed. Atrazine half-lives in the water column of water and soil control microcosms were longer than observed in wetland microcosms, with the longest half-life observed in the water control microcosm (Table 1). On day 56, 1, 36, and 75% of the original atrazine remained in the wetland, soil control, and water control microcosms, respectively (Table 3). The maximum wetland microcosm DEA and DIA concentrations were 7.5 and 4.8 mg/L (Fig. 3a and b), respectively.
The maximum DEA soil control concentration was twice that of the water control microcosm, but maximum DIA concentrations were similar (Fig. 3b and c). The maximum HA water concentrations were 6.6 mg/L for wetland microcosms on day 21, 13 mg/L for the soil control microcosms on day 35, and 3.6 mg/L for the water control microcosm on day 56. By day 56, HA was below the limit of quantitation in the wetland microcosms. Atrazine and HA were present in greater concentrations than DEA and DIA in sediment samples of wetland microcosms (Table 2). The accumulation of atrazine and HA concentrations in wetland microcosms was similar to that observed during experiment 2. Atrazine and all degradates accumulated in the soil control microcosm (Table 2). Day 0 soil control microcosm sediment samples contained detectable atrazine and degradate residues from prior atrazine exposure. When accounting for carryover, a net decrease in DIA concentration was seen in soil control microcosm sediment over the course of the experiment. Mass balance data from this experiment revealed less total residue present in wetland microcosms than in control micro-
Table 3. Mass balance (% of initial application) for wetland, water control, and soil control microcosms after 56 d for experiments 1 to 3; deethylatrazine 5 DEA; deisopropylatrazine 5 DIA; hydroxyatrazine 5 HA Mass balance (% of initial application) Microcosma Experiment 1 Wetland Wetland Wetland Water control Experiment 2 Wetland Wetland Wetland Water control Experiment 3 Wetland Wetland Wetland Water control Soil control Soil control Soil control a b
Compartment
Atrazine
DEA
DIA
HA
Total 11 67 78 67
Water Sediment Water 1 Sediment Water
7.0 34
0.80 2.7
1.4 6.3
0.17 24
62
2.6
2.4
0.23
Water Sediment Water 1 Sediment Water
12 5.5
1.7 0.051
1.5 NDb
0.59 23
54
3.4
3
Water Sediment Water 1 Sediment Water Water Sediment Water 1 Sediment
1 16
0.18 0.91
0.16 ND
0.067 12
75 36 21
0.59 1.8 0.79
0.4 0.65 ND
3.3 0.36 8.8
Wetland 5 with plants, soil control 5 without plants, water control 5 water only. ND 5 none detected.
1.3
16 29 44 62 1.4 29 30 79 39 31 70
Environ. Toxicol. Chem. 20, 2001
Atrazine remediation in wetland microcosms
cosms (Table 3). The sediment compartment of wetland and soil control microcosms accumulated the majority of residues in the form of atrazine and HA. In addition, the wetland and soil control microcosms accumulated similar levels of total residues (29 vs 31%, respectively). MPN experiment. The MPN assays were conducted using 14 C ring-labeled atrazine and did not indicate the presence of microorganisms able to mineralize atrazine. Because no activity was observed with the 14C ring-labeled atrazine, we tested whether microorganisms capable of mineralizing the ethyl side chain, which is preferentially mineralized over the isopropyl side chain [30], were present. The MPN assays using 14 C ethyl-labeled atrazine indicated the presence of a small community of degraders in wetland and soil control microcosms (199 cells/g, 59–502 cells/g for 95% lower-upper confidence interval). Sample variation for replicates (n 5 4) was high, presumably because of the small population size. DISCUSSION
Atrazine dissipation from microcosm water columns Our results using static wetland microcosms showed a reduction in atrazine concentration in the water column with time. Abiotic degradation, sorption, and possibly plant uptake appear to be the primary pathways responsible for atrazine dissipation from the water column. Biphasic atrazine dissipation from the water column of wetland microcosms was observed during microcosm experiments. Biphasic dissipation due to sorption has been observed previously in a wetland microcosm study simulating edge-of-field runoff of atrazine [24]. It has been suggested that the rapid dissipation observed in phase I may be due to a rapid soil sorption phase involving external sites, and phase II may be influenced by a slowerdiffusion-limited sorption phase, including diffusion through intraparticle micropores [31–33], which may occur over a period of weeks to months. On day 56 of experiment 3, atrazine concentrations in the water column of wetland microcosm and the soil control microcosm were less than in a water control microcosm, and residual atrazine in the wetland microcosms was measurably less than in the soil control microcosm. In addition, overall atrazine half-life in the water column of wetland microcosms for experiment 3 was less than during the previous experiments. A significant increase in plant biomass and associated rhizosphere compared to previous experiments was noted. This suggests that the presence of wetland plants facilitated atrazine dissipation. The mechanism(s) is hypothesized to be either plant uptake [34,35] or rhizosphere-associated soil microbial degradation [16,17,20]. Because MPN results did not indicate a large population of atrazine-degrading microorganisms, plant uptake may account for the decrease in sediment residues. The formation of three degradation products, DEA, DIA, and HA, was followed throughout the experiments. The DEA and DIA formation in the water column of wetland microcosms were nearly equivalent. This result contradicts several recent studies of dealkylated degradate formation in surface water reporting greater formation of DEA than DIA [36,37]. It is widely accepted that the initial step in the microbial degradation of atrazine in soil is removal of the alkyl side chains, forming DEA or DIA [15,38]. The formation of HA, which occurs by either biotic or abiotic processes, may be the ratelimiting step to further degradation [39]. Accumulation of DEA and DIA in wetland microcosms (experiments 1 and 2) suggests that the rates of formation were greater than the rates
1065
of degradation, sorption, or plant uptake, which might remove them from the water column. During experiment 3, DEA and DIA accumulation in the water column was not observed, possibly because of plant uptake. The HA was present at quantifiable levels only once during experiment 1. In subsequent experiments, HA was detected with greater frequency and at higher concentrations, possibly because of microbial degradation. If the formation of HA were a result of microbial degradation, it would not have been indicated by the MPN assays performed, as they enumerated only microorganisms capable of mineralizing atrazine’s ethyl side chain. The infrequency and low levels at which HA was detected in the water column is not surprising given its high affinity for sorption to sediment, and, therefore, we would expect most HA to be found in this compartment [40]. In addition to sorption, degradation, and plant uptake, atrazine dissipation from the water column may be due to volatilization. However, based on atrazine’s physicochemical properties, volatilization from the water column is assumed to be negligible.
Sediment residues Atrazine sorption and degradation in the sediment compartment were significant mechanisms of atrazine loss from the water column of wetland and soil control microcosms as indicated by mass balance data (Table 3). These findings are in agreement with Huckins et al. (1986), in which the distribution of atrazine in simulated wetland microcosms was investigated and the water column contained the largest portion of residues (48.9%), followed by sediment (38%) [24]. The majority of sediment residues (86%) were in the form of bound residues (not extractable by sequential solvent extraction), and sediment samples were not broken down into degradate composition [24]. In another study of extractability and degradation of atrazine in a submerged sediment over 336 d, HA was the primary degradate, accounting for up to 70% of the identified degradates [41]. The DEA was detected as well, but to a lesser extent than HA; DIA was not detected. Between 30 and 60% of the residue remained bound to sediment incubated for 336 d at 5 and 248C [41], and the proportion of nonextractable residue increased with exposure time. This is consistent with other reported data [40]. Following the first microcosm experiment, atrazine, DEA, and DIA sediment residues decreased. We do not believe this was a result of bound residue formation because all analytes were quantitatively recovered from aged soil spikes. It is possible, however, that further degradation occurred. Our results are consistent with other findings suggesting that HA is the primary atrazine degradate found in sediment and soil systems [24–26,42]. CONCLUSIONS
Wetland microcosms may be used to remove atrazine in water simulating irrigation runoff. Biphasic dissipation from the water column of wetland microcosms was observed. This observation in addition to atrazine and degradate sediment residues indicates that the sediment is a significant compartment for atrazine fate in these wetlands. One hundred percent of the atrazine application was not accounted for, indicating the possibility of further degradation or other mechanisms of loss. Although others have alluded to the importance that microbial degradation plays in the fate of atrazine in the environment [16,18], a substantial population of atrazine-degrad-
1066
Environ. Toxicol. Chem. 20, 2001
ing microorganisms was not observed in these wetland microcosms. However, we cannot rule out the possibility of the presence of microorganisms capable of degrading atrazine to HA, a nonphytotoxic degradate. Future studies should focus on finding ways to increase the role microorganisms play in atrazine loss from these microcosms. In addition, investigations into plant uptake could be useful. Acknowledgement—The authors would like to thank James Moore and Rockie Yarwood. This is Oregon Agricultural Experiment Station technical paper 11712. REFERENCES 1. Anderson CW, Rinella FA, Rounds S. 1996. Occurrence of selected trace elements and organic compounds and their relation to land use in the Willamette River Basin, Oregon, 1992–1994. Report 96-4234. U.S. Geological Survey, Portland, OR. 2. Anderson CW, Wood TM, Morace JL. 1997. Distribution of dissolved pesticides and other water quality constituents in small streams, and their relation to land use, in the Willamette River Basin, Oregon, 1996. Report 97-4268. U.S. Geological Survey, Portland, OR. 3. Qian SS, Anderson CW. 1999. Exploring factors controlling the variability of pesticide concentrations in the Willamette River Basin using tree-based models. Environ Sci Technol 33:3332– 3340. 4. Solomon KR, et al. 1996. Ecological risk assessment of atrazine in North American surface waters. Environ Toxicol Chem 15:31– 76. 5. Kirschner EM. 1995. Botanical plants prove useful in cleaning up industrial sites. Chem Eng News 73:22–24. 6. Electric Power Research Institute, Environment Division. 1997. Constructed wetlands meet compliance, cost objectives. Environ Update 11:6–7. 7. Watanabe ME. 1997. Phytoremediation on the brink of commericalization. Environ Sci Technol 31:182A–186A. 8. Thurman EM, Meyer MT. 1996. Herbicide metabolites in surface water and groundwater: Introduction and overview. In Meyer MT, Thurman EM, eds, Herbicide Degradates in Surface Water and Groundwater. ACS Symposium Series 630. American Chemical Society, Washington, DC, pp 1–15. 9. Aspelin AL, Grube AH. 1999. Pesticides industry sales and usage: 1996 and 1997 market estimates. 733-R-99-001. U.S. Environmental Protection Agency, Washington, DC. 10. Glotfelty DE, Taylor AW, Isensee AR, Jersey J, Glenn S. 1984. Atrazine and simazine movement to Wye River Estuary. J Environ Qual 13:115–121. 11. Jones TW, Kemp WM, Stevenson JC, Means JC. 1982. Degradation of atrazine in estuarine water/sediments systems and soils. J Environ Qual 11:632–638. 12. Hornsby AG, Wauchope RD, Herner AE. 1996. Pesticide properties in the environment. Springer-Verlag, New York, NY, USA. 13. Grover R, Cessna AJ, eds. 1991. Environmental Chemistry of Herbicides, Vol II. CRC, New York, NY, USA. 14. Goswami KH, Green RE. 1987. Microbial degradation of the herbicide atrazine and its 2-hydroxy analog in submerged soils. Environ Sci Technol 5:426–429. 15. Giardina MC, Giardi MT, Filacchioni G. 1980. 4-Amino-2-chloro1,3,5-triazine: A new metabolite of atrazine by a soil bacterium. Agric Biol Chem 44:2067–2072. 16. Anderson TA, Kruger EL, Coats JR. 1994. Enhanced degradation of a mixture of three herbicides in the rhizosphere of a herbicidetolerant plant. Chemosphere 8:1551–1557. 17. Armstrong DE, Chesters G, Harris RF. 1967. Atrazine hydrolysis in soil. Soil Sci Soc Am Proc 31:61–66. 18. Behki RM, Khan SU. 1986. Degradation of atrazine, propazine, and simazine by Rhodococcus strain B-30. J Agric Food Chem 42:1237–1241. 19. Alvord HH, Kadlec RH. 1996. Atrazine fate and transport in the Des Plaines Wetlands. Ecol Model 90:97–107. 20. McKinlay RG, Kasperek K. 1999. Observations on decontami-
H.B. Runes et al.
21.
22. 23. 24. 25. 26.
27. 28. 29.
30.
31. 32. 33.
34.
35. 36. 37.
38. 39. 40. 41. 42.
nation of herbicide-polluted water by marsh plant systems. Water Res 33:505–511. Walton BT, Anderson TA. 1990. Microbial degradation of trichloroethylene in the rhizosphere: Potential application of biological remediation of waste sites. Appl Environ Microbiol 56: 1012–1016. Curl EA, Truelove B. 1986. The Rhizosphere. Springer-Verlag, Berlin, Germany. Brix H. 1987. Treatment of wastewater in the rhizosphere of wetland plants—The root zone method. Water Sci Technol 19: 107–118. Huckins JN, Petty JD, England DC. 1986. Distribution and impact of trifluralin, atrazine, and fonofos residues in microcosms simulating a northern prairie wetland. Chemosphere 15:563–588. Chung KH, Ro KS, Roy D. 1996. Fate and enhancement of atrazine biotransformation in anaerobic wetland sediment. Water Res 30:314–346. Zaugg SD, Sandstrom MW, Smith SG, Fehlberg KM. 1995. Methods of analysis by the U.S. Geological Survey National Water Quality Laboratory—Determination of pesticides in water by C18 solid-phase extraction and capillary-column gas chromatography/mass spectrometry with selected-ion monitoring. Open-File Report 95-181. U.S. Geological Survey, Denver, CO. Lerch RN, Thurman EM, Blanchard PE. 1999. Hydroxyatrazine in soils and sediments. Environ Toxicol Chem 18:2161–2168. Lerch RN, Li YX. 2001. Analysis of hydroxylated atrazine degradation products in soils. Int J Environ Anal Chem (in press). Woomer PL. 1994. Most probable number counts. In Mickelson SH, Bigham JM, eds, Methods of Soil Analysis, Part 2. Microbiological and Biochemical Properties. SSSA Book Series 5. Soil Science Society of America, Madison, WI, pp 59–79. Muir CE, Baker DE. 1976. Detection of triazine herbicides and their degradation products in tile-drain water from fields under intensive corn (maize) production. J Agric Food Chem 24:122– 129. Karickhoff SW, Morris KR. 1985. Sorption dynamics of hydrophobic pollutants in sediment suspensions. Environ Toxicol Chem 4:469–479. Pignatello JJ, Xing B. 1996. Mechanisms of slow sorption of organic chemicals to natural particles. Environ Sci Technol 30: 1–11. Karickhoff SW. 1980. Sorption kinetics of hydrophobic pollutants in natural sediments. In Baker, RA, ed, Contaminants and Sediments, Vol 2—Analysis. Ann Arbor Publishers, Ann Arbor, MI, USA, pp 193–205. Rice PJ, Anderson TA, Coats JR. 1997. Phytoremediation of herbicide-contaminated surface water with aquatic plants. In Kruger EL, Anderson TA, Coats JR, eds, Phytoremediation of Soil and Water Contaminants. American Chemical Society, Washington, DC, pp 133–151. Burken JG, Schnoor JL. 1997. Uptake and metabolism of atrazine by poplar trees. Environ Sci Technol 31:1399–1406. Thurman EM, Meyer MT, Mills MS, Zimmerman LM, Perry CA. 1994. Formation and transport of deethylatrazine and deisopropylatrazine in surface water. Environ Sci Technol 28:2267–2277. Kruger EL, Somasundaram L, Kanwar RS, Coats JR. 1993. Persistence and degradation of [14C]atrazine and [14C]deisopropylatrazine as affected by soil depth and moisture conditions. Environ Sci Technol 12:1959–1975. Behki RM, Khan SU. 1986. Degradation of atrazine by Pseudomonas: N-dealkylation and dehalogenation of atrazine and its metabolites. J Agric Food Chem 34:746–749. Mandelbaum RT, Allan DL, Wackett LP. 1995. Isolation and characterization of a Pseudomonas sp. that mineralizes the s-triazine herbicide atrazine. Appl Environ Microbiol 29:1451–1457. Lerch RN, Thurman EM, Kruger EL. 1997. Mixed-mode sorption of hydroxylated atrazine degradation products to soil: A mechanism for bound residue. Environ Sci Technol 31:1539–1546. Mersie W, Liu J, Seybold C, Tierney D. 1998. Extractability and degradation of atrazine in a submerged sediment. Weed Sci 46: 480–486. Pignatello J, Huan LQ. 1991. Sorptive reversibility of atrazine and metolachlor residues in field soil sample. J Environ Qual 20: 222–228.