f
Atrial cell action potential parameter fitting using genetic algorithms Z. Syed I
E. Vigmond I
S. Nattel 2'3
L . J . Leon TM
1Department of Electrical & Computer Engineering, University of Calgary, Calgary, Alberta, Canada 2Department of Pharmacology & Therapeutics, McGill University, Montr6al, Qu6bec, Canada 3Research Center & Department of Medicine, Montreal Heart Institute & University of Montreal, Montreal, Quebec, Canada 4Faculty of Engineering, Dalhousie University, Halifax, Canada
Abstract--Understanding of the considerable variation in action potential (AP) shape throughout the heart is necessary to explain normal and pathological cardiac function. Existing mathematical models reproduce typical APs, but not all measured APs, as fitting the sets of non-linear equations is a tedious process. The study describes the integration of a pre-existing mathematical m o d e l of an atrial cell AP with a genetic algorithm to provide an automated tool to generate APs for arbitrary cells by fitting ionic channel conductances. Using the Nygren m o d e l as the base, the technique was first verified by starting with random values and fitting the Nygren m o d e l to itself with an error of only 0.03%. The Courtemanche model, which has a different morphology from that of the Nygren model, was successfully fitted. The AP duration restitution curve generated by the fit matched that of the target model very well. Finally, experimentally recorded APs were reproduced. To match AP duration restitution behaviour properly, it was necessary simultaneously to fit over several stimulation frequencies. Also, fitting of the upstroke was better if the stimulating current pulse replicated that found in situ as opposed to a rectangular pulse. In conclusion, the modelled parameters were successfully able to reproduce any given atrial AP. This tool can be useful for determining parameters in new AP models, reproducing specific APs, as well as determining the locus of drug action by examining changes in conductance values. Keywords--Genetic algorithm, Atria/action potentials, Restitution curve Med. Biol. Eng. Comput., 2005, 43, 561-571
J
1 Introduction
ATRIALFIBRILLATION(AF) is a common heart condition in which the atria quiver, causing pooling of blood that can lead to clot formation. The clots can result in myocardial infarction or stroke when they dislodge, thereby entering the circulatory system and blocking arteries. With close to three million people in the USA alone suffering from AF (LIu et al., 2004), there is increasing interest in developing new tools to understand and control its underlying mechanisms. One such tool is mathematical modelling. Currently, the available mathematical models produce action potentials (APs) that axe specific to the particular cells used in the model development. APs vary both regionally and significantly from epicaxdium to endocardium (FENG et al., 1998; RAMIREZet al., 2000) and even on a cell-to-cell basis (SCHRAM e t al., 2002). Although this heterogeneity plays an important part in AF (FENG e t al., 1998; RAMIREZ et al., 2000), there is no global model that produces the variety of APs observed over the atria. Correspondence should be addressed to Dr L. Joshua Leon;
emaih
[email protected] Paper received 28 September 2004 and in final form 18April 2005 MBEC online number: 20054021 © IFMBE: 2005 Medical & Biological Engineering & Computing 2005, Vol. 43
Because the same ionic channels axe present in most atrial cell membranes, these AP differences may only be the result of up or down regulation of channel protein expression, resulting in different numbers of channels. These channel densities are embedded within the maximum conductance values of AP models. Hence, any particular AP could be produced by adjusting the conductances in a complete base model. Using this hypothesis, NYGREN e t al. (2001) produced a spike-and-dome AP morphology by adjusting the conductance values in their model that originally generated triangularly shaped APs. In this generalisation, the differences in calcium handling processes incorporated by different models are not considered, which could cause significant variations in the initiation and maintenance of axrhythmias. Determining model parameters, however, is a tedious and lengthy process owing to the non-lineax interdependence of model parameters. Based on this hypothesis, an optimisation algorithm should be able automatically to generate arbitrary AP waveforms by fitting the most important channel conductances. Traditional gradient optimisation methods (AYYUB and MCCUEN, 1996) axe bound to fail in AP modelling optimisation, because channel dynamics are non-linear functions of voltage and time. In addition, the present models have over 30 coupled, highly non-lineax differential equations (NYGREN e t al., 1998). Genetic Algorithms (GAs) axe thus an obvious choice for optimisation, as they do not rely on derivatives. 561
GAs are probabilistic problem-solving systems and address the problem by combining directed and stochastic search techniques. They perform a multidirectional search by maintaining a population of potential solutions and encourage information exchange among the directions (MICHALEWlCZ, 1996). Because of the diverse applications of GAs, they have become a major focus of research (CHEN and GUAN, 2004; HUSSEIN and AL-GHAZALY, 2004; LEUNG et al., 2004; VIEIRA et al., 2004; DURANT et al., 2004). In this paper, a G A is developed that starts with a base ionic model and adjusts ionic conductances to produce the desired AP waveforms. Specifically, the Nygren model of the human atrial AP was used as the base. The G A was implemented to run in parallel over a distributed cluster. W e verified it by starting with random values and reproducing the Nygren model AP and then by fitting the Courtemanche (COURTEMANCHE e t al., 1998) model AP with the Nygren model as a starting point. Finally, the model was tuned to reproduce APs recorded experimentally from dog atrium. The advantages of fitting over several pacing frequencies are discussed, as well as the choice of stimulating pulse.
2 Methods
by the optimisation process. The rest of the conductances were held constant. The choice of fitting parameters was based on the importance of the respective current during the course of an AP. The sodium current, determined by the sodium permeability, defines the upstroke of the AP. I, (G,) is responsible for the initial repola~isation of the AP and controls the AP duration (APD). A balance between IcaL (GcaL) and Is,s (Gs,,) defines the plateau phase of the AP. GKR and GKS control the rate of final repolaxisation and significantly affect the APD. GK1 is important at the resting potential level, and the two background conductances ensure enough leakage calcium and sodium currents to stabilise the cell. Except for the N a - C a exchanger, the exchanger and pump currents play minor roles and therefore were not altered, kNaCa was not fitted, as this project was to establish the feasibility of the technique using only the channel conductances in fitting an arbitrary AP. To elicit an AP, two types of stimulus were used. The first was a rectangular current pulse, 1 ms wide and 1.5 times threshold, and is referred to as the standard pulse. The second type more accurately replicated experimental conditions and was based on the principles of AP propagation in a cable (HODGKIN and HUXLEY, 1952). The transmembrane current i.... is the net current leaving/entering a cell and is responsible for stimulating neighbouring cells. It is related to V,, through
2.1 Ionic m o d e l
1
The Nygren atrial cell model was used as the base model in our fitting method as it contains the major cardiac ionic currents and models intracellulax cellular handling. All concentrations except [Ca]i were held constant. One reason for choosing this model as the base was to investigate if a model with a triangular AP can closely reproduce a variety of AP morphologies only by changing conductances, as reported by NYGREN et al. (2001). The change in membrane potential V,,, per unit time in the Nygren model is given as follows:
02Vm
(2)
im -- - -ri + ro Ox2
where r i and ro are the intracellulax and extracellulax resistances per unit length, and, if the AP propagates in tissue as a plane wave with a velocity of 0, the stimulating current can be calculated from 1 O2Vm istim ~ (ri q- ro)O2 0t 2
(3)
IN, + IC,,L + It + 5 , , + IK1 + IK, + IKr +IBm, + IB,C, + IN,~ + I c . v +IN, c, -- I~tim -Cm
d~ dt
(1)
where the above equation includes N a + current IN,, L-type Ca 2+ c u r r e n t ICa, L , transient outward K + current I,, sustained outward K + current I,,,, delayed rectifier slow and rapid K + current /Ks and IK, and an inward rectifier K + current I,w, which are the main contributors to the AP. In addition, there axe C a 2+ and Na + - K + pumps (Ic,e and INaK) , a Na + - Ca 2+ exchanger (IN, c,) and Na + and Ca 2+ background leakage currents (IB,N, and IB, C,) to maintain the intracellulax ionic concentrations. I, ti,, is the stimulating current that is externally applied to initiate APs. C,, denotes the membrane capacitance. One permeability and eight maximum conductances, as shown in Table 1, were selected as parameters to be adjusted
Table 1
Conductance values in each parameter set. All conductances are in mS cm -2
Conductance PN, Gt Gc,c GKS
GKR GK1 Gsus GC,B
GN,B
562
The new pulsing protocol was implemented by using pulses that were scaled-down second-order temporal derivatives of the experimental V,,. The amplitude of the pulses was chosen to be 1.5 times threshold, thereby providing a safety factor as calculated by SHAW and RUDY (1997). This stimulus was referred to as a propagated impulse. Thus the propagated impulses were biphasic in nature, whereas the standard pulses were monophasic. Taking the second-derivative of experimental data and applying them directly created a noisy signal with a large variation in impulse amplitude. W e subsequently generated a noise-free version of the propagated impulse by visually selecting the best propagated impulse, isolating the positive portion and creating the negative portion by reflection, to balance charge. The new stimulus, referred to as the fabricated propagated impulse, was applied at the requisite stimulating frequency.
Definition
Minimum limit
Maximum limit
permeability of Na channel transient outward K conductance L-type Ca conductance slow delayed rectifier K conductance rapid delayed rectifier K conductance inward rectifier K conductance sustained outward K conductance background inward Ca conductance background inward Na conductance
1 x 10 -5 0.00 0.08 0.00 0.00 0.03 0.00 0.0011 0.0011
3.9 x 10 -5 0.40 0.23 0.24 0.03 0.07 0.06 0.0018 0.0018
Medical & Biological Engineering & Computing 2005, Vol. 43
stimulating frequencies, the fitness function was
2.2 GA Initially, we evaluated three GAs (simple GA, modified G A and G E N O C O P (MICHALEWICZ, 1996)) by fitting an AP, 25 times each, to establish the performance of each method. The desirable properties of the various GAs were then extracted. Details of the final G A (the GA) follow. For every iteration of the algorithm, the G A maintained a population of 100 potential solutions, known as chromosomes. The chromosomes for the first iteration, the parents, were generated by randomly choosing values from the physiologically possible search range for each conductance parameter to be fitted. This range (Table 1) was selected by trial and error and represented the maximum and minimum values of the conductance parameters for which the resultant waveform resembled an AP. The population was repeatedly updated according to the principles of natural evolution: selection, crossover and mutation. In the natural environment, the fitness of an individual determines its chances of survival. In GAs, a fitness function assigns a value to a chromosome based on model performance. The fitness was calculated as the sum of square errors (SSE) between the desired/experimental and computed data. W e calculated the computed data by plugging the parameter sets from the G A population into the Nygren model and simulating 10 s, long enough for any transients (especially Ca 2+) to subside. Our choice of 10 s was a compromise between reducing computation time and obtaining a fair estimate of ion imbalance. The last half-second of simulation data was compared with the desired data. To ensure the AP comparisons at all frequencies, the pulsing protocol for the 1 Hz frequency was designed to deliver the last pulse at 9550 ms. This would compare 50 ms of resting level, the APD and the resting level again. The fitness function used when fitting one stimulating frequency at iteration i was as follows:
f(i) =
(Vd[t] -- Vc[t]) 2
(4)
t=9501
where t = time, ms; Vd[t] = desired data at time t; and Vc[t] = computed data at time t. The time step for the fitness computation was 0.5 ms, chosen to match the experimental sampling rate. As it was not verified that a longer time step could provide reasonable results, we used this for all the simulations. This time step was sufficient to model phases 1 - 4 of the AP but was too large accurately to capture phase 0. This could be a key factor in improving AP overshoot fits and will be investigated in our next publication, where the effect of reducing it to 0.1 ms will be explored. For experimental data, the fitness function was modified so that one parameter set was found that fitted APs at several different stimulation frequencies. For each stimulation frequency, the initial conditions were reset, followed by pacing at the respective frequency for 9500 ms, and then the data from 9501 to 10000 ms were used. The SSE operation of the fitness function was also replaced by a sum of absolute differences to replace the more time-costly multiplication operations by only difference operators. In addition, a higher weight was given to the - 6 0 mV repolarisation level, as that point was used to estimate APD. The weight at - 6 0 mV was increased by factors of 10, 100, 1000 and 10 000, and the restitution curve results were compared. A factor of 1000 was found to generate the best results, as increases beyond this value placed too much significance on the point, and the rest of the waveform was ignored. For fitting multiple
Medical & Biological Engineering & Computing 2005, Vol. 43
4
f(i) = Z
10000
Z
W(Vd~stim't))lVd~stim't) -- Vc~stim,t)l
f i t ~ = l t=9501
(5) where
W(V) =
1000 1
for 1 7 < 0 , I V + 6 0 1 < 0 . 0 0 1 otherwise
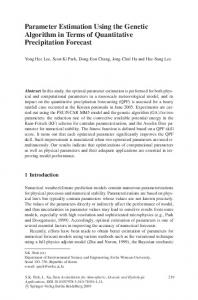
and fstim is the stimulation frequency. After fitness values had been computed for each chromosome, chromosomes were selected for mating using a roulette wheel selection function (MICHALEWlCZ, 1996), wherein selection probability was inversely proportional to the relative fitness value. All the parameters were converted into 32-bit binary vectors. The selected individuals then underwent genetic operations. A simple point crossover was the major genetic operator that was applied on a per conductance basis. For example, Gt of one set (Table 1) was combined with Gt of the second. During crossover, a random splicing point was chosen for both binary conductance parameters. This random point was generated in such a way that there was a higher probability of getting a low bit number to avoid drastic parameter changes. At the point, the two parameters were cut, and their tails were swapped to form two new parameters. Mutation of bits to their complement occurred with a probability of 25%. The mutation had an equal probability of affecting any bit in the chromosome. This was implemented to avoid the convergence to local minima, as there was no other way for the G A to detect and avoid such a convergence. In addition, an elitism function replaced the worst parameter set of every iteration with the best parameter set of the previous iteration. Finally, each newly generated parameter was tested to see if it was within its specified search space (Table 1). If a newly generated parameter was not within the search boundaries, it was assigned a random value from the search space, as provided in Table 1. This assignment was observed on average once every 7.2 iterations. The termination criterion for the fit was chosen as 100 iterations (in which case the average error of all the parameter sets between the two consecutive iterations differed by less than 10-4). The reported fitness result was the best fit value from the population, but it was not significantly different from the average error of all the population fitness results (Fig. 1). M e m o r y was not an issue for the GA, but the computation time was long. The computation of fitness values for the population was paxallelised, as it was the most time-consuming portion, and the calculations were performed independently, without interfering with the other processes (PACHECO, 1997). A message passing interface (MPI) with a m a s t e r slave architecture was used to parallelise the G A (CANTIJPAZ, 2000) over 20 Intel(R) Xeon 1400 M H z CPU processors running Linux. In this scheme, the process with rank zero played the role of the master, and the rest of the processes were slaves. For each iteration, the master sent the reference AP vector and five different parameter sets to all slave processes. Upon receiving this information, the slaves computed the fitness values of their designated parameter sets and sent them back to the master to be used for the selection and genetic operations. The parallelisation reduced the time for ten iterations from 6 h 52 min on a single processor to 2 h and 30 min.
563
loo
3 Results 3.1 Nygren-to-Nygren fit
09 10~ o .J
1
o
2'0
4'0 6'0 iteration number
80
1O0
Fig. 1 Nygren to Nygren convergence results for two typical simulations: (--) stimulation 1; ( - - - ) stimulation 2
W e verified the accuracy and precision of the G A by fitting the Nygren model to itself. Starting with randomised conductance values, the G A adjusted the parameters to match the AP of the unaltered model. Fig. 1 shows the results of two typical runs. Table 2 shows the average conductance parameter fits over five runs. The G A successfully converged to an SSE of 1.83 mV in five different simulations. These results indicated the accuracy and precision of the GA, reproducing the required values within 0.03% of the actual values, which was more than satisfactory. The variance between runs of the fitted values was also very low. The background calcium conductance showed the largest standard deviation but still remained very close to the correct value. Initially, only plateau and repobxisation phases of the AP were fitted, and therefore sodium permeability was not included in the parameter fitting. Later, fittings of different waveforms necessitated matching the upstroke, which was performed by adjusting PN,.
2.3 A P D and restitution curve computation
3.2 Nygren-to-Courtemanche fit
APDs were measured as the time between the m a x i m u m upstroke (dV/dt = 0) and the - 6 0 mV repolaxisation point. Restitution curves display behaviour over a wide range of input and can be constructed in many ways (VIGMOND and LEON, 2002). Because the objective of the study was only fitting and not dynamic behaviour characterisation, we used a simple S1-$2 protocol to construct the curve, delivering ten pre-pulses at 1 Hz, followed by test pulses at various diastolic intervals (Dis). Dis were taken as the time between 90% repolaxisation of the cell membrane potential to its resting level after the last pre-pulse and the delivery of the test pulse.
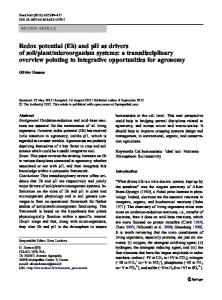
The next step in the verification process was to fit a noisefree AP that exhibited a different morphology from the base model. To this end, the Courtemanche human AP (COURTEMANCHE et al., 1998) was used to generate the desired AP. The Courtemanche AP possesses more of a spike-and-dome morphology as opposed to being triangular. Differences between the published Nygren and Courtemanche models axe presented in Fig. 2 and Table 3, and behavioural differences have been elaborated upon in detail (NYGREN et al., 2001). The Nygren AP exhibited a steeper initial repolaxisation phase compared with the Courtemmache model. The Courtemanche model contained a strong secondary depolaxisation phase that resulted in its dome configuration. The final repolaxisation phase was slower in the Nygren model, but the membrane potential reached the resting level faster than in the Courtemanche model. Table 3 can be summarised as follows: The APDs for all four frequencies were smaller than those of the Courtemanche model. In addition, the Courtemanche model showed a more negative resting potential than the Nygren model. In essence, the two models produced quite different APs, despite the fact that both of them represent atrial cells from the same species. Hence, the Courtemanche AP offered a good opportunity to investigate performance of the GA. Fig. 3a shows the final optimisation results for fitting the Courtemanche AP waveform with a stimulating frequency of 1 Hz. The resultant SSE was less than 69.3 mV. The GA-fitted model and the Courtemanche model paced at 2, 3 and 4 Hz were in good agreement. The typical conductance values for the best simulation run are given in Table 4, along with the original Nygren model values for comparison.
2.4 Experimental data The experimental data consisted of the APs recorded from tissue preparations of healthy canine atrial cells, collected in Dr S. Nattel's Laboratory at the Montreal Heart Institute. Canine right atrial tissues were perfused with Kreb solution through their coronary artery to mimic physiological conditions. The Kreb solution had the following concentrations (in mmol din-3): 145 N a +, 2.7 K +, 124 C I - , 1.25 Ca 2+ and 0.1 Mg 2+. Temperature was kept at 35°C throughout the experiment. APs were recorded with 3 mmol dm -3 KCl-filled glass micro-electrodes with resistances of 1 0 - 3 0 M ~ . The tissue was paced at 1, 2, 3 and 4 Hz for the AP recordings, with 0.5 ms resolution, using pClamp software. Details of the experimental methodology can be found elsewhere (KNELLER et al., 2002).
Table 2 Comparison of original Nygren conductances with average conductances of GA Nygren model fitting. Values are given to 6 significant digits to show difference in values even for smaller conductances such as GN,B. All conductances in mS cm -2
Conductance Gt GCaL GKS GKR GK1 Gs,s Gc,B
GNaB PN,
564
Nygren original value
GA value _+ SD
%error
0.15 0.135 0.02 0.01 0.06 0.055 1.57362 × 10 -3 1.21198 × 10 -3 3.2 × 10 .5
0.149986 _+ 0.000507 0.135001 __+0.000900 0.020000 + 0.000239 0.010003 + 0.006511 0.059996 + 0.008335 0.055000 _+ 0.000109 0.001574 -t- 0.000332 0.001212 _+ 0.000007 not used in fitting
0.009 7.4 × 10 -4 0.0 0.03 0.007 0.0 6 × 10 -4 0.0
Medical & Biological Engineering & Computing 2005, Vol. 43
40-
t \ , ,,
400 t
60
40
60.5
_80, ............
20-
4 _6 1
40 q
O"
E
d -80 , ~ , 4°oq
'...
"\ 92'85
L.C.L-
4q
-20-
\
X
92'7n 92'75 92'80
o-t
>
,.z
",.
r .....
7-.-~~
- -
,
2.z
--..-.-;-.---~,
- -
3 Hz
40\k
--80ff
-60-
i
-''~
";'N
40q
-80 7900
8000
81'00
82'00
83~00
84'00
85'00
8800
time, ms
i
.
9000
9200
9400
.... ~
.
9600
"1
4 Hz
9800
10000
time, ms
a
Fig. 2
( - - - ) Published Courtemanche model AP compared with (--) published Nygren model AP
290280-
The G A overshoot remained 4 mV more positive than the Courtemanche AP overshoot for the 1, 2 and 3 Hz pacing frequencies, with the difference increasing to 14 mV for 4 Hz simulations, despite a decrease in the sodium permeability. There was an increase of 103.68% in the transient outward conductance, the current that is responsible for the initial repolaxisation phase of the AP. The initial repolaxisation had a similar slope to that of the Courtemanche model for the 1 and 4 Hz stimulating frequencies; however, the Courtemanche AP had a slightly steeper rate of initial repolarisation at 2 Hz, which became more pronounced for 3 Hz stimulation. Courtemanche AP plateaus attained less positive values than the G A plateaus for all the frequencies. For example, the Courtemanche plateau for 1 Hz was 3 mV less positive than the G A plateau, with the difference increasing to 7.5 mV for 2 Hz and 14.3 mV for 3 and 4 Hz. The final repolarisation slopes of the G A APs were the same as those of the Courtemanche APs. The only difference was observed for the first 26 ms of the 3 Hz stimulation, when the G A model showed a steeper slope than the Courtemanche model. The same resting level for both APs indicated almost identical ionic conditions at the resting state (Table 3). Fig. 3b shows the restitution curves of the Courtemanche model and the G A model. The initial slope for both restitution curves was 0.4, but deviations began when the DI exceeded 150 ms; however, the m a x i m u m deviation was only 0.61%. In addition to the use of only a single pacing frequency for fitting, four frequencies were incorporated into the fit of
Table 3 Action potential properties of Nygren and Courtemanche models at four different frequencies. Values are recorded after 9.5 s of simulations. RL-resting level, APD-action potential duration at -60mV
Frequency
Parameter
Nygren
Courtemanche
GA-fitted
1 Hz
APD, ms RL, mV
210 - 74
255 - 74
259 - 74
2 Hz
APD, ms RL, mV
207 -71
246 -72
249 -72
3 Hz
APD, ms RL, mV
205 -68
222 -70
223 -70
4 Hz
APD, ms RL, mV
204 -63
200 -65
201 -65
270260-
~250
E 20o
> -40-60. . . . . . . . . .
- lt.a-1
80i
i
,
a
i
i
i
4020-
\
0%%
>
E ¢~ -20o -4060-80-
J \\,
9500
Fig. 4
96'00
97~00 98'00 time, ms b
99'00
10 ;00
Fitting results using one stimulating frequency. (a) Fitting of (--) experimental results by ( - - ) model using only 2 Hz stimulating frequency. (b) ( - - ) Action potential produced by model stimulated at 1Hz compared with ( ) experimental data. Conductance parameters were computed using only 2 Hz data
566
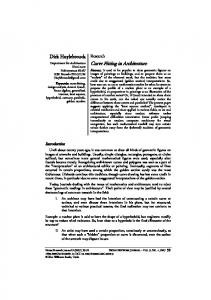
We also examined using propagated impulses for stimulating experimental data. The top graph of Fig. 5a shows the propagated impulse (second-order time derivative of the experimental data) at a 2 Hz stimulating frequency after the application of a moving average low-pass filter and the resultant AP. Owing to noise artifacts, fabricated propagated impulses (Fig. 5b) were used in the fitting. Fig. 5c shows the best fit resulting from this new pulse (broken line). Results with the fabricated propagated impulse were comparable with those with the standard pulsing protocol, with the difference between the fitness values obtained by the two stimuli being only 0.42% (the fabricated propagated protocol gave a lower fitness value). The chief difference was manifest during the overshoot, where the initial repolarisation produced a much better fit that was reflected in the I N , value. The upstroke phase of the fabricated pulse model overshot the experimental by only 3.6 mV as opposed to 14 mV. In addition, the initial slope of repolaxisation was more closely matched. The standard pulsing protocol, however, more accurately reproduced the final repolarisation phase. Four pacing frequencies and the standard pulsing protocol having been used, the approximate conductance parameters for the first experimental data set are given in Table 5, with the original conductance values from the Nygren model for comparison. There was a decrease of 0.0625% in the permeability of the sodium channels to account for a less positive overshoot of the experimental data. The initial repolarisation of the Nygren model had a steeper slope compared with the slope of the experimental data, which was compensated for by a reduction of 10.4% in the conductance of the transient outward potassium current. However, this decrease was counteracted in the final repolarisation phase of the GA AP by a significant increase in the conductance of both rapid and slow delayed rectifier currents. The experimental data had almost no plateau and could be explained on the basis of a smaller Ca 2+ channel conductance. Im conductance, important at the final repolarisation and the resting membrane potential, was also increased to fit the experimental data. Any increase in this conductance resulted in a more hyperpolarised membrane potential. Figs 6a and b represent the experimental and modelled APs at 1 and 2 Hz stimulating frequencies. We omit discussion of the 1 Hz stimulating frequency results because of the similarity between the two waveforms. The modelled upstroke overshot the experimental by nearly 5 mV, and the slope of the initial repolaxisation of the modelled data was also comparatively steeper. The GA APD was 6.1 ms shorter than the experimental APD. However, the final repolarisation slopes for the experimental and the GA AP were similar. Fig. 6c demonstrates fitted and experimental APs at 3 Hz. Despite an increase of 6.08% in the Im conductance, the
Medical & Biological Engineering & Computing 2005, Vol. 43
2O
>
0-
E d
-20-
-406080o
5'0 1;0 1;0 2;0 2;0
3;0 3;0 4;0 4;0 5;0
8
0.60.4-
T :~ 0.2~E
0
~g
o
-0.2-
0.40.65077
50'78 5079 5080 5081 5082 50'83 50'84 b
4020-
> E d
20-
0-
o>o 5-
20-
!
o -409545 9500i95559560 9565 60-
809500
96oo
97'00
98oo
9d00
10;00
time, ms c
Fig. 5
Comparison of propagated and standard impulses. (a) Top trace shows propagated impulse computed by taking second-order temporal derivative of 2 Hz experimental data and applying moving average low-pass filter. Bottom trace depicts AP resulting from using propagated impulse. (b) Fabricated propagated impulse. Negative portion of impulse is mirror image of positive part. These pulses were introduced at 1, 2, 3 and 4 Hz to obtain noise-free stimulation function. (c) Fits to (--) experimental set 1 using ( - - - ) fabricated propagated and (...... ) standard impulses. Inset shows AP upstroke peaks for three curves
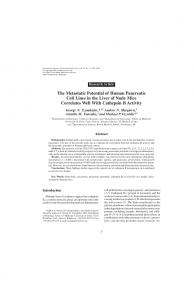
modelled APs exhibited a 4 mV depolaxisation in the membrane potential compared with the experimental membrane potential. The AP had similar morphologies, i.e. the upstroke, the slope of initial and final repolaxisation, and APD, for both the experimental and the G A model. Fig. 6d shows the simulation results at 4 Hz. The window of the fitness function covered 500 ms, which was long enough to compare two APs. Again, the modelled APs had a somewhat depolarised resting membrane potential of - 67 mV, compared with the experimental membrane potential of - 7 0 mV. The G A AP at 9600 ms ('first') was the same as the experimental AP. The experimental AP at 9850 ms ( ' s e c o n d ' ) had a more spike-and-dome morphology compared with the 'first' rectangular experimental AP. The phenomenon of alternating morphologies for high-frequency excitations is known as alternans (PASTORE et al., 1999; CHERRY and FENTON, 2004). The modelled APs at the start of 4 Hz stimulations exhibited some alternans, but, after 9.5 s of simulations, the cell reached a steady state in which no alternans were observed. As a result, the G A AP, rectangular in shape, failed to provide a good fit for the 'second' experimental AP with the spike-and-dome shape. The fitness error at 4 Hz was much worse, being an average of 8091 mV, compared with the average error at 1, 2 and 3 Hz of 5839 mV. A second experimental data set was used to evaluate fitting performance. A smaller sodium permeability and a decrease in the transient outward potassium current were obtained to compensate for a smaller AP overshoot and a slower initial repolarisation gradient. However, an elevated and prolonged plateau resulted in an increase in IcaL. There were substantial decreases in all repolaxisation currents for the final repolarisation phase (Table 5). The cumulative sum for all the fitness errors was an average of 13 433 mV. The simulation results for 1 and 2 Hz were almost the same; therefore only the 2 Hz AP properties axe discussed in detail. At 2 Hz, despite a lower sodium permeability, the G A AP overshot the experimental AP by 5 mV (Fig. 7a). The initial and final repolarisation gradients for the G A for both 2 and 3 Hz (Fig. 7b) were steeper than those of the experimental AP, but the APDs were similar. The resting membrane potential of the experimental data was 2 mV more hyperpolarised than that of the GA, and the upstroke peak overshot the experimental by 6 mV at 3 Hz. Fig. 7c shows the simulation results at 4 Hz, which indicate a 4 mV less depolarised resting potential of the G A AP. The upstroke of the 'first' experimental AP was 10 mV less positive than the G A upstroke. As before, heterogeneity was observed between the 'first' and 'second' experimental APs. 3.4 Restitution curves Fig. 8 shows the restitution curves obtained by the Nygren model and the G A models for the canine atrial data sets. The
Table 5 GA-fitted conductance parameters for experimental AP data sets 1 and 2. Values are given to 6 significant digits to show difference in values even for smaller conductances such as GNaB.All conductances are given in mS cm -2
Conductance PN, Gt Gc,L GKs GN,B Gc,B Gs,s Gm GKR
Nygren
Data set 1
%A
Data set 2
%A
0.000032 0.15 0.135 0.02 0.00121198 0.00157362 0.055 0.06 0.01
0.000030 0.134400 0.092001 0.117603 0.001544 0.001324 0.006010 0.063650 0.022800
6.25 10.4 31.85 -488+ 27.39+ 15.86-89.076.08+ 128+
0.000028 0.105635 0.160500 0.204113 0.001413 0.001292 0.003413 0.061254 0.004200
12.5 29.6 18.88+ 920+ 16.34+ 18.0293.822.08+ 58 --
Medical & Biological Engineering & Computing 2005, Vol. 43
567
40-
40-
20"
20-
0"
0-
20-
-20-
>o -40-
-40 -
-60-
60-
> E
-80-
-80 i
i
i
i
i
a
i
b
i
i
i
40-
2
> E
200-
-20-
20%.
o> 40-
40%.
60-
-60-
-809500
-8096'00
97'00
98'00
99'00
10600
time, ms C
Fig. 6
9 oo
9 oo
time, ms d
98~00
9900
10000
Comparison o f ( - - - ) GA generated AP with (--) canine data set 1. Parameters were fitted using all frequencies. Stimulation at (a) 1 Hz, (b) 2 Hz, (c) 3 Hz and (d) 4 Hz
restitution curves obtained for data sets 1 and 2 using the GA computed parameters were quite different from the restitution curves of the published Nygren model. However, the computed restitution curves for both experimental cells were virtually the same as each other, but shifted by 3 ms. A comparison between the modelled and real data was not possible, because the restitution curves for the experimental atrial cells were unavailable. All of the restitution curves exhibited maximum slope values significantly less than 0.52.
4 Discussion This study demonstrates that, using a genetic algorithm, it is possible to start with a given AP model and, by fitting conductance values, produce APs of a desired shape. The technique was verified to work with noise-free and experimental data. Details regarding performance are given in the following Sections. 4.1 Fitting results Using the Nygren model as its base and trying to recreate the Nygren AP from a random starting point, the GA produced conductance values that were within 0.03% of the original values, a more than acceptable, though not entirely surprising, fit. Fitting over several runs produced values that were very similar, indicating that all runs had headed toward the same minimum. The next stage of verification was to obtain the conductance values for an AP that exhibited a morphology different from that of the Nygren model, namely that of the Courtemanche
568
9soo
model. Using a stimulating frequency of 1 Hz, the GA was able to find parameter values that satisfactorily reproduced an AP resembling that of the Courtemanche model. With these same parameters, APs generated at 2, 3 and 4 Hz stimulating frequencies had the same final repolarisation gradient and resting level as the Courtemanche AP waveform. The differences in the plateau phases of the APs were due to the different sustained outward current formulation used in the two models. The Nygren model sustained outward current is a linear function of voltage and time, whereas that of the Courtemanche model is a cubic function. A restitution curve was also computed using an S1-$2 protocol that was within 0.61% of the Courtemanche restitution curve. NYGREN et al. (2001) demonstrated that a spike-and-dome AP morphology similar to the Courtemanche model AP can be produced using their triangular baseline AP model, by changing the size of the maximum conductance parameters. They decreased the size of the sustained outward current by 60% and increased the size of It, ICaL, II~r and/Ks by 100, 33, 200 and 200%, respectively (Fig. 3a, dotted line). The GA fitting results (almost overlapping broken and solid line in Fig. 3a) also indicated a decrease of 80.24% in the sustained outward current conductance. There was an increase of 103.68% in the maximum size of It, and Ic,L also increased by 36.55%. However, we did not observe any significant increases in the IKr and /Ks conductance values. The IK~ conductance was increased by 55.95%, and IK, was increased by 52.98%. Although the trends observed were the same, by using a GA, it was possible to obtain a closer fit. Fitting by hand, as has been traditionally performed, is a tedious process during which the model developer learns what characteristic each parameter
Medical & Biological Engineering & Computing 2005, Vol. 43
40-
220-
210-
20-
200-
0-
190E
> E
13
o
180-
170160150-
-60140 200 -80-
,:3
Fig. 8
400 ~ 600 ~ diastolic interval, ms
800 ~
10~00
Restitution curves for ( - - n - - ) Nygren model and GA models for experimental APs. (®) APD at four frequencies on Nygren curve. ( - - . - - ) Dataset 1; (--) data set 2
2
and the parameter sets can be compared with control to determine the drugs, effects. Both the identification of the channels affected, as well as the degree of effect, can be ascertained with the method.
>
E g
20-
o
> -40-
4.2 One stimulating frequency against f o u r stimulating frequencies
-60-
-80 I
I
I
I
I
b 40-
200>
E
-20-
o -406080-
9500
Fig. 7
96'00
97'00 98'00 time, ms c
99'00
10 ;00
Comparison o f ( - - - ) GA generated AP with (--) canine data set 2. Stimulation at (a) 2 Hz, (b) 3 Hz and (c) 4 Hz. Parameters were fitted using all frequencies
controls, eventually develops a feeling for how the parameters interact, and stops iterating when the results look, subjectively, 'good enough'. Using an optimisation method gives a precise, objective error measurement, allows for arbitrarily small improvements to the fit and can be automated. The experimental data posed a great challenge because of their noise and morphological heterogeneity. Several methods were tried to make the GA more robust for the experimental data. The GA was able to produce approximate models for the real canine APs. The conductance parameters produced were successful in producing APs at 1, 2, 3 and 4 Hz stimulating frequencies, with an average error of 14 780 mV. Because of its ability to fit APs by determining conductance values, the technique can be used to determine ion channel effects of drugs. This can be done by first finding the control set; the parameters to model the normal cell AP. Drugs can then be introduced, the corresponding APs can be modelled, Medical & Biological Engineering & C o m p u t i n g 2005, Vol. 43
The GA was modified to use all available experimental data at various stimulating frequencies. The results improved by an average of 6.7%, compared with the results obtained for fitting data for one stimulating frequency only. This comparison was made by comparing the error at the same frequency (1 Hz) that was used for the first fitting procedure. Fits from a 1 Hz stimulating frequency did not closely reproduce experimental results when paced at other frequencies. In addition, the noisy nature of the experimental data necessitated comparing a larger number of points than the ideal modelled data. Because of this behaviour, it was necessary for the experimental data fittings to use four stimulating frequencies. Fitting at several stimulating frequencies is vital if the AP models axe to be used in re-entry studies in which cells are activated over a range of frequencies. The behaviour of some currents can become suppressed at certain rates, leading to fits that over-emphasise other currents, limiting usefulness to a narrow pacing frequency range. Furthermore, fitting only the restitution curve is inadequate, as the AP shape must be replicated and not just APD (CHERRY and FENTON, 2004). The GA with all four frequencies was also used in the model data fitting for comparison. The results were unchanged, but there was an increase in the CPU time. The results suggested that, for fitting a modelled AP that was noise-free, only one frequency AP was needed. The redundancy proved useful when the AP waveform was noisy or exhibited alternans, as in the case of the experimental recordings. 4.3 Propagated against standard impulses For experimental data fitting, a new technique was introduced in the stimulation pulse of the Nygren model. The pulse was changed from a rectangular pulse with an amplitude 1.5 times threshold to the second-order derivative of Vm. Based on cable theory, which is equivalent to planar wavefront propagation, the scaled second derivative of the experimental APs was used for stimulation. This is very different from a rectangular pulse that is all depolaxising. The second derivative is biphasic. Thus, owing to current sources from adjacent depolarising cells the initial depolarising portion is followed by a hyperpolarising portion, owing to the current sink of adjacent, less excited cells. The hyperpolarising portion serves to 569
decrease the overshoot in addition to increasing the initial rise, as the AP must be well started before the de-excitatory second half of the stimulus. Taking the second-order derivative of the experimentally recorded signal resulted in a signal with a large variance, as high-frequency artifacts were amplified. Even with the application of a low-pass moving average filter, the second-order derivatives for the 4 Hz pacing frequency resulted in a sequence resembling white noise. Because of this extra noise in the current pulses, 68.3% of the simulations using propagated impulses resulted in more erroneous results than those using standard impulses. Noise-free fabricated propagated impulses were also used to stimulate the model during fitting. The best result obtained using this method was only 0.42% better than the results obtained using standard pulses when the whole AP was considered. The main difference was a much better fit at the upstroke and the initial repolaxisation for the fabricated propagated impulse protocol; however, the standard protocol performed better at the final repolaxisation level. The upstroke is important in determining propagation of the AP and computing extracellulax potentials; therefore, if these are concerns, the fabricated propagated protocol should be the method of choice for the fitting procedure. 4.4 Generalised GA So fax, we have only shown the feasibility of using such an algorithm automatically to compute conductance parameters for atrial APs. A similar approach can be taken to obtain important current parameters for other types of cardiac cell, which include the Purkinje and ventricular cells. For example, if we were to use the GA for Purkinje cells, we would have to include Ij; the hyperpolarising activated current. 4.5 Limitations We only fitted channel conductance values and permeability and did not incorporate any other model parameters, such as exchanger and pump current parameters, time constants, saturation values, rates or concentrations. Any of these parameters could have been incorporated into the fitting algorithm. As the GA does not require gradient information, or even any knowledge of the underlying system beyond a fitness value, there axe no laborious mathematical computations required for adding a new parameter to be fitted. The chromosomes merely become bigger, with a corresponding increase in the number of iterations before convergence is reached. From our experience in the study, going from fitting four parameters to fitting eight parameters increased convergence from ten to 70 iterations. This study was primarily intended to demonstrate the feasibility of the method, and so the most obvious and important parameters were fitted. Discrepancies with the desired waveforms could have come from not including all appropriate model parameters. In the future, more parameters will be added to the list of what is fitted. The time step used in this fitting protocol was 0.5 ms, which is rather large accurately to model the upstroke phase of the AP. The overshoot fitting could have been better if there were more points to fit. A smaller time step was not implemented because the available experimental data were digitised at 0.5 ms. The fittings could significantly improve if a smaller time step were incorporated, even if only during the upstroke For the experimental data, the GA was not able properly to model the upstroke phase. We used propagated impulses and adjusted the sodium permeability but did not try altering the reversal potentials. This could be a contributing factor leading to a bad fit during the upstroke. Furthermore, the
570
fits could have benefited from the inclusion of dV/dtm~x in the fitting. We only fitted the transmembrane voltage, albeit at various pacing frequencies. There axe other observable quantities that are also very important, with intracellulax [Ca 2+] chief among them. [Ca2+]i also has an impact on membrane transport, as many mechanisms are [Ca2+]-dependent. It is straightforward to modify the fitness function to include a term that compares desired with computed [Ca2+]i. Only different frequencies were used in the fitting in an attempt to obtain a better restitution curve fitting. Fitting the restitution curve on its own could have resulted in better restitution curve fits, at the expense of AP morphology. An important characteristic of restitution curves is the non-zero minimum DI and its associated APD, which can strongly affect the tissue dynamics. Controlling these two parameters during the fitting process could have benefited the overall shape of the AP waveform.
5 Conclusions The GA developed for this paper can be used automatically to determine conductance parameters capable of reproducing a desired waveform for atrial cells. Experimentally derived models benefit from stimulation with fabricated propagated impulses and fitting over several different pacing frequencies, whereas one pacing frequency is sufficient for noiseless data. These automatically generated AP models produced electrical characteristics, such as AP changes at different stimulating frequencies and restitution curves, that matched those of the desired systems very well.
Acknowledgments--This work was supported by the Mathematics of Information Technology & Complex Systems (MITACS), the Canadian Institutes of Health Research & Natural Sciences and Engineering Research Council of Canada (NSERC). The authors are especially grateful to Dr Anders Nygren for his time and comments.
References AYYUB, B. M., and McCUEN, R. H. (1996): 'Numerical methods for engineers' (Prentice Hall, Upper Saddle River, New Jersey, 1996), pp. 61 77 CANTI2-PAZ,E. (2000): 'Efficient and accurate parallel genetic algorithms' (Kluwer Academic Publishers, Norwell, Massachusetts, 2000) CHEN, Q., and GUAN, S.-U. (2004): 'Incremental multiple objective genetic algorithms', IEEE Trans. Syst. Man Cybern. B, Cybon., 34, pp. 1325 1334 CHERRY, E. M., and FENTON,F. H. (2004): 'Suppression of altemans and conduction blocks despite steep APD restitution: electrotonic, memory, and conduction velocity restitution effects', Am. J. Physiol. Heart Circ. Physiol., 286, pp. H2332 H2341 COURTEMANCHE,M., RAFAEL,J. R., and NATTEL, S. (1998): 'Ionic mechanisms underlying human atrial action potential properties: insights from a mathematical model', Am. J. Physiol., Heart Circ. Physiol., 44, pp. H301 H321 DURANT, E. A., WAKEFIELD, G. H., TASELL, D. J. V., and RICKERT, m. t . (2004): 'Efficient perceptual tuning of hearing aids with genetic algorithms', IEEE Trans. Speech Audio Process., 12, pp. 144 155 FENG, J., YUE, L., WANG, Z., and NATrEL, S. (1998): 'Ionic mechanisms of regional action potential heterogeneity in the canine right atrium', Circ" Res., 83, pp. 541 551 HERRERA,F., and LozANo, M. (2000): 'Gradual distributed real-coded genetic algorithms', IEEE Trans. Evol. Comput., 4, pp. 43 63 Medical & Biological Engineering & Computing 2005, Vol. 43
HODGKIN, A. L., and HUXLEY, A. F. (1952): 'A quantitative description of membrane current and its application to conduction and excitation in nerve', J. Physiol., 117, pp. 500 544 HUSSEIN, Y. A., and EL-GHAZALY, S. M. (2004): 'Modelling and optimization of microwave devices and circuits using genetic algorithms', IEEE Trans. Microw. Theory Tech., 52, pp. 329 336 KNELLER, J., ZOU, R., VIGMOND, E. J., WANG, Z., LEON, L. J., and NATrEL, S. (2002): 'Cholinergic atrial fibrillation in a computer model of a two-dimensional sheet of canine atrial cells with realistic ionic properties', Circ" Res., 90, pp. E73 87 LEUNG, F. H. F., LAM, H. K., LING, S. H., and TAM, P. K. S. (2004): 'Optimal and stable fuzzy controllers for nonlinear systems based on an improved genetic algorithm', IEEE Trans. Indust. Electron., 51, pp. 172 182 LIU, X. K., JAHANGIR,A., TERZIC, A., GERSH, B. J., HAMMILL, S. C., and SHEN, W. K. (2004): 'Age- and sex-related atrial electrophysiologic and structural changes', Am. J. Cardial., 94, pp. 373 375 MICHALEWICZ, Z. (1996): 'Genetic algorithms + data structures = evolution programs' (Springer-Verlag, Berlin, Heidelberg, New York, 1996), pp. 1 177 NYGREN, A., FISET, L., CLARK, J. W., LINDBALD D. S., CLARK, R. B., and GILES, W. R. (1998): 'Mathematical model of an adult human atrial cell the role of K + currents in repolarization', Circ'. Res., 82, pp. 63 81 NYGREN, A., LEON, L. J., and GILES, W. R. (2001): 'Simulations of the human atrial action potential', Phil Trans. R. Sac. Land. A, 359, pp. 1111 1125 PACHECO, P. S. (1997): 'Parallel programming with MPI' (Morgan Kaufmann Publishers Inc., San Francisco, California, 1997) PASTORE, J. M., GIROUARD, S. D., LAURITA,K. R., AKAR, F. G., and ROSENBAUM, D. S. (1999): 'Mechanism linking T-wave alternans to the genesis of cardiac fibrillation', Circulation, pp. 1385 1394 RAMIREZ, R.J., NATrEL, S., and COURTEMANCHE, M. (2000): 'Mathematical analysis of canine atrial action potentials: rate, regional factors, and electrical remodelling', Am. J. Physiol., Heart Circ. Physiol., 279, pp. H1767 H1785 SCHRAM, G., POURRIER, M., MELNYK, P., and NATTEL, S. (2002): 'Differential distribution of cardiac ion channel expression as a basis for regional specialization in electrical function', Circ'. Res., 90, pp. 939 950
Medical & Biological Engineering & Computing 2005, Vol. 43
SHAW,R. M., and RUDY,Y. (1997): 'Ionic mechanisms of propagation in cardiac tissue: roles of the sodium and L-type calcium currents during reduced excitability and decreased gap junction coupling', Circ'. Res., 81, pp. 727 741 VIEIRA, D. A. G., ADRIANO, R. L. S., VASCONCELOS, J. A., and KRAHENBUHL,L. (2004): 'Treating constraints as objectives in multiobjective optimization problems using niched Pareto genetic algorithm', IEEE Trans. Magnetics, 40, pp. 1188 1191 VIGMOND, E. J., and LEON, L. J. (2002): 'The effect of ionic current modulation on restitution curves and the onset of fibrillation in a simulated block of cardiactissue', Camput. Visual. Sci., 4, pp. 237 247
Authors" biographies ZAINAB SYED is currently pursuing a PhD at the University of Calgary. Her research interests are cardiac modelling and electrophysiology. EDWARD J. VIGMONDreceived his PhD degree from the University of Toronto, in 1997. He is an Assistant Professor with ECE in the University of Calgary, where he is involved in the modelling of biological electrical activity. His research interests include numerical computation of electrical fields, coupling of biological oscillators and modelling of non-linear biosystems. STANLEY NATTEL received an MD, in 1974. He has been the PaulDavid Chair in Cardiovascular Electrophysiology since 2003. His research interests focus on the fundamental mechanisms of cardiac arrhythmias and the exploitation of novel mechanistic insights to develop innovative approaches to the treatment and prevention of cardiac rhythm disorders. JOSHUA LEON received his PhD in Biophysics, in 1987. He started his career at the Institute of Biomedical Engineering. In 2000, he moved to the University of Calgary and became Head of ECE Department in 2002. In 2005, he became Dean of the Faculty of Engineering at Dalhousie University. He has been an active researcher in the field of cardiac electrophysiology for the past 20 years. He has used various modelling and experimental techniques to examine the mechanisms of the genesis and termination of arrhythmias.
571