This article has been accepted for publication in a future issue of this journal, but has not been fully edited. Content may change prior to final publication. Citation information: DOI 10.1109/JBHI.2017.2688473, IEEE Journal of Biomedical and Health Informatics IEEE JOURNAL OF BIOMEDICAL AND HEALTH INFORMATICS 2017
1
Atrial Fibrillation Detection via Accelerometer and Gyroscope of a Smartphone Olli Lahdenoja1 , Tero Hurnanen1 , Zuhair Iftikhar1 , Sami Nieminen1 , Timo Knuutila1 , Antti Saraste2 , Tuomas Kiviniemi2 , Tuija Vasankari2 , Juhani Airaksinen2 , Mikko P¨ank¨aa¨ l¨a1 , Tero Koivisto1
Abstract—We present a smartphone-only solution for the detection of Atrial Fibrillation (AFib), which utilizes the builtin accelerometer and gyroscope sensors (Inertial Measurement Unit, IMU) in the detection. Depending on the patient’s situation, it is possible to use the developed smartphone application either regularly or occasionally for making a measurement of the subject. The smartphone is placed on the chest of the patient who is adviced to lay down and perform a non-invasive recording, while no external sensors are needed. After that, the application determines whether the patient suffers from AFib or not. The presented method has high potential to detect paroxysmal (”silent”) AFib from large masses. In this paper, we present the pre-processing, feature extraction, feature analysis and classification results of the envisioned AFib detection system based on clinical data acquired with a standard mobile phone equipped with Google Android OS. Test data was gathered from 16 AFib patients (validated against ECG), as well as a control group of 23 healthy individuals with no diagnosed heart diseases. We obtained an accuracy of 97.4% in AFib vs. healthy classification (a sensitivity of 93.8% and a specificity of 100%). Due to the wide availability of smart devices/sensors with embedded IMU, the proposed methods could potentially also scale to other domains such as embedded body-sensor networks. Index Terms—Atrial Fibrillation, Smartphone, Application, App, Seismocardiography, SCG, Ballistocardiography, BCG, Accelerometer, Gyroscope, Inertial Measurement Unit, IMU
I. I NTRODUCTION
I
N this work, we consider the accurate detection of atrial fibrillation (AFib) with modern microelectromechanical (MEMS) accelerometers and gyroscopes embedded into modern smartphones. Previously, smartphone based AFib detection has been proposed through the camera of the smartphone while illuminating the user’s finger with the camera flash (PPG, photoplethysmography) [1]. Our approach is also based on smartphone, while the acquisition of the heart signal is made in an alternative way. The patient is adviced to lie down in a supine position and the smartphone is placed on the chest of the patient. This way, the inertial measurement unit (IMU) is used for unconventional purpose (typically IMU is used for determining the orientation of smartphone) namely for registering the tiny cardiogenic micromovements of the patient’s chest. A measurement with similar duration as in camera based measurement is taken (approximately 2 minutes) with the already available MEMS sensors within the smartphone. We have previously found out that also the gyroscope has the potential to add robust information to the (1) Department of Future Technologies, University of Turku, Finland email:(
[email protected]) (2) Heart Center, Turku University Hospital, Turku, Finland.
heart signal [2]. Therefore we use both the accelerometer and the gyroscope for signal acquisition. AFib is one of the most common heart arrhythmia which occurs in approximately 2% of the global population, prevalence being dependent on factors like sex, age and country [3], [4]. It is also major cause of stroke, heart failure and other comorbidities. Occurrence of AFib increases the risk for a stroke, since a blood clot may form and convey into brain. Up to 90% of intermittent AFib episodes are asymptomatic and therefore a vast number of AFib cases remain unnoticed. Strikingly, acute stroke is relatively often the first sign of AFib. It has been estimated that around 70% of strokes due to AFib could be avoided with pre-emptive medication [5]. Large scale screening of ”silent” AFib has been proposed as a way to reduce the stroke risk from persons suffering from asymptomatic AFib. The challenge is that most of the current methods are either too costly or incovenient for extensive long-term screening of whole population or higher risk age groups (60 years and above). A smartphone solution could thus provide cost-efficient means to screen these persons from the population. As the probability of having AFib increases with age, for example in the US, the prevalence of AFib is expected to more than double in the next 50 years as the population grows older [6]. It has been estimated that currently the medical cost caused by AFib is $26 billion annually in US only [7]. Thus, the financial impact of efficient AFib prevention can be significant. The hospitalization rate due to AFib is concentrated on the east coast of the US thus the costs are not equally divided [8]. A. Related work PPG is based on measuring the blood volume changes through the skin capillary bed optically (typically fingertip) [9]. The measurement is carried out by illuminating the skin e.g. with a light-emitting diode (LED) and measuring the changes in light absorption. The previous implementations of smartphone based AFib detection have relied on the same principle while using the flash of the smartphone camera to illuminate the finger of the user and capturing a video of the color changes in the patient’s finger. Although this is a common approach, the method needs to handle variations in fingertip placement - which may be a challenge, especially to elderly people [10] - and camera focus, which may have a negative effect on the signal acquisition. Furthermore, while the video recording approach is suitable for short term measurements it is not well suited as such for long-term continuos
2168-2194 (c) 2016 IEEE. Translations and content mining are permitted for academic research only. Personal use is also permitted, but republication/redistribution requires IEEE permission. See http://www.ieee.org/publications_standards/publications/rights/index.html for more information.
This article has been accepted for publication in a future issue of this journal, but has not been fully edited. Content may change prior to final publication. Citation information: DOI 10.1109/JBHI.2017.2688473, IEEE Journal of Biomedical and Health Informatics IEEE JOURNAL OF BIOMEDICAL AND HEALTH INFORMATICS 2017
monitoring of AFib in body sensor networks due to issues such as power consumption. There exist also smartphone/tablet based ECG devices and embedded devices, which can be used to detect a variety of heart conditions, including AFib [11]–[13]. However, also in the case of smartphone based ECG there is generally a need for physical contact to the subject’s skin, which may require electrodes potentially irritating the skin as well as other hardware and wires. In [14], an ECG-based screening system (AliveCor) was proposed for screening of AFib, which was embedded to a smart casing of the smartphone. The user presses the electrodes within the casing with two fingers (from different hands) and performs a short measurement, which is then modulated and transmitted through an ultrasonic interface to the smartphone and eventually processed automatically. Despite of being a promising system, also this method still requires extra hardware in order to be applied. Seismocardiography (SCG) [15] is a non-invasive method based on measuring cardiogenic accelerations of the chest. Although considered as a promising approach, the utilization of SCG has not reached the level of ECG. The research concerning SCG has recently still gained more popularity. The emergence of modern MEMS accelerometers with tiny physical dimensions (for instance 2mm × 2mm or less) have increased interest towards this method. Ballistocardiography (BCG) [16], [17] is based on measuring the whole body movements induced by heart movements with an accelerometer. Typically the sensor is attached below the user into a bed, a chair, or a scale. As an example of BCG, we would like to mention non-invasive sleep monitoring [17], which user interface was implemented on a smartphone. Recent advances in seismo- and ballistocardiography have been reviewed in [18]. SCG-based methods are sometimes referred as BCG since the terminology is not very well-established. SCG has been proposed to monitoring left ventricular function during ischemia in [19] and measuring heart rate variability [20], [21]. Long-term SCG has been proposed as a non-invasive method to monitor ambulant subjects [22]. The potential of SCG-based monitoring using smartphones (and potentially other smart devices, for instance Google Glass) have been recently studied in [23]–[26]. Detection of AFib with ballistocardiography has been previously proposed in [27], and detection of AFib with seismocardiography in [28]–[30]. We extend here the work of [30], where a single accelerometer axis of a custom built ECG/SCG board was used to separate between AFib and normal conditions (acquired before and after cardioversion). The application field proposed in this paper is to extend to smartphones and we describe a stand-alone App for AFib detection, which takes advantage of all available accelerometer and gyroscope axes. In addition, we derive a large number of new features in order to improve the performance of the AFib detection in comparison with [30] and extend to (multiple) other and more advanced classifiers for separation between AFib and normal conditions. In comparison with [27], where the AFib detection was applied using ballistocardiography during sleep/bed measurements, our approach has some similarities but the application field
2
is different, as we are utilizing a smartphone-only solution for the screening of AFib using short-term measurements without any extra hardware. B. Patient protocol The data collected for this study consists of 16 data recordings of a duration of a few minutes (typically less than five minutes) taken from AFib patients at hospital settings. Additional data was captured from a control group of 23 healthy individuals, taken at the premises of Technology Research Center, University of Turku, Finland. In both cases, the subjects were adviced to lie in a supine position, while a smartphone measurement was taken by placing a standard Sony Xperia Z-series smartphone on the chest of the patient. A dedicated data collection application used was responsible for the data acquisition. The data acquisition was initiated and terminated by pressing a button on the screen of the smartphone. The patient tests were carried out at Turku Heart Center, Turku University Hospital, Turku, Finland. The research protocol was approved by the Ethical Committee of the Hospital District of the South-Western Finland. The requirements for the inclusion of a patient for the study were: • •
•
minimum age 18 years; the patient was an authorized representative of him-/herself and willing to agree and sign a written informed concent approved by the ethical review board; and AFib was diagnosed from the patient via other standard modality such as ECG.
The criteria for the exclusion of the patient from the study were: • the patient suffered from any additional health problems that would, in the view of the investigator’s opinion, interfere the patients optimal participation to the study; • age under 18 years old; • unwillingness or unability of using a smartphone; or • the patient suffered from severe memory problems. No information which could be used to identify the patient was stored to the memory of the smartphone. After data gathering, the data was transferred to a desktop personal computer to be used for the development and validation of the detection algorithms reported in this work. The acquisition of the data did not affect to the quality of care that the patient received in any way. The condition of the AFib patients was determined by simultaneous ECG during the smartphone measurements. As a control group we acquired healthy volunteers with no diagnosed heart diseases. In Table I a demographic table of the two patient groups is shown. II. S IGNAL P RE - PROCESSING A. Background for feature generation ECG-based AFib detection is a well established technique which is based on the detection of the absense of the so called P-wave in electrocardiogram. The P-wave represents atrial depolarization, which precedes atrial contraction. Additionally, irregularity of successive RR intervals in the time (or
2168-2194 (c) 2016 IEEE. Translations and content mining are permitted for academic research only. Personal use is also permitted, but republication/redistribution requires IEEE permission. See http://www.ieee.org/publications_standards/publications/rights/index.html for more information.
This article has been accepted for publication in a future issue of this journal, but has not been fully edited. Content may change prior to final publication. Citation information: DOI 10.1109/JBHI.2017.2688473, IEEE Journal of Biomedical and Health Informatics IEEE JOURNAL OF BIOMEDICAL AND HEALTH INFORMATICS 2017
AFIB PATIENTS MEAN MIN MAX STD UNIT
AGE 71.4 44 89 12.3 (years)
HEIGHT 170 150 190 12.0 (cm)
WEIGHT 76.9 45 108 17.3 (kg)
BMI 26.1 20.0 33.6 3.89 (kg/m2 )
3
CONTROL GROUP MEAN MIN MAX STD UNIT
AGE 31.4 23 53 7.85 (years)
HEIGHT 180 172 190 4.65 (cm)
WEIGHT 82.4 61 125 15.9 (kg)
BMI 25.5 20.5 38.1 4.39 (kg/m2 )
TABLE I D EMOGRAPHIC TABLE OF AF IB PATIENTS AND CONTROL GROUP ENROLLED TO THE STUDY. T HE TOTAL NUMBER OF PERSONS IN AF IB GROUP WAS 16 (11 MALES ) AND IN CONTROL GROUP 23 ( ALL MALES ). T HE HEIGHT OF THREE PERSONS IN AF IB GROUP WAS NOT REGISTERED AND THOSE ARE LEFT OUT FROM THE CALCULATIONS OF THIS TABLE .
frequency) domain can be used as cues to detect AFib using ECG. The RR interval is defined as the time interval between two successive R-peaks of the ECG (R-peak being the most prominent peak in ECG). A good fingerprint of AFib is that the beat timings in ECG are irregularly irregular. We use the ECG based AFib detection methods as a starting point for developing IMU-based techniques for the detection of AFib. We hypothesize that the beat-to-beat irregularity present in ECG will also be present in the IMU signal. As R-peaks do not exist in the SCG or GCG signal, some other fiducial points must be used instead. Because the AO (aortic opening) is usually the most prominent peak in SCG/GCG it is natural choice to be used as a reference. The respective AO-AO interval determines the beat interval in the case of SCG/GCG. It should be noted that the R-R and AO-AO intervals are not equal since the electromechanical delay is not constant [29]. For consistency, the term RR interval is used in this paper for the AO-AO interval also. In addition to the timing of the beats, we also use other indicators related to the shape and the randomness of the heart signal as potential features for the detection of AFib [29], [30]. The randomness indicators essentially measure the periodicity and shape of the heart signal. B. Filtering and motion artifact removal The pre-processing and feature extraction steps described in this section contain a review of earlier work implemented with a custom combination of accelerometer and ECG processing platform [30]. Due to changes in the implementation of the feature extraction (for example, the change in sampling frequency from 800 Hz in [30] to approximately 200 Hz of the smartphone), these methods are discussed in the context of the smartphone application. Also, in [30], a single accelerometer axis was used to represent the data, whereas in this paper we use six data channels corresponding to three accelerometer and three gyroscope axes. The features represented in [30] are further supplemented by multiple new features. The signal processing pipeline starts with filtering the data (all accelerometer and gyroscope axes) by a bandpass brickwall filter with pass-band frequencies between 1 Hz and 45 Hz (each axis separately). Although the heart rate may be lower than 60 bpm, the majority of the spectrum of heart-related SCG is still above 1 Hz. The purpose of this step is to remove the noise, bias of the signal and to emphasize the actual cardiac vibration signal. For accelerometer Z (ACC-Z) data channel, a sliding window RMS (root mean square) filter is applied to capture the
energy envelope of the data. If the RMS filtered signal exceeds the median value of the whole signal (in ACC-Z axis) more than an empirically set threshold value, the corresponding section of the signal is declared as an artifact and it is removed from the data [30]. The smartphone is placed on the chest of the patient loudspeaker towards the head and display up so that the ACC-Z channel is parallel to the force of gravity when a person is in supine position. The justification for using ACCZ axis is that it has been observed to provide good signal quality in our previous studies [30], [31]. As a result, the temporal correspondence of all channels is maintained in the motion artifact removal step. After the noise removal has been completed the algorithm divides the artifact-free signal into constant length (10 seconds) 6-channel segments for further processing and feature extraction. III. F EATURE E XTRACTION In order to distinguish between AFib and healthy individuals we hypothesize that the following types of features could be helpful. First, heart rate (HR) and heart rate variability (HRV) differ between these two cases [32], and by calculating the actual AO-AO or RR interval in SCG it is assumed that an estimation for these features can be obtained, despite that the ECG’s RR intervals and SCG’s AO-AO intervals are not exactly the same. Second, entropy - either approximative entropy [33], or spectral entropy [30], could provide discrimination, since they measure the self-similarity and the distribution of the spectral content within the signal. As the signal waveform becomes more irregular and aperiodic in AFib, the entropy measures could capture the intrinsic change in the waveforms. Third, turning-point-ratios (TPR) have been used as measures of the complexity of the signal waveform in terms of statistical significance testing, and they have also been previously used to detect AFib in ECG [12]. By using the above mentioned methods, some of which already in use in ECG based AFib detection, we hypothesize that the discrimination between the two classes could be obtained in a supervised manner. In Table II a list of the selected features is shown. A. Heartbeat detection We apply short-term autocorrelation for the pre-processed data segments. This means that multiple autocorrelation windows (we use the term window with autocorrelation) are extracted from the input data specific to a certain axis. By calculating the time-domain autocorrelation and by extracting the
2168-2194 (c) 2016 IEEE. Translations and content mining are permitted for academic research only. Personal use is also permitted, but republication/redistribution requires IEEE permission. See http://www.ieee.org/publications_standards/publications/rights/index.html for more information.
This article has been accepted for publication in a future issue of this journal, but has not been fully edited. Content may change prior to final publication. Citation information: DOI 10.1109/JBHI.2017.2688473, IEEE Journal of Biomedical and Health Informatics IEEE JOURNAL OF BIOMEDICAL AND HEALTH INFORMATICS 2017
# 1
SP ENT
2
HRV
3
HR
4
TPR1
5, 11-14
TPR2, 4-7
6, 15-18
TPR3, 8-11
7
RRI-TPR
8
AP EN
9
HRV2
10
HRV3
Description SPECTRAL ENTROPY - calculated by entropy of the signal FFT at frequency range of [1 Hz 11Hz] HEART RATE VARIABILITY - calculated by extracting the differences between the consecutive RR intervals, which have been obtained with autocorrelation HEART RATE - calculated as the median of the absolute values of RR intervals (RR intervals obtained with autocorrelation). Unit: sample count @ 200 Hz TURNING POINT RATIO extracted from the pre-processed signal (measures the number of consecutive runs in the signal) TURNING POINT RATIO - calculated from a bandpass filtered signal with an additional absolute value operation during the filtering (with different passband ranges applied) TURNING POINT RATIO - calculated from a bandpass filtered signal without the absolute value operation (with different passband ranges) TURNING POINT RATIO - TPR calculated directly from the extracted RR intervals obtained with autocorrelation (within a signal segment) APPROXIMATE ENTROPY is calculated by matching of short signal segments of the subsampled signal to each other and by calculating a logarithmic entropy HEART RATE VARIABILITY 2 - a higher order HRV calculated using an additional difference extraction step (applied to the RR interval series) HEART RATE VARIABILITY 3 - higher order HRV calculated with an additional absolute value and difference extraction step applied to the RR interval time series TABLE II
T HE NUMBER ,
ABBREVIATION AND DESCRIPTION OF EACH FEATURE . T HE SAME FEATURES ARE CALCULATED FROM EACH AXIS SEPARATELY.
locations of its prominent peaks we obtain the RR intervals of the IMU signal for each axis [30]. By using the sampling rate of approximately 200 Hz of the smartphone, and a window size of 2.5 seconds, the total amount of input samples for a single autocorrelation becomes 500 samples [30], [34]. Overlapping (overlap of 1.5 seconds) autocorrelations are repeated in 1 second intervals over the full duration of the signal segment (in this case of 10 seconds). From one signal segment (of length 10 seconds) we obtain eight RR intervals. This is because the centers of the autocorrelation windows locate 1.25 seconds apart from the borders of the signal segment and 1 second apart in the middle of the signal segment. The eight RR intervals returned by the algorithm are denoted as RR(1):(8) .
4
The difference operator D is defined as RR(i) -RR(i−1) across the whole signal, and it returns the differences between the values of the consecutive elements. The justifications for using the median instead of mean is its tolerance to outliers. The first generated feature set consists of heart rate (HR) and heart rate variability (HRV) which are attained from the RR interval series. The features that we use are rather simple in comparison with more sophisticated measures as in [32], but allow a more efficient implementation. HR (HR) is calculated as the median of RR(1):(8) and HRV (HRV1 ) is calculated as MEAD(RR(1):(8) ). Furthermore, we use two higher order HRV estimates which are calculated from second order differences MEAD(D(RR(1):(8) )) and MEAD(ABS(D(RR(1):(8) ))), where ABS() calculates the absolute values of the elements. These are denoted as HRV2 and HRV3 , respectively. Using short-term autocorrelation in calculation of these metrics provides also tolerance to interpersonal variations, which are more significant in IMU signals than in ECG [30]. C. Approximate entropy estimate (APEN) The signal self-similarity paramer AP_EN is inspired by approximate entropy (ApEn) [33] and it is calculated by first subsampling the signal with 25 sample (0.125 second) steps. As the initial length of the signal is 2000 samples (10 seconds) the length of the subsampled signal is 80 samples. For the subsampled signal all-against-all matching is performed twice. At the first time, the number of matches between short subsequent signal segments SEGi (of length LD=2) against all other signal segments SEGj (of length LD=2) of the same signal (i 6= j) is calculated. A counter C is updated to contain the number of matches where max(ABS(SEGi -SEGj )) is less or equal than 0.2 times the overall standard deviation of the signal (while going through the whole subsampled signal and all individual elements of SEG). Based on C a M M (logarithmic) counter ΦM LD is updated as Φ2 = Φ2 +log(C) at each instance of the subsampled signal (initialized to zero at the beginning). For the second all-against all matching case the LD parameter is incremented with one, and a similar procedure as above is executed. Finally, the approximate M entropy (AP_EN) is calculated from ΦM 2 − Φ3 , where both M ΦLD have been normalized (divided) by the total number of samples of the subsampled signal [33]. The reason for the subsampling is to reduce the number of computations. The larger the AP_EN is, the more irregular the signal is, which is here used as an individual feature to predict AFib. D. Turning-point ratios (TPR) and RRI-TPR
B. HR and HRV features As notations for the following subsections, we introduce mean absolute difference (MAD) and its other version called median absolute difference (here denoted as MEAD). These are derived by calculating either the mean (in MAD) or median (in MEAD) of the vector derived by taking the absolute values of the differences between consecutive samples of a given input vector x (for instance by using notation MAD(x), where x is a RR time interval series calculated from a signal segment).
Operator RD extracts the total number of (increasing and decreasing) runs (i.e. consecutive increasing or decreasing sequences of values) in signal segment x. Turning point ratio (TPR) of x is defined as RD(x) divided by N − 2 where N is the number of elements in x. The turning point ratio of a RR time interval series of signal segment x is denoted as RRITPR and it is defined as TPR(RR(1):(8) ) [12]. Additionally, we use a total of 11 additional TPR features, which are calculated from the original pre-processed signal without extracting the
2168-2194 (c) 2016 IEEE. Translations and content mining are permitted for academic research only. Personal use is also permitted, but republication/redistribution requires IEEE permission. See http://www.ieee.org/publications_standards/publications/rights/index.html for more information.
This article has been accepted for publication in a future issue of this journal, but has not been fully edited. Content may change prior to final publication. Citation information: DOI 10.1109/JBHI.2017.2688473, IEEE Journal of Biomedical and Health Informatics IEEE JOURNAL OF BIOMEDICAL AND HEALTH INFORMATICS 2017
RR time intervals. We use the pre-processed signal segment and its filtered versions as such as inputs to the TPR. The justification for this is that the overall complexity of the signal waveform in different frequency bands is assumed to convey information of the structure of the signal. TPR1 is calculated as TPR(x), where x is the original pre-processed signal segment (of a specific axis). Additionally, we use 10 more TPR values calculated from filtered signals. TPR3,8,9,10,11 are calculated from bandpass filtered signal, each parameter calculated with different passband range. TPR2,4,5,6,7 are calculated from bandpass filtered signal that is furthermore passed through absolute value operation and a long triangular shaped smoothing filter. We believe, that the number of runs in the signal after pre-processing and with different filters represent the complexity of the signal waveform, which can then be used as an indicator of Afib. E. Spectral entropy The estimation of spectral entropy starts with removing the breathing component from the acquired signal. This is implemented by substracting a median filtered version (Sm ) of the signal from the original signal S. The median filter length in Sm is 60 samples, i.e. 0.3 seconds with 200 Hz sampling rate. The resulting signal Sn is calculated as Sn =S-Sm . Sn contains the signal without the breathing component and in the following step all negative values of Sn are replaced with zero values. The new signal is denoted as Snz , which contains only values greater or equal than zero [30], [35]. Then, the signal Snz is multiplied with a Hamming window (to avoid unwanted side lobes) and a power spectrum is calculated by taking FFT from the signal. The purpose of this step is to extract the spectral content of the signal. The frequency interval Fint (in the range [1 Hz, 11 Hz]) is then selected from the resulting signal SF F T and an estimated noise floor is then removed from the frequency content representation. The noise floor is extracted by finding frequencies with energy amplitude values SF F T 0.05, considering all axes).
2168-2194 (c) 2016 IEEE. Translations and content mining are permitted for academic research only. Personal use is also permitted, but republication/redistribution requires IEEE permission. See http://www.ieee.org/publications_standards/publications/rights/index.html for more information.
This article has been accepted for publication in a future issue of this journal, but has not been fully edited. Content may change prior to final publication. Citation information: DOI 10.1109/JBHI.2017.2688473, IEEE Journal of Biomedical and Health Informatics IEEE JOURNAL OF BIOMEDICAL AND HEALTH INFORMATICS 2017
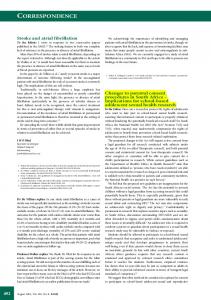
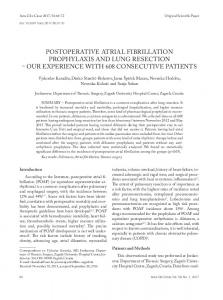
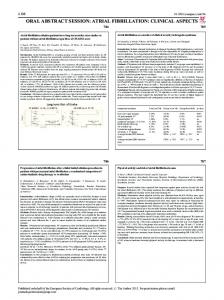
of less periodic signals such as AFib. The mean of HRV is higher in AFib in comparison with healthy case and also the standard deviation of HRV is higher, which corresponds well to the definition of AFib as having irregularly irregular RR intervals. The third column from the left HR (heart rate), is measured in samples within a RR interval. It can be observed that the mean RR interval is approximately 181 samples for the healthy subjects and around 158 samples for the AFib patients. These correspond to the average heart rates of 66 bpm (beats-per-minute) and 76 bpm, respectively. However, during instant paroxysmal AFib the heart rate may be even much higher. The healthy control subjects of the study were younger than the AFib patients, which can explain part of the increase in the HR. However, in the view of the application of discriminating between AFib persons and healthy subjects, young control subjects are actually more challenging, since the HRV tends to smoothen with aging [37]. It is more difficult to distinguish whether a young subject has AFib than an old subject. Anyway, it is expected that part of the increase in HR is explained by the nature of AFib. It can be seen in Fig. 3, that the difference between each feature (except for the feature number 15) in AFib and normal cases is statistically significant. Continuing the examination of Fig. 3, the mean of the RRI_TPR feature is higher in the case of AFib, which can be expected, since the signal is more random in the AFib case and the RR intervals vary more. The interpretation of the other TPR features is more challenging, but they describe the overall shape of the signal, while it is assumed that the machine learning algorithm is capable to select a proper combination of these in order to distinguish between the healthy subjects and AFib. Finally, the mean of the approximate entropy AP_EN is higher in the case of AFib, due to the irregularity in the AFib waveform. In Fig. 4 all the data samples (by considering each axis separately) are shown against two most important (largest variance) principal components of the data. The healthy samples are in black (marked with dot) and AFib samples in red (marked with an x). It can be observed, that all the features facilitate the discrimination of the data. E. The performance of accelerometer and gyroscope axes The detection accuracy of different accelerometer and gyroscope axes are compared (within the same framework and classifiers than before) in Fig. 5. The purpose of using features extracted from several axes is to enable the supervised machine learning algorithm to take care of the combination of the axes in a way which maximizes the recognition accuracy. However, each algorithm’s way of interpreting the data is different, and it is beneficial to study how they perform in terms of mining knowledge from separate axes. First, it can be observed that the GYROX axis is the best in the case of KSVM, and in the case of SVM the GYROY axis. In the case of RF classifier, both GYROX and GYROY perform the best. In general it can be observed that the gyroscope axes are better in terms of detection accuracy than the accelerometer axes. Thus, the utilization of the smartphone’s built-in gyroscope indeed seems to be beneficial for the purposes of AFib detection [2]. In
8
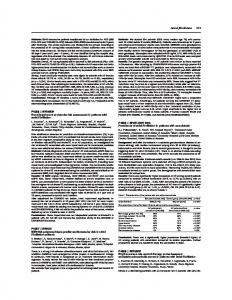
the case of RF classifier, the combining of the axes did not improve the overall recognition rate to the extent of the other classifiers. In general, we consider that the combination of the axes provides tolerance to noise and artifacts (and the best performing axis is not necessarily known a priori), thus the combined result (ALL axes in Fig. 5) usually is the best choice. We considered it as the final classification result. In general, in accounting also other applications that we have tested, for instance, accelerometer based gating in PET (positron emission tomography) imaging [31]) we have noticed that the signal quality of ACCZ axis is usually the best one when considering the accelerometer axes only, and when considering all the six data channels the GYRO-Y axis is usually is the best one. V. A PPLICATION DEVELOPMENT ISSUES We have implemented a smartphone application, which performs signal acquisition by user’s request, feature extraction, and KSVM based classification (which was one of the best performing classifiers in this study). All the processing steps are performed locally on a smartphone. As a result the application informs the user, whether he/she suffers from AFib or not. However, there are still some issues that need further investigation before the application would reach a commercial level in order to be distributed globally. For instance, as the sampling rate was stable enough for the smartphone that we used, its base frequency may be different in other smartphone models. There also exist a varying component in the sampling frequency of a few Hz, which is most probably related to running other programs on the same operating system. Furthermore, the IMU devices containing the accelerometer and the gyroscope may have different device parameters, which vary between smartphone models due to chip level implementation issues. All these can have an effect to the overall performance and applicability of the developed algorithms and thus need to be taken into account. The mobile application (called SUMM) is based on Android (mobile) operating system developed by Google. We have tested the application on smartphones by various vendors. Due to good sensor signal quality, Sony Xperia Z-series family smartphones were most frequently used. The device sampling rate detected for accelerometer and gyroscope in that case was between approximately 198 Hz and 200 Hz. Apart from Sony Xperia Z-series, Samsung Galaxy S5 also gave the sensor sampling rate around 200 Hz. The feature vector used in KSVM classification was generated with the device specific sampling rate. As mentioned, the smartphone specific sampling rate can vary slightly from the sampling rate used in generating the training set. We did not encounter any problems due to this slight difference. Fig. 6 shows two example screenshots from the application running in Sony Xperia Z3. The two images on the left show the summary of a person with normal sinus rhythm and the images on the right show a summary of a person with AFib. Only ACCZ and GYROY axes signals, which are usually the best axes, are shown in the figure.
2168-2194 (c) 2016 IEEE. Translations and content mining are permitted for academic research only. Personal use is also permitted, but republication/redistribution requires IEEE permission. See http://www.ieee.org/publications_standards/publications/rights/index.html for more information.
This article has been accepted for publication in a future issue of this journal, but has not been fully edited. Content may change prior to final publication. Citation information: DOI 10.1109/JBHI.2017.2688473, IEEE Journal of Biomedical and Health Informatics IEEE JOURNAL OF BIOMEDICAL AND HEALTH INFORMATICS 2017
9
0.5
TPR1 TPR3
0.4
TPR8 TPR10 TPR9
0.3
TPR11
Component 2
HR
0.2
TPR4
0.1 SP_ENT
TPR7
0 TPR6
TPR2 AP_EN RRI-TPR
-0.1
HRV3 HRV2 HRV
-0.2
TPR5
-0.3 -0.4 -0.3
-0.2
-0.1
0
0.1
0.2
0.3
0.4
Component 1
Fig. 4. The distribution of the data in two main principal components (bi-plot) after principal component analysis (PCA). The data has been normalized before applying the PCA. The AFib samples are in red (marked with an x) and healthy samples in black (marked with dot). As in Fig. 3, the different data axes are combined so that the dimension of each feature is 18 (and it is based on utilizing data in all axes, i.e. there are six times more samples than for single axis).
ACCURACY
1 0.9
SE=0.875 SP=0.957 ACC=0.923
0.8
SE=0.813 SP=0.87 ACC=0.846
SE=0.875 SP=0.957 ACC=0.923
KSVM SE=0.938 SP=1 ACC=0.974
SE=0.875 SP=1 ACC=0.949
SE=0.75 SP=1 ACC=0.897
SE=0.938 SP=1 ACC=0.974
0.7 ACCX
ACCY
ACCZ
ACCURACY
1 0.9
GYROX
NORMAL SVM
SE=0.875 SP=0.913 ACC=0.897
SE=0.813 SP=1 ACC=0.923
SE=0.875 SP=0.957 ACC=0.923
ACCY
ACCZ
SE=0.875 SP=1 ACC=0.949
GYROY
SE=0.938 SP=1 ACC=0.974
0.8
GYROZ
SE=0.75 SP=0.957 ACC=0.872
ALL
SE=0.875 SP=1 ACC=0.949
0.7 ACCX
ACCURACY
1 0.9
GYROX
GYROY
GYROZ
ALL
RF (ENSEMBLE)
SE=0.813 SP=0.957 ACC=0.897
0.8
SE=0.813 SP=0.913 ACC=0.872
SE=0.813 SP=0.913 ACC=0.872
ACCY
ACCZ
SE=0.875 SP=1 ACC=0.949
SE=0.875 SP=1 ACC=0.949
GYROX
GYROY
SE=0.813 SP=0.957 ACC=0.897
SE=0.813 SP=1 ACC=0.923
0.7 ACCX
GYROZ
ALL
Fig. 5. The recognition accuracy of different classifiers with a changing accelerometer and gyroscope axes. The total number of features in each axis is 18. The best axes and combined axes (using all axes) are highlighted in each case.
Fig. 6. Two screenshots from the AFib detection application running in Sony Xperia Z3. On the left a normal subject, and on the right an AFib subject. The data is shown only in (ACC-Z and GYRO-Y) axes. Before starting the measurement, the information of the user is filled in, and after the measurement the application informs the user whether he/she has AFib. The patient in this case suffered from chronic AFib, where the heart rate is made lower by medication and therefore the heart rate of the AFib patient is relatively low.
2168-2194 (c) 2016 IEEE. Translations and content mining are permitted for academic research only. Personal use is also permitted, but republication/redistribution requires IEEE permission. See http://www.ieee.org/publications_standards/publications/rights/index.html for more information.
This article has been accepted for publication in a future issue of this journal, but has not been fully edited. Content may change prior to final publication. Citation information: DOI 10.1109/JBHI.2017.2688473, IEEE Journal of Biomedical and Health Informatics IEEE JOURNAL OF BIOMEDICAL AND HEALTH INFORMATICS 2017
Recent iPhones have a built-in motion co-processor, which can be expected to decrease the jitter in the sampling rate. In our initial tests, the maximum base sampling frequency obtainable with iPhone was approximately 100 Hz, while the signal quality observed appeared visually very good. Eventually there would be a need to implement a solution, which could adapt to slight differences between the signals (sampling rate, signal morphology) originating from different devices. Thus, our current implementation can be seen as a proof-of-concept work, which will require further development in order to be applied more widely. Whether the different base sampling frequency has an effect to the performance of the envisioned application in iPhone, and which measures need to be taken, will be left for future work. VI. D ISCUSSION In this paper we presented a smartphone-only solution targeted to screening of AFib from large masses. Our solution was based on the well known principles of seismocardiography [15], [18], [19], [22], extended with a newly proposed cardiac sensing modality gyroscope [2]. In [27], in the context of ballistocardiography machine learning was used to classify between AFib and normal persons using data from bed sensor. In our approach, IMU signals obtained from a smartphone which is placed on the chest of the patient are used to detect AFib. In the year 2016 there existed about 2 billion smartphones globally which is estimated to increase to more than 2.6 billion in 2019. Thus, this work is first step towards implementing efficient AFib screening of the global population. Despite of this, a lot of research needs to be conducted before the release of the envisioned AFib screening solution. The effect of premature atrial beats (premature heart beats originating from the atria), premature ventricular beats, and other arrhythmias such as atrial flutter to the performance of the develeped algorithm should be evaluated, as these might be similar in appearance to AFib. To accomplish this, we will need to extract data from synchronized ECG and smartphone SCG, to verify the apprearance and to distinguish between different phenomena present in SCG and ECG. Also, other arrhythmias will need to be covered, as this paper only focused on the separation between AFib and sinus rhythm. As a summary, much research is still needed in order to develop a final solution for AFib screening with high clinical value. Also, the sample size of this study was quite small and more extensive clinical studies will need to be performed in the future. We want to emphasize, that the purpose of the application is not to make the final diagnosis for a person suffering from AFib, but to advice to seek for medical care and final diagnosis by a cardiologist. In an envisioned usage scenario of the system, a patient (or a person belonging into a risk group) performs self-measurements to screen for occurrence of AFib. In the case of a positive result given by a smartphone, there would be a need to visit a cardiologist to rule out the possibility of AFib. In any case, a trained cardiologist will use ECG (and potentially other modalities) for the final diagnosis.
10
This paper concentrated only on AFib detection. We are planning that in the future there could be more categories to be classified, corresponding to a more versatile set of heart conditions and abnormalities. This might somewhat lower the performance of individual abnormality detection (as in ECG), but on the other hand better serve the mobile application user’s cardiac health. Collecting (Big) data from application users could also be a viable option for improving the classification performance. However, as the true classes for this data might not be known, it would be beneficial to explore the application of unsupervised classification methods for obtaining the data classes or categories. We have also initially applied PCA to reduce the dimension of the feature space (108 features), but at this point an improvement to the classification accuracy was not yet obtained. As the application gives the classification result very rapidly after the data collection, we did not see the application of dimensionality reduction necessary. As there already exist mobile ECG devices, which can be used for the diagnosis of various heart abnormalities, an interesting issue to study in the future would be the combination of the IMU data and ECG, and whether it would allow improving the detection of AFib and other conditions. VII. C ONCLUSIONS We have implemented an application for the detection of AFib, which takes advantage the inbuild IMU unit within smartphones to acquire a heart signal. This is an alternative approach to smartphone camera and flash illumination based AFib detection and has some advantages. The approach that we propose is based on compact MEMS accelerometer and gyroscope, which are being constantly developed by smartphone component manufacturers keeping in mind the potential health applications. The IMU based approach could also be scalable to other wearable devices and even body-sensor networks utilizing multiple IMUs. We obtained sensitivity of 93.8%, specificity of 100.0% and detection accuracy of 97.4% in AFib detection, while excluding any data specific to the person under test from the training set (leave-oneperson-out cross validation, LOOCV). We are expecting that the final application (either freely available or commercial) could provide a positive impact on global cardiac health, due to wide availablity of smartphones worldwide. A PPENDIX A T ERMINOLOGY Here we briefly describe some of the most important terms and abbreviations used in the paper. Section 1: • AFIB - Atrial fibrillation; • ECG - Electrocardiography; • PPG - Photoplethysmography (acquisition of heart signal by measuring the blood volume changes in the veins optically); • IMU - Inertial measurement unit (3-axis accelerometer and 3-axis gyroscope); • BCG - Ballistocardiography;
2168-2194 (c) 2016 IEEE. Translations and content mining are permitted for academic research only. Personal use is also permitted, but republication/redistribution requires IEEE permission. See http://www.ieee.org/publications_standards/publications/rights/index.html for more information.
This article has been accepted for publication in a future issue of this journal, but has not been fully edited. Content may change prior to final publication. Citation information: DOI 10.1109/JBHI.2017.2688473, IEEE Journal of Biomedical and Health Informatics IEEE JOURNAL OF BIOMEDICAL AND HEALTH INFORMATICS 2017
•
SCG - Seismocardiography.
Sections 2 and 3: • AO - Aortic opening (the most prominent peak in SCG); • RR INTERVAL - Time interval between two successive R peaks (or AO peaks in SCG); • GCG - Gyrocardiography (utilizing 3-axis gyroscope to supplement the SCG); • DATA (CHANNELS) - 3-axis accelerometer and 3axis gyroscope provide a total of six simultaneous and synchronized series of data; • DATA SEGMENT - A fixed duration (10 seconds) section of a data specific to a certain axis; • SEGi,j SEGMENT - A caption of data in specific axis with e.g. a length of 2 or 3 samples; • (AUTOCORRELATION) WINDOW - A portion of data segment used to calculate autocorrelation; • RR(1):(N ) Consists of a N RR time intervals; • MAD - Mean absolute difference; • MEAD - Median absolute difference. Sections 3 and 4: • HR - Heart rate (used also as feature); • HRV(1-3) - Heart rate variability feature; • AP EN - Approximate entropy feature; • TPR(1-11) - Turning point ratio features; • RRI-TPR - Turning point ratio (TPR) of RR(1):(N ) , i.e. TPR(RR(1):(N ) ); • SP ENT - Spectral entropy. Section 4: • SVM - Support vector machine classifier; • KSVM - Kernel support vector machine classifier; • RF - Random forest classifier; • LOOCV - Leave-one-out cross-validation; • MAJORITY VOTING - Using multiple subsegment’s feature vectors to vote for the best class; • PCA - Principal component analysis. ACKNOWLEDGMENT The research was funded by Academy of Finland (290930) and Finnish Funding Agency for Innovation (Tekes) (40292/14). R EFERENCES [1] J. Lee, B. Reyes, D. McManus, O. Mathias, and K. Chon, “Atrial fibrillation detection using an iphone 4s,” Biomedical Engineering, IEEE Transactions on, vol. 60, no. 1, pp. 203–206, Jan 2013. [2] M. J. Tadi, E. Lehtonen, M. P¨ank¨aa¨ l¨a, A. Saraste, T. Vasankari, M. Ter¨as, and T. Koivisto, “Gyrocardiography: a new non-invasive approach in the study of mechanical motions of the heart. concept, method and initial observations,” in 2016 38th Annual International Conference of the IEEE Engineering in Medicine and Biology Society (EMBC). EMBS, August 2016, pp. 2034–2037. [3] A. J. Camm, G. Y. Lip, R. De Caterina, I. Savelieva, D. Atar, S. H. Hohnloser, G. Hindricks, P. Kirchhof, J. J. Bax, H. Baumgartner et al., “2012 focused update of the esc guidelines for the management of atrial fibrillation,” European heart journal, vol. 33, no. 21, pp. 2719–2747, 2012. [4] D. Ko, F. Rahman, R. B. Schnabel, X. Yin, E. J. Benjamin, and I. E. Christophersen, “Atrial fibrillation in women: epidemiology, pathophysiology, presentation, and prognosis,” Nature Reviews Cardiology, vol. 13, no. 6, pp. 321–332, 2016.
11
[5] M. D. Ezekowitz, S. L. Bridgers, K. E. James, N. H. Carliner, C. L. Colling, C. C. Gornick, H. Krause-Steinrauf, J. F. Kurtzke, S. M. Nazarian, M. J. Radford et al., “Warfarin in the prevention of stroke associated with nonrheumatic atrial fibrillation,” New England Journal of Medicine, vol. 327, no. 20, pp. 1406–1412, 1992. [6] Y. Miyasaka, M. E. Barnes, B. J. Gersh, S. S. Cha, K. R. Bailey, W. P. Abhayaratna, J. B. Seward, and T. S. Tsang, “Secular trends in incidence of atrial fibrillation in olmsted county, minnesota, 1980 to 2000, and implications on the projections for future prevalence,” Circulation, vol. 114, no. 2, pp. 119–125, 2006. [7] C. T. January, L. S. Wann, J. S. Alpert, H. Calkins, J. E. Cigarroa, J. B. Conti, P. T. Ellinor, M. D. Ezekowitz, M. E. Field, K. T. Murray et al., “2014 aha/acc/hrs guideline for the management of patients with atrial fibrillation: a report of the american college of cardiology/american heart association task force on practice guidelines and the heart rhythm society,” Journal of the American College of Cardiology, vol. 64, no. 21, pp. e1–e76, 2014. [8] http://www.cdc.gov/dhdsp/data statistics/fact sheets/ fs atrial fibrillation.htm, accessed: 2016-11-10. [9] J. Allen, “Photoplethysmography and its application in clinical physiological measurement,” Physiological measurement, vol. 28, no. 3, p. R1, 2007. [10] L. Krivoshei, S. Weber, T. Burkard, A. Maseli, N. Brasier, M. K¨uhne, D. Conen, T. Huebner, A. Seeck, and J. Eckstein, “Smart detection of atrial fibrillation,” Europace, p. euw125, 2016. [11] J. J. Oresko, Z. Jin, J. Cheng, S. Huang, Y. Sun, H. Duschl, and A. C. Cheng, “A wearable smartphone-based platform for real-time cardiovascular disease detection via electrocardiogram processing,” IEEE Transactions on Information Technology in Biomedicine, vol. 14, no. 3, pp. 734–740, 2010. [12] S. Dash, K. Chon, S. Lu, and E. Raeder, “Automatic real time detection of atrial fibrillation,” Annals of biomedical engineering, vol. 37, no. 9, pp. 1701–1709, 2009. [13] O. Andersson, K. H. Chon, L. S¨ornmo, and J. N. Rodrigues, “A 290 mv sub-asic for real-time atrial fibrillation detection,” IEEE transactions on biomedical circuits and systems, vol. 9, no. 3, pp. 377–386, 2015. [14] J. Lau, N. Lowres, L. Neubeck, D. Brieger, R. Sy, C. Galloway, D. Albert, and S. Freedman, “Iphone ecg application for community screening to detect silent atrial fibrillation: A novel technology to prevent stroke,” International Journal of Cardiology, vol. 165, no. 1, pp. 193– 194, 2013. [15] J. Zanetti et al., “Seismocardiography: A new technique for recording cardiac vibrations. concept, method, and initial observations,” Journal of cardiovascular technology, vol. 9, no. 2, pp. 111–118, 1990. [16] J. W. Gordon, “Certain molar movements of the human body produced by the circulation of the blood,” Journal of Anatomy and Physiology, vol. 11, pp. 533–536, 1877. [17] J. Paalasmaa, H. Toivonen, and M. Partinen, “Adaptive heartbeat modelling for beat-to-beat heart rate measurement in ballistocardiograms,” Biomedical and Health Informatics, IEEE Journal of, vol. 19, no. 6, pp. 1945–1952, Nov 2015. [18] O. Inan, P.-F. Migeotte, K.-S. Park, M. Etemadi, K. Tavakolian, R. Casanella, J. Zanetti, J. Tank, I. Funtova, G. Prisk, and M. Di Rienzo, “Ballistocardiography and seismocardiography: A review of recent advances,” Biomedical and Health Informatics, IEEE Journal of, vol. 19, no. 4, pp. 1414–1427, July 2015. [19] D. M. Salerno and J. Zanetti, “Seismocardiography for monitoring changes in left ventricular function during ischemia,” Chest, vol. 100, no. 4, pp. 991–993, 1991. [20] J. Ramos-Castro, J. Moreno, H. Miranda-Vidal, M. Garcia-Gonzalez, M. Fernandez-Chimeno, G. Rodas, and L. Capdevila, “Heart rate variability analysis using a seismocardiogram signal,” in Engineering in Medicine and Biology Society (EMBC), 2012 Annual International Conference of the IEEE, Aug 2012, pp. 5642–5645. [21] M. Tadi, E. Lehtonen, T. Koivisto, M. Pankaala, A. Paasio, and M. Teras, “Seismocardiography: Toward heart rate variability (hrv) estimation,” in Medical Measurements and Applications (MeMeA), 2015 IEEE International Symposium on, May 2015, pp. 261–266. [22] P. Castiglioni, A. Faini, G. Parati, and M. Di Rienzo, “Wearable seismocardiography,” in Engineering in Medicine and Biology Society, 2007. EMBS 2007. 29th Annual International Conference of the IEEE. IEEE, 2007, pp. 3954–3957. [23] C. Gavriel, K. H. Parker, and A. Faisal, “Smartphone as an ultralow cost medical tricorder for real-time cardiological measurements via ballistocardiography,” in Wearable and Implantable Body Sensor Networks (BSN), 2015 IEEE 12th International Conference on, June 2015.
2168-2194 (c) 2016 IEEE. Translations and content mining are permitted for academic research only. Personal use is also permitted, but republication/redistribution requires IEEE permission. See http://www.ieee.org/publications_standards/publications/rights/index.html for more information.
This article has been accepted for publication in a future issue of this journal, but has not been fully edited. Content may change prior to final publication. Citation information: DOI 10.1109/JBHI.2017.2688473, IEEE Journal of Biomedical and Health Informatics IEEE JOURNAL OF BIOMEDICAL AND HEALTH INFORMATICS 2017
12
[24] W. Jia, Y. Li, Y. Bai, Z.-H. Mao, M. Sun, and Q. Zhao, “Estimation of heart rate from a chest-worn inertial measurement unit,” in Bioelectronics and Bioinformatics (ISBB), 2015 International Symposium on, Oct 2015, pp. 148–151. [25] J. Hernandez, Y. Li, J. Rehg, and R. Picard, “Bioglass: Physiological parameter estimation using a head-mounted wearable device,” in Wireless Mobile Communication and Healthcare (Mobihealth), 2014 EAI 4th International Conference on, Nov 2014, pp. 55–58. [26] J. Hernandez, D. McDuff, and R. Picard, “Bioinsights: Extracting personal data from still wearable motion sensors,” in Wearable and Implantable Body Sensor Networks (BSN), 2015 IEEE 12th International Conference on, June 2015, pp. 1–6. [27] C. Bruser, J. Diesel, M. Zink, S. Winter, P. Schauerte, and S. Leonhardt, “Automatic detection of atrial fibrillation in cardiac vibration signals,” Biomedical and Health Informatics, IEEE Journal of, vol. 17, no. 1, pp. 162–171, Jan 2013. [28] T. Koivisto, M. P¨ank¨aa¨ l¨a, T. Hurnanen, T. Vasankari, T. Kiviniemi, A. Saraste, and J. Airaksinen, “Automatic detection of atrial fibrillation using mems accelerometer,” in Computing in Cardiology 2015, 42nd annual Conferene, vol. 42, September 2015, pp. 829–832. [29] M. P¨ank¨aa¨ l¨a, T. Koivisto, O. Lahdenoja, T. Kiviniemi, A. Saraste, T. Vasankari, and J. Airaksinen, “Detection of atrial fibrillation with seismocardiography,” in IEEE engineering in medicine and biology EMBC, 38th annual international conferene (to appear), Aug 2016, pp. 4369–4374. [30] T. Hurnanen, E. Lehtonen, M. J. Tadi, T. Kuusela, T. Kiviniemi, A. Saraste, T. Vasankari, J. Airaksinen, T. Koivisto, and M. P¨ank¨aa¨ l¨a, “Automated detection of atrial fibrillation based on time-frequency analysis of seismocardiograms,” Accepted to Biomedical and Health Informatics, IEEE Journal of, 2016. [31] M. J. Tadi, T. Koivisto, M. Pankaala, and A. Paasio, “Accelerometerbased method for extracting respiratory and cardiac gating information for dual gating during nuclear medicine imaging,” International Journal of Biomedical Imaging, vol. 2014, no. 690124, pp. 1–11, 2014. [32] Electrophysiology, Task Force of the European Society of Cardiology the North American Society of Pacing, “Heart rate variability: Standards of measurement, physiological interpretation, and clinical use,” Circulation, vol. 93, no. 5, pp. 1043–1065, 1996. [33] S. M. Pincus, “Approximate entropy as a measure of system complexity.” Proceedings of the National Academy of Sciences, vol. 88, no. 6, pp. 2297–2301, 1991. [34] O. Lahdenoja, T. Hurnanen, M. J. Tadi, M. P¨ank¨aa¨ l¨a, and T. Koivisto, “Heart rate variability estimation with joint accelerometer and gyroscope sensing,” in Computing in Cardiology Conference (CinC) (to appear), August 2016. [35] R. Peters, E. James, and M. Russell, “Amplitude modulation effects in cardiac signals,” arXiv preprint arXiv:1011.1880, 2010. [36] I. H. Witten and E. Frank, Data Mining: Practical machine learning tools and techniques. Morgan Kaufmann, 2005. [37] T. B. Kuo, T. Lin, C. C. Yang, C.-L. Li, C.-F. Chen, and P. Chou, “Effect of aging on gender differences in neural control of heart rate,” American Journal of Physiology-Heart and Circulatory Physiology, vol. 277, no. 6, pp. H2233–H2239, 1999.
2168-2194 (c) 2016 IEEE. Translations and content mining are permitted for academic research only. Personal use is also permitted, but republication/redistribution requires IEEE permission. See http://www.ieee.org/publications_standards/publications/rights/index.html for more information.