Information Knowledge Systems Management 5 (2005/2006) 23–47 IOS Press
23
Attack profiles to derive data observations, features, and characteristics of cyber attacks Nong Ye∗ , Bashettihalli Harish and Toni Farley Arizona State University, Tempe, Arizona, USA Abstract: Existing techniques for cyber attack detection rely mainly on activity data from computers and networks. Little consideration has been given to other kinds of data in the cause-effect chains of attacks. Adding state and performance data may reveal elements on computers and networks that are affected by a cyber attack, thus providing a more accurate, complete picture of an attack. This paper presents a System-Fault-Risk framework that defines elements involved in the cause-effect chain of an attack. The SFR framework combines system and fault modeling, and risk assessment methods. It is employed to analyze known cyber attacks and derive profiles that define activity, state and performance data in cause-effect chains, features of those data, and characteristics of those features that enable attack detection. The profiles derived from specific attacks are generalized and compared with those reported in other studies to illustrate a set of novel data, features and characteristics.
1. Introduction Existing tools or systems for cyber attack detection rely mainly on activity data, such as monitoring traffic on a network or activity logs stored on a computer. Other kinds of data such as system state and performance data have not been given much importance. In general, activities on computers and networks change the states of their resources, which in turn have an impact on the performance of user initiated processes [45]. Hence, activities are the cause of subsequent changes in resource state and performance impact. For example, consider running a program on a computer. This activity affects the availability (state) of the central processing unit (resource), which affects the timeliness (performance) of processes using the resource. State and performance data, in conjunction with activity data may also reveal elements on computers and networks that are affected by an attack. They can help detect the attack at an early stage, or make attack detection more accurate. Large amounts of activity data include a lot of irrelevant information, and cause difficulty in data processing for efficient and accurate attack detection. For example, event logs on a computer store various descriptive events of activities and errors, such as removal of a plug-in device from the system, inability to synchronize the clock and miscellaneous application errors. These entries are more aimed at reporting activity in the system, errors in applications, or for auditing purposes; and less towards detecting attacks. Similarly, network activity data includes large amounts of information from individual packets (transmitted pieces of data) on the network, to/from various machines. The captured data is extensive and it is difficult to track such data and identify attacks. Thus, it is important to understand, ∗
Corresponding author: Nong Ye, Professor of Industrial Engineering and affiliated Professor of Computer Science and Engineering, Arizona State University, Information and Systems Assurance Laboratory, Box 875906, Tempe, Arizona 852875906, USA. Tel.: +1 480 965 7812; Fax: +1 480 965 8692; E-mail:
[email protected]. 1389-1995/05/06/$17.00 © 2005/2006 – IOS Press and the authors. All rights reserved
24
N. Ye et al. / Attack profiles to derive data observations, features, and characteristics
identify and reveal multiple data (including activity, state and performance data) in cause-effect chains to help improve the accuracy and efficiency of attack detection. This paper presents a System-Fault-Risk (SFR) framework that we develop based on methods of system modeling, fault modeling and risk assessment. The SFR framework defines elements involved in the cause-effect chain of a cyber attack. We employ the SFR framework to analyze known cyber attacks and derive cyber attack profiles which reveal activity, state, and performance data in cause-effect chains, features of those data, and characteristics of those features that enable the distinction of cyber attacks from normal user activities. The derived data, features and characteristics (DFC) of specific cyber attacks are generalized and compared with those reported in existing literature to illustrate a new set of DFCs. Describing the observation points for attacks as DFCs aids in understanding which of these elements are most frequently seen across attacks. Such knowledge is necessary to optimize the selection of data variables that need to be tracked and analyzed, thus reducing the amount of data required for efficient and accurate attack detection. In the next section, we present concepts from system modeling, fault modeling and risk assessment, and define the SFR framework accordingly. Next we describe examples of attack profiles for some known cyber attacks that we derive using the SFR framework. Each attack profile specifies activity, state and performance data in a cause-effect chain, features of those data, and characteristics of those features that enable the distinction of that attack from normal user activities. Then we provide a list of all cyber attacks that we analyze to create attack profiles, and the DFCs obtained from these profiles. We compare our discoveries with those reported in existing literature on cyber attack detection to illustrate the usefulness of our findings towards accurate and efficient cyber attack detection. Following, we present a list of generalized DFCs across specific attacks. Finally, we conclude the paper with a summary of this study and our findings. 2. System-fault-risk (SFR) framework In this section, we outline existing methods of describing and classifying cyber attacks and point out missing elements in those methods. Then we present the SFR framework to capture elements involved in the cause-effect chain of a cyber attack. We also describe the method of attack profiling based on the SFR framework. 2.1. Existing methods of attack description and classification There exist several descriptions and classifications of cyber attacks [47]. Attack descriptions on mailing lists can be detailed and extensive; however, they are oriented towards dissemination of information [6]. These descriptions are not organized in a manner useful for attack detection. In the CERT public database (http://www.cert.org), attacks are described in terms of the tool used, vulnerability exploited, and action, target and unauthorized result of the attack. This gives little information about the state and performance impact of an attack. Attacks can be described in terms of their phases, with each phase being described as an ‘attack language’ [11]. Accordingly, there are several types of attack description languages, one for each phase of an attack: exploit [31], event [5], detection [25,29], correlation [9], reporting [10] and response. Attack description languages like Adele attempt to combine the different phases/languages into one high level description [28]. The Internet Categorization of Attacks Toolkit attempts to classify an attack based on its goal, target machines, transmission method, attack platform and requirements [26]. However, this categorization does not capture the implementation and execution details of the attack,
N. Ye et al. / Attack profiles to derive data observations, features, and characteristics
25
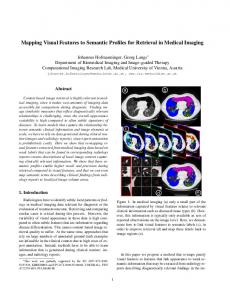
making it difficult to use this information alone to detect an attack. A flexible and extensible model for describing cyber attacks is proposed [38]. The model describes attacks in terms of capabilities and implications in the form of a scenario. The diagram captures activities, vulnerabilities exploited and the results of an attack. The authors suggest that this model could be used for detecting attacks and predicting attackers’ intent. However, this model does not explicitly consider factors such as state changes and the performance implications of attack activities. 2.2. The SFR framework We develop the SFR framework based on concepts from system modeling, fault modeling and risk assessment theories [47]. This section briefly describes these concepts. System modeling concepts useful for attack detection include resource-process interactions and activity-state-performance interactions, which we can use for modeling computer and network systems [14,45]. A computer/network resource provides service to a process. The state of the resource changes during the service time and in turn determines the output performance of the process. Three security-related attributes (availability, integrity and confidentially) of the resource state and three corresponding attributes (timeliness, accuracy and precision) of the process performance are defined by Ye [45]. In general, in a system, user activities initiate processes and resource activities provide services to processes, resulting in state changes in the resources. Changes in the state of resources in turn cause changes in the output performance of processes. Resource-process interactions and activity-stateperformance interactions capture these relationships. An essential part of fault modeling is to capture the cause-effect chain of changes in a system [30]. A fault in a system has a propagation effect involving activity-state-performance interactions. Hence, a fault can be modeled in a cause-effect chain or network of activity, state change, and performance impact, all occurring in the system during the fault effect propagation. To assess the system risk of a fault, such as one caused by a cyber attack, we consider three factors of risk assessment: asset, vulnerability and threat. Assets include computer and network resources such as CPU, memory, operating system, data files, databases, application programs, network programs, and so on. Vulnerability evaluates the security strength of an asset. An asset is vulnerable if there is an opportunity to cause damage or loss to the asset’s value. Threats are potential attacks, which we desire to protect against. Based on these system modeling, fault modeling and risk assessment concepts, we develop the SFR framework for describing an attack as illustrated in Fig. 1. The attack description in the SFR framework includes the objective of the attack, propagation method, origin, activity, vulnerability, asset under attack, and state and performance effects. The objective, propagation method and origin of an attack characterize the threat profile of the attack. The elements of the threat profile are linked to the attack elements of activity-state-performance interactions of resources and processes (assets and their vulnerabilities exploited in attack processes) in the cause-effect chain. Although concepts and elements from system modeling, fault modeling and risk assessment have separately been applied in the context of information security and assurance, they have not previously been combined to describe and classify cyber attacks for attack detection. To illustrate the SFR framework, in Fig. 2 we consider the cause-effect chain of the Apache Denial of Service attack [8]. This is a network based attack that compromises the availability of a web server resource and has a timeliness effect on performance. In this attack, the attacker sends a large number of specially formed requests to the web server. The headers are all the same, and are very large in size.
26
N. Ye et al. / Attack profiles to derive data observations, features, and characteristics Apache web server Denial of Service attack Threat
Attack Cause (Activity)
Effect
Achieve an
by means of
from
using an
by expoiting a
on an
causing
Objective
Propagation
Attack Origin
Action
Vulnerability
Asset
State Effects
Professional Crimes
Autonomous
Remote (Single Source)
Flood (Single Source)
Implementation
Process
Availability
Remote (Multiple Source)
Flood (Multiple Source)
Corporate Rivalry
that exhibit Performance Effects Timeliness
Cracking Vandalism
Fig. 1. SFR Framework based Apache Denial of Service attack description.
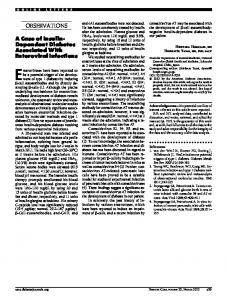
The server will attempt to process each request, slow down considerably, and may eventually crash. As shown in Fig. 1, this attack could be a professional crime, corporate rivalry, or simply cracking or vandalism. Since the attack is performed using a script of computer code, it is executed in an autonomous manner. This attack could be launched remotely, either from single or multiple locations. Its action is to flood the web server process with malformed packets. The attack exploits a vulnerability in the implementation of the web server program, and targets the specific process for web service. This attack affects the availability state and timeliness performance of the web service. In Fig. 2, certain categories are chosen to appropriately describe each element of the SFR framework for the Apache Denial of Service attack. Each element of the SFR framework is explained in detail in Ye [47]. Cyber attacks can be described and classified by selecting appropriate categories for each element of the SFR framework. The classification of a variety of cyber attacks using the SFR framework can also be found in Ye [47]. 2.3. Attack profiling based on the SFR framework To derive the data observations of activity, state and performance changes that can help in detecting an attack while it is progressing along its cause-effect chain, the elements of a cyber attack in the SFR framework are enlarged in an attack profile, which includes an explicit description of the cause-effect chain along with observations of activity, state and performance changes. The method of attack profiling is explained in detail in this section, using the attack profile for the Apache Denial of Service attack as an example. Based on activity-state-performance changes, observation points can be selected such that monitoring the observation points will be useful in detecting the attack. An observation point could be an activity, a state change or a performance impact anywhere along the cause-effect chain for the attack shown in Fig. 2. Observation points for the attack can be refined further, in terms of how they can be identified by analyzing activity/state/performance data on the systems. Thus, each observation point can be defined in terms of the data which needs to be analyzed, its feature and the characteristic on the feature to detect the attack [47]. In general, data is the raw data captured by computers/networks, feature is a measure from the data, such as individual observation, mean, variance, probability distribution, covariance, autocorrelation, dependency, etc. The characteristic of a given feature enables the distinction of an attack from normal system behavior, such as shift, trend (i.e., cyclic and seasonal), drift (i.e., upward and downward), intermittent spike or bump, change (i.e., step change, slope change, sine wave, and square wave), etc.
N. Ye et al. / Attack profiles to derive data observations, features, and characteristics
27
Observation A: HTTP packets with large headers
Activity 1: Attacker sends multiple HTTP request with very large headers.
Observation B: Multiple HTTP packets requesting same file. Activity 2: Victim processes requests with large headers.
Observation C: HTTP requests from one source arrive unusually fast.
Activity 3: Victim s HTTP daemons blindly allocate memory to satisfy each request
State 2: Web server slows down considerably/hangs. OS may also have slow response time
Observation F: More HTTP requests arrive than are serviced
Observation D: Comparatively high memory util by web server process
Observation E: Comparatively high CPU util by web server process Performance 1: Memory usage increases. CPU utilization increases. Slow responses for other jobs on victim
Observation G: Web server response time increases
Fig. 2. Cause-effect Chain – Apache Denial of Service attack.
Thus, a one-to-one mapping can be created between an observation point and its corresponding DataFeature-Characteristic. For example, for the observation points of the Apache attack, Table 1 indicates their corresponding data, feature and characteristic. For example, observation point A in Fig. 2 is for a series of HTTP requests with large header size. This can be observed by analyzing the header sizes of successive HTTP requests arriving, and testing for larger than normal header sizes. One way to implement this is to use the Exponential Weighted Moving Average (EWMA) technique, to obtain a feature representing the smoothed average of header size in the recent period [46]. EWMA essentially gives a higher weight to recent observations and a lower weight to past observations. This technique has been successfully used to detect cyber attacks using audit trials [46]. Thus, using the feature of smoothed header size average from the EWMA technique, a step increase on this feature will indicate large header HTTP packets, which is observation point A for the Apache attack. Point A can be observed from network data at a computer or network location, as listed in Table 1. Refining each observation point into data, feature and characteristic helps to understand which of these elements are most frequently seen across attacks. Such information aids in optimizing the observations on the data that need to be made to detect a set of attacks. Observation points can be related in several ways, including temporal, causal, data dependent and spatial. Thus, we give one example of how the observation points along an attack chain may be symbolically represented in this way. In any attack scenario, it is possible that one observation point
28
N. Ye et al. / Attack profiles to derive data observations, features, and characteristics Table 1 Data, features and characteristics – Apache denial of service attack
OBS A B
Location l1 l2 l1 l2
C
l1 l2
D
l1
E
l1 l1 l2 l1
G
l2
Data HTTP GET message header size HTTP GET message header size with same DEST IP Similarity score of filenames in consecutive HTTP GET messages Similarity score of filenames in consecutive HTTP GET messages with same DEST IP Inter-Arrival Time of HTTP GET messages from same SRC IP Inter-Arrival Time of HTTP GET messages from same SRC IP with same DEST IP Ratio of (Web server memory usage/Sum of all other processes memory usage) Ratio of (Web server CPU usage/Sum of all other processes CPU usage) Ratio of count of HTTP GET/POST messages Ratio of count of HTTP GET/POST messages to/from same IP Difference in arrival times of GET and corresponding POST HTTP messages Difference in arrival times of GET and corresponding POST HTTP messages to/from same IP
Feature EWMA EWMA EWMA EWMA
Characteristic Step increase Step increase Step increase Step increase
EWMA EWMA
Step decrease Step decrease
EWMA
Step increase
EWMA EWMA EWMA EWMA
Step increase Step increase Step increase Step increase
EWMA
Step increase
is the cause for one or more other observation points, defined as their causal relationship. The causal relationship for the Apache attack’s observation points is represented as: (A, B, C) => (D, E) => (F, G).
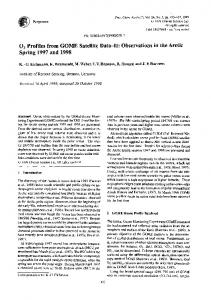
Thus, observation points A, B and C are the cause for observation points D and E, which in turn, cause observation points F and G. This relationship is quite apparent from the cause-effect chain shown in Fig. 2. A, B and C are activities that cause state effects D and E. D and E cause performance effects F and G. Temporal relationships among observation points specify the order in which observation points occur. The temporal relationship for the Apache attack’s observation points is: A(ti..j ), B(ti..j ), C(ti..j ), D(ti+1..j+1 ), E(ti+1..j+1 ), F (ti+1..j+1 ), G(ti+1..j+1 ), 0 [D(ti+1..j+1 , l1 )||D(ti+1..j+1 , l2 )][E(ti+1..j+1 , l1 )||E(ti+1..j+1 , l2 )] => [F (ti+1..j+1 , l1 )||F (ti+1..j+1 , l2 )][G(ti+1..j+1 , l1 )||G(ti+1..j+1 , l2 )], 0 Y if X causes Y , and X => Y ∧Z if X causes Y and Z . Temporal relationships are represented by the letter t and a subscript, indicated the time of the observation relative to other observations. Spatial relationships are shown in square brackets “[]”. Representing observation points and their relationships in this manner is useful. We can use information on the observation points of a set of attacks, to identify frequently appearing data elements. Monitoring these frequent data elements reduces the amount of processing required to detect attacks. Knowledge of temporal relationships is used to predict future activities and state/performance changes at an early stage. For observations that can be made at multiple physical locations, knowledge of spatial relationships is used to corroborate them, or to select an optimal set of data elements at each location. Based on knowledge of observation points and their relationships, computer data, features and characteristics useful in detecting an attack is identifiable. 3. Example attack profiles To illustrate the application of our attack profiling method to different cyber attacks, five attack profiles are shown in detail in this section. The attacks in this set include Meteor FTP Server Termination, Nmap Port Scanner, Netbus Trojan, EzPublish Confidentiality and Sobig Worm. We choose these attacks as they are all different from each other, however we do not claim that this is comprehensive coverage of all known types of attacks. Each attack profile includes the cause-effect chain of observation points, and data, features and characteristics for each observation point. 3.1. Meteor FTP server termination Meteor FTP is a server running file transfer protocol (FTP), which has a vulnerability in the login process. If a remote user types a username and follows it with a long string of characters, the buffer allocated to store this information overflows and the server stops operating. This vulnerability exists because the software does not account for the length of the username. The server process is terminated by the operating system for attempting to access out of bound memory caused by the overflow. Thus, this is a denial of service attack (since the terminated process can no longer provide service) on the FTP service, launched over the network. For this example, only the denial of service is considered, although the buffer overflow could be misused for other potential attacks on the system. As shown in Fig. 3, we identify four observation points. The long input string causes the buffer overflow which in turn causes the termination of the FTP service. This has the performance effect of reducing FTP traffic to the computer. This also leads to several failed connection attempts to the FTP server. Location l1 represents the victim computer, and l 2 represents the router connecting it to the network. Observation points A, C and D can be observed at the computer as well as at the router, as indicated. Temporally, observation point A occurs before B, while points C and D occur at the same time. Observation point A is the cause for observation point B, which is in turn the cause for observations C and D to occur.
30
N. Ye et al. / Attack profiles to derive data observations, features, and characteristics
Activity 1: Attacker connects to FTP server and issues long username
Activity 2: FTP server tries to access out-ofout-ofbound memory region
Activity 3: The OS blocks out of bounds memory access, terminates server.
Activity 4: Application indicates termination by OS due to bad memory access
Activity 5: FTP requests are sent to server and get responses of failure.
Observation A: A: Long username sent by user
Observation B: B: FTP server termination from logs
State 1: FTP resource no longer available on target machine.
Performance 1: No file transfers take place anymore through FTP.
Observation C: C: Fall in network traffic to FTP server
Observation D: D: FTP connection attempt failures
Fig. 3. Cause-effect Chain – Meteor FTP Server Termination.
Each of these observation points is explained in terms of DFCs in Table 2. For example, observation point A captures the information that the username request is unusually long. Thus, its characteristic is that the length is greater than a previously determined threshold. This threshold could be determined based on the application and the expected length. 3.2. Nmap port scanner Nmap (short for network mapper) is a free utility for network exploration or security auditing. It was designed to rapidly scan large networks, although it works fine against single computers. Nmap uses raw Internet Protocol (IP) packets in novel ways to determine what computers are available on the network, what services (application name and version) those computers are offering, what operating systems (and versions) they are running, what type of packet filters/firewalls are in use, and dozens of other characteristics [19]. In this example, we profile two specific activities: Nmap Port Scanner and Nmap Service Scanner. Because Nmap scans identify open ports, and services running at these ports, we consider this a confidentiality attack. Further, it is a network based attack since the attacker is at a remote location. This attack could be followed by subsequent attacks that use the acquired information. Figures 4 and 5 show the cause-effect chains for the two phases of Nmap profiled here. Figure 4 describes the cause-effect chain for the Nmap Port Scanner, which attempts to identify open ports on a
N. Ye et al. / Attack profiles to derive data observations, features, and characteristics
31
Table 2 Data, features and characteristics – Meteor FTP server termination OBS A
Location l1
Feature individual observation
Characteristic Greater than a
individual observation
Greater than a
l1
Data Length of field in FTP request packet Length of field in FTP request packet sent to victim Application log
individual observation
l1
FTP server log
individual observation
l1 l2 l1
TCP packets/sec TCP packets/sec to FTP server’s IP address Count of TCP RST packets from SRC PORT Count of TCP RST packets from SRC PORT from victim IP
EWMA EWMA EWMA
has value “Access Violation at Program Terminated” has value “server process terminated by operating system” Step increase Step increase Step increase
EWMA
Step increase
l2 B
C D
L2
State 1: Victim machine/network information is confidential.
Observation A: TCP SYN packets received by all ports on the victim
Activity 1: Nmap sends SYN packets to all ports on victim.
Activity 2: If victim port is open, it replies with a SYN/ACK. Else, it replies with a RST
Observation B: All open ports on the victim send TCP SYN/ACK packets
State 2: Confidentiality of the ports compromised.
Fig. 4. Cause-effect Chain – Nmap Port Scanner.
system. This uses a “half-open SYN scan”, where the attacker sends TCP SYN packets to ports on the victim. If the port is open, it responds with a SYN/ACK packet, if it is closed it responds with an RST packet. While such behavior is normal in isolation, when all ports receive SYN requests, or when all open ports respond with SYN/ACK packets in a short time, it is indicative of a scan. These are the two observation points A and B for this scan, as shown in the cause-effect chain. In the version scan shown in Fig. 5, Nmap Service Scanner attempts to identify the particular service running at each open port, the software vendor, and any version information. This information can be used by attackers for further attacks, for example, to locate machines which have a particular vulnerable service running. In the version scan, Nmap initially connects to the open ports and checks for a response. Nmap can determine some of the software/versions just by matching the response received to regular expressions from its services database. For the ones which are not yet identified, Nmap will send a sequence of probes from its list of Nmap service probes and attempt to match the response to known responses from different services/versions. When compared with normal scenarios, we get the observation points C and
32
N. Ye et al. / Attack profiles to derive data observations, features, and characteristics State 1: Victim machine/network information is confidential.
State 2: Nmap is aware of open ports through a previous scan
Activity 1: Nmap does a null probe (opens TCP connection), attempts to match response to regular expression Failure/partial success
Activity 2: 2: Does a primary probe based on port number and matches with regular expression from narrowed list.
Observation C: TCP connection established at all open ports on the victim Success State 3: Service/version number information for open ports known
Activity 3: Known attacks on the open ports possible henceforth
Observation D: Subset of open ports receive one/ more well known Nmap probes
Fig. 5. Cause-effect Chain – Nmap Service Scanner.
D, as shown in Fig. 5. The first point is that connections are established on open TCP ports in an attempt to scan the software version. The second point is when a sequence of well-known Nmap probe strings is received at the open ports. The initial port scan gives a list of open ports, which is later used in the service scan. Thus, observation point A is the cause for the remaining points. Points A and B occur during the port scanning phase, while points C and D occur during the version scanning phase, as indicated by their temporal relationships. Further, since this is a network based scan, each observation point can be identified at either the computer or the router of the computer’s network. Each observation point presents several data, features and characteristics that can be used to identify it. For example, a port scan with SYN packets could be identified by analyzing the number of ports receiving SYN packets over time (increases), the number that receive RST packets (increases), the ratio of SYN to ACK packets that ports receive (increases) and the number that return SYN/ACK acknowledgements (increases). DFCs from Table 3 can be used to explain the observation points for each attack. 3.3. Netbus trojan In the Netbus Trojan attack, an attacker fools a user into installing a copy of the Netbus server on the victim machine. The method used by the attacker to fool the user is a Trojan containing both the Netbus server and the game Whack-a-Mole. The user is emailed the Trojan, or a link to it. When the user installs the game, the Netbus server is installed clandestinely. The attacker can now use the Netbus server as a back door to gain access to the system with the same privileges as the user who installed it. The attacker can initiate further attacks once access is obtained. This attack affects the integrity of the victim machine. As seen in the cause-effect chain in Fig. 6, the Trojan service is added as a process on the system, to run automatically on startup. The user is not aware of this action, which qualifies as observation point A for
N. Ye et al. / Attack profiles to derive data observations, features, and characteristics
33
Table 3 Data, features and characteristics – Nmap scanner OBS A
Loca-tion l1 l2 l1 l2 l1 l2 l1 l2
B
l1 l2
C
l1 l2 l1 l2 l1
D
l2 l1 l2
Data Number of ports receiving TCP SYN packets in time interval t Number of ports receiving TCP SYN packets in time interval t on victim Number of ports receiving TCP RST packets in time interval t Number of ports receiving TCP RST packets in time interval t at victim Ratio of count of TCP SYN to ACK messages received Ratio of count of TCP SYN to ACK messages to victim Ratio of number of ports sending SYN/ACK packets to ports sending RST packets Ratio of number of ports sending SYN/ACK packets to ports sending RST packets from victims IP Number of ports sending TCP SYN/ACK packets in time interval t Number of ports sending TCP SYN/ACK packets in time interval t on victim Number of ports sending TCP RST packets in time interval t Number of ports sending TCP RST packets in time interval t on victim Number of ports with TCP connections in time interval t Number of ports with TCP connections in time interval t at victim Number of ports receiving a string from Nmap list of probe strings in time interval t Number of ports receiving a string from Nmap list of probe strings at victim in time interval t Number of ports sending a string from Nmap list of match strings in time t Number of ports sending a string from Nmap list of match strings at victim in time interval t
Feature EWMA EWMA EWMA EWMA EWMA EWMA EWMA
Charact-eristic Step increase Step increase Step increase Step increase Step increase Step increase Step increase
EWMA
Step increase
EWMA EWMA
Step increase Step increase
EWMA EWMA EWMA EWMA EWMA
Step increase Step increase Step increase Step increase Step increase
EWMA
Step increase
EWMA
Step increase
EWMA
Step increase
Table 4 Data, features and characteristics – Netbus trojan OBS A
B
C
Location l1
l1
l1 L2
Data Security log
Feature individual observation
Security log
individual observation
List of open ports on the computer (not monitored currently) List of open ports on the computer (not monitored currently) Port’ field of TCP SYN packet Port’ field of TCP SYN packet sent to victim
individual observation individual observation individual observation individual observation
Characteristic has value “New Objects added to registry” has value “New system service started” added to the list opened by an application not in the allowed list
this attack. The Trojan server also opens a port, typically 12345 to serve clients, again without the user’s knowledge or permission. If a list of applications that are allowed to access network ports is maintained, then this action becomes observation point B. As an extension to the previous observation point, when the Netbus client (attacker) attempts to connect to the previously never-used port, observation point C occurs. We consider the relationships among observation points for the Netbus Trojan. Locations l 1 and l2 represent the computer and the router of the computer’s network respectively. Observation point C can be identified at the computer or router, while the points A and B can be identified only at the computer. When considered in terms of cause and effect, point A is the cause for points B and C. In terms of their temporal relationships, point A precedes point B, which precedes point C.
34
N. Ye et al. / Attack profiles to derive data observations, features, and characteristics State 1: User running WinNT or other vulnerable OS Activity 1: Attacker sends Trojan along with a game as an email/html link Activity 2: Victim installs the game (and unknowingly Trojan server)
Activity 3: Netbus server opens TCP port 12345 on victim.
Activity 4: Netbus client on the attacker connects to victim s netbus server at TCP port 12345
Activity 5: Attacker can do miscellaneous actions on victim through the netbus server.
State 2: Integrity of the victim breached.
Observation A: New system service added to startup automatically
Observation B: Port opened for connection by disallowed service Observation C: Attempt to connect to the new port
State 3: Confidential information can be accessed.
Fig. 6. Cause-effect Chain – Netbus Trojan.
For each observation point, the data, features and characteristics are expressed in Table 4. Sometimes, an observation point will be determined by two separate data, features and characteristics, both of which are necessary for the observation point. These are referred to as sub-indicators. For example, observation point A is at the computer, with two sub-indicators. Sub-indicator 1 is an individual observation of a specific string in the windows security log, while sub-indicator 2 is an individual observation of another specific string. Both of these, in combination, indicate observation point A. The other observation points B and C are explained in Table 4 in terms of their DFCs. 3.4. EzPublish confidentiality The EzPublish forum is a content management system with several reported vulnerabilities [32]. A remote user can obtain system information, including the password for the underlying database, and determine the installation path. A remote user can submit a specially crafted request to obtain a file that contains the username and password for the underlying database and other system information. A demonstration request is: http://[target]/settings/site.ini. This request gives the user the site.ini file, in the settings directory. Ordinarily, this file would have been out of bounds for the non-administrative user, but in this case, the EzPublish utility does not protect it. Thus, this attack is considered a confidentiality attack, since it reveals the database username and password to unauthorized users of the content management system. As shown in the cause-effect chain in Fig. 7, the software is installed and running on the victim before the attack begins. A user of the software connects remotely to the server through its standard HTTP port
N. Ye et al. / Attack profiles to derive data observations, features, and characteristics
35
Table 5 Data, features and characteristics – EzPublish confidentiality OBS A B
Location l1 l2 l1 l2
Data Filename of HTTP GET request Filename of HTTP GET request to computer Filename of HTTP GET request Filename of HTTP GET request to computer
Feature Individual observation Individual observation Individual observation Individual observation
Characteristic String match with settings String match with settings String match with .ini String match with .ini
State 1: Machine has EZpublish EZpublish software installed
Activity 1: Non-admin user requests settings file from settings directory
Activity 2: CMS software returns file to user
State 2: Confidentiality of CMS software /database breached
Observation point A: A: File from restricted directory accessed
Observation point B: B: File with system related extension accessed
Fig. 7. Cause-effect Chain – EzPublish Confidentiality.
and requests a file. This file is stored in a directory with settings information /settings/ and also has a system related file extension .ini. This file includes the username/password pair for the database. When the attacker reads this file from a remote location, the confidentiality of the software and underlying database is compromised. For this attack, two observation points are identified. The first observation A indicates a request for a file from the system folder, while the second checks for the file extension. Consider the observation points shown in Fig. 7. There is no temporal (both happen at the same time) or causal relationship (there is no cause-effect) among the two points. Spatially, the observations can be identified at both the victim’s machine as well as the router of the victim’s machine. Locations l 1 and l2 represent the victim under attack and the network which the victim is part of respectively. As shown in Table 5, a check is made if the file requested is from a system directory and if it has a system file extension. In an application like EzPublish, such a request would not be considered normal. 3.5. SoBig worm Sobig (W32.Sobig.F@mm) is an Internet worm that spread rapidly and caused damage to several computers on the Internet in August 2003 [36,39]. It is a mass-mailing worm, which spreads by emailing itself to addresses found on the victim’s machine in various files. It uses its own SMTP engine to email itself. Along with sending out emails, it also searches for network drives to infect. The emails have specific subjects such as ‘Re: your details’ and attachments such as ‘windows.scr’. When a user executes
36
N. Ye et al. / Attack profiles to derive data observations, features, and characteristics Table 6 Data, Features and Characteristics – Sobig Worm
Obs A
Location l1
Data New email in the user’s inbox (not monitored currently)
Feature Individual observation
l4
New email, with destination email address of victim (Mail server log)
Individual observation
B C D
l1 l1 l1
Individual observation Individual observation Individual observation
E F G
l1 l1 l1 l1
H
l1
Name of new process created Filename of newly created file Value of data added to registry key HKEY LOCAL MACHINE SOFTWARE Microsoft Windows CurrentVersion Run Name of old process terminated Name of new process running Value of event created Process object – thread count for winppr.exe process Process object – % processor time for winppr.exe process filenames of files accessed on disk
l1 I
l1
J
l1 l2 l4
K L
l4 l1
process object – IO data bytes/sec for process winppr.exe IP packets sent/sec from performance log IP packets received/sec and sent/sec from the router’s log IP packets received/sec from performance log E-mails received/sec DEST IP field of UDP packets, with SRC port = 8998
Characteristic 9 possible subject lines, 9 possible attachment file names, and 2 possible body lines 9 possible subject lines, 9 possible attachment file names, and 2 possible body lines Has 9 possible names “%Windir% winppr32.exe” “TrayX”=“%Windir% winppr32.exe /sinc”
Individual observation Individual observation Individual observation EWMA
9 possible names “winppr32.exe” “TrayX” Step increase
EWMA
Step increase
Type of file accessed EWMA
One of “.dbx, .eml, .hlp, .htm, .html, .mht,. wab, .txt” Increase
EWMA EWMA
Step increase Step increase
EWMA
Step increase
EWMA Count of unique values
Step increase Equals 20
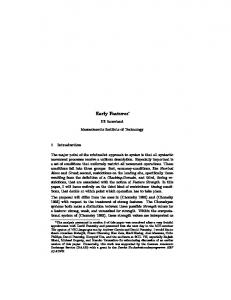
the email attachment, the user’s computer becomes infected. Figure 8 shows the cause-effect diagram for the Sobig Worm. During infection, the worm affects the integrity of the machine by creating threads, files and processes that run on startup, the confidentiality of the user by searching for e-mail addresses in files with specific file extensions such as .txt and .htm, and performance by searching the drive and mass mailing itself. Figures 8 shows observation points A to L for the Sobig Worm. These observations are made on activities, state changes and performance effects along the cause-effect chain for this attack. Corresponding to these observation points, Table 6 lists the data, features and characteristics that can be used to predict the worm. These observations are made beginning from the worm’s arrival as an email in the system under attack until the worm attempts to spread to other victims. For this attack, l1 is the computer under attack, l 2 is the router of victim network and l4 is the mail server. As shown, observation A can be made at the computer and the mail server of the victim, observations B through I and L can be made at the router of the victim, observation J can be made at all three locations and K can be made at the router of the victim. Temporally, observations F and G occur at the same time tm..n , observations H and I occur at t n..p, and L, J and K occur at t q..r . Further, observation A causes B, which causes C, D and E. These in turn cause F, G, H, I and L, which in turn cause observation J, which finally causes K.
N. Ye et al. / Attack profiles to derive data observations, features, and characteristics Activity 1: Worm arrives as email attachment on victim
Activity 2: User opens the attachment and executes worm.
Activity 3: Worm installs itself on victim, to execute on startup
Activity 4: Worm creates a new process
Activity 5: Worm creates new threads for various activities.
Activity 6: Searches files on local drive with specific extensions, for email addresses.
Observation A: A: E-mail E-mail infected with Sobig worm received by user
Observation B: B: New process, the Sobig worm started
Activity 9: Mail server receives infected emails from victim
Observation C: C: New files created by worm
State 2: Integrity of victim compromised
Observation E: New worm process started
Observation F: F: New event created
Observation G: G: New New threads created
Performance 1: Higher CPU utilization
Observation H: Higher CPU utilization
Performance 2: Increased file system accesses
Observation I: Higher file system activity
Activity 7: Try to download files from a remote server
Activity 8: Send emails to various victim addresses
37
Observation L: UDP packets sent to servers on Internet
Performance 3: Network utilization increases
Performance 4: Outgoing email activity increases
Observation J: Increased network activity
Observation K: Higher mail activity at mail server
Fig. 8. (a:) Cause-effect Chain – Sobig Worm; (b:) Cause-effect Chain – Sobig Worm.
Data, features and characteristics are shown in Table 6. Observation A can be tracked by looking for characteristics of the email subject line, attachment name and body content. Similarly, observation C can be tracked by looking for the name of newly created files. The remaining data, features and
38
N. Ye et al. / Attack profiles to derive data observations, features, and characteristics Table 7 Attacks selected for attack profiling
Attack
Objective
Attack Origin
Action
Vulnerability
Asset
State Effect
UDP Storm ARP Poison
Any
Remote (Single Source) Remote (Single Source)
Flood
Specification Design Specification Design
Network
Availability
Performance Effect Timeliness
Network
Availability Integrity
Timeliness Accuracy
Remote (Single Source)
Terminate
Implementation Process
Availability Timeliness Confidentiality
Remote (Single Source) Remote (Single Source) Local
Probe/Scan
Specification Network Design Implementation Data
Confidentiality
None
Confidentiality
None
Remote (Single Source) Remote (Single Source) Single source
Terminate
Specification Process Design Implementation Process
Availability Precision Confidentiality Accuracy Availability Timeliness
Bypass
Implementation System
Terminate
Any
Remote (Single Source)
Misdirect
Specification Design Specification Design
Photo chat Any cross site scripting Process Any Table
Remote (Single Source)
Bypass/Steal
Implementation Data & Process
Integrity Confidentiality Availability Integrity Availability Integrity Confidentiality Integrity Confidentiality
Cracking Vandalism Corporate Rivalry Half Cracking Life Buffer Vandalism Overflow Nmap Port Any Scanner EzPublish Any Dictionary
Any
Meteor FTP Netbus Trojan TCP Reset
Cracking Vandalism Any
DNS Spoofing
Any
Misdirect
Bypass/Steal Steal
Network Network
None Timeliness Accuracy None
Remote Flood (Single/Multiple Source) Remote (multiple Flood source) Remote Flood (Single Source)
Implementation System
Availability
Timeliness
Specification Network Design Implementation System & Data
Availability
Timeliness
Availability
Timeliness
Nonmalicious
Multiple source
Misuse
Implementation Network
Availability
Timeliness
Any
Single source
Misuse
Implementation Data & Network
Integrity Precision Confidentiality
Smurf
Any
Apache Web Server Chat Server Abuse Sobig Worm
Any
characteristics are explained in the table.
4. Further attack profiling efforts Based on the classification of over 150 attacks using the SFR framework, we select sixteen attacks that are representative of a variety of categories for the attack elements to develop attack profiles [47]. Table 7 provides a list of these attacks, which are profiled in [16]. We also review and extract the data, features and characteristics of attack data employed for detecting cyber attacks in existing studies, and summarize them in Table 8. These studies cover a broad range
N. Ye et al. / Attack profiles to derive data observations, features, and characteristics
39
Table 8 Survey of Data, Features and Characteristics used in current literature Paper Attacks addressed (Staniford- Worms, co-coordinated Chen, large scale network attacks 1996) (Feng, 2003)
(Wang, 2004)
(Ilgun, 1995)
(Lindqvist, 1999) (Ye, 2001)
(Anderson, 1980) (Barbara, 2001) (Cabrera, 2001) (Sion, 2002) (Ye, 2001)
(Ye, 2001) (Ghosh, 1999)
Data TCP network connections between computers on the network
Features – Activity Graphs of computers and connections between nodes, over time
Characteristics 1: Number of connections in graph > threshold 2: Number of computers in graph > threshold – Privilege escalation Return addresses extracted Virtual stack list and virtual 1: Unable to get virtual attacks like Efstool, Dhcpd, from system call stack paths between two system stack list(points to buffer Gdm – Mimicry attacks (during program calls overflow) execution) 2: Missing return address from RA table 3: Incorrect virtual path list (system call anomaly) TCP based attacks, from Payload of network packets Byte frequency distribu- Mahalonobi’s distance Darpa 99 data set for a specific service tion of normal payload (current data with frequency distribution of normal data) greater than threshold Match with Crack password utility, mail Machine states, using audit State Transitions compromised state user to root attack record fields – Syn flooding TCP attack, Specific data not provided Specific feature not Specific characteristic buffer overflow attack, provided not provided failed authentication attempts Distances to k nearest Cyber attacks from the Lin- 30 audit event types (out of EWMA smoothed event clusters greater than coln laboratory evaluation 284 audit event types, Au- frequency distribution threshold data set dit data from BSM Solaris module) Masquerader, Insider Events with File references Distribution tests, repre- If measured parameter > attacks from SMF Audit trial data sented by mean and std +/− 2 .58 std deviations from mean deviation Denial of service attacks (Ts; Src:IP; Src:Port; Association rules for at- Match with known anomaly Dst:IP; Dst: Port; FLAG) tribute values for each TCP Connection, from TCP dump audit data Decode, sendmail, syslog, Sequences of System calls Compare current sequence Threshold in percentage forward-loop, sscp with dictionary of short of abnormal sequences sequences during normal operation Transitions between web Analysis of correlations – Web based attack, Less than minimum nor-Automatic spam bot pages by users between current pattern mality threshold value access and past knowledge Large value of chiSeveral privilege escalation Frequency of BSM audit 1: Type of single audit squared distance attacks event types from Solaris event, machine (all 284 events) 2: EWMA smoothed event frequency distribution, and 3: Event transition Lincoln laboratory attack Event type field of BSM EWMA smoothed event Step increase data Solaris audit data logs frequency distribution User to root, remote to local 1: equality matching algo- 1: If sequence not found, attacks – BSM audit data’s rithm compares current anomaly counter increased
40
N. Ye et al. / Attack profiles to derive data observations, features, and characteristics Table 8, continued
Paper
Attacks addressed Data event ids sequence of calls to stored – Sequence of system calls set from normal profile made by processes 2: Back propagation neural network 3: Elman networks that remember state information (Ye, 2000) Lincoln laboratory attack Event type of Audit events data on the computer (Hu, 2004) Database attacks
Sequences of read/write database transactions
(Lee, 2001)
Artificial anomalies
Discrete records with features for each audit record (examples include – timestamp, duration, source IP)
(Sommer, 2003)
Exploit scans, Network attacks
Raw network traffic data as a stream of bytes
Features Characteristics 2: Neural network classification of input string as anomalous. 3: Difference between predicted value of sequence and actual value EWMA smoothed event Step change of a Hottelfrequency distribution ing’s T squared distance of an observation from the norm profile Data dependency rules Write operation withbased on pattern of access out corresponding data to data elements dependency operations. (whether other appropriate data items were updated) Detection rule that com1: Frequency patterns bines extracted features describing correlations to detect attacks among features 2: Frequently co-occurring events across records (and other features) Regular expression, 1: Regular expression /Deterministic finite match automata 2: Bad state transition Anomaly score of Clustering model that builds clusters packet(sum of anomaly of normal observed values scores of each header) greater than threshold for each field
(Mahoney, Probes, Denials of service Every packet header field 2001) attacks (for Ethernet, IP, TCP protocols) -and- Normal range of values for each header field (Krugel, DNS attacks Protocol specific Service 1: Type of request 2002) request on the network (ex: 2: length of request 3: Payload distribution (for HTTP GET request) a specific protocol) (Kruegel, 2003)
Web based attacks
URIs extracted from successful HTTP GET requests from web server log files
(Michael, 2002)
Lincoln laboratory attack Stream of BSM audit events data for system calls made per process
(Taylor, 2001)
Port sweep, Satan denial of service, Nmap and Satan scanners, mail bomb denial of service
Following variables from unique TCP sessions: 1: Percent of TCP control packets/session
If Chi-squared test score > threshold. (Anomaly score is sum of type of request, length of request and payload distribution) 1: Probability of length – Query length ‘l’ occurring is less than – Query character threshold (using Chebydistribution shev inequality) 2: Pearson’s chi-squared test (whether current query falls in normal query category) 1: Finite state automaton 1: Anomaly score based 2: string transducer, with on state transitions distance between current 2: Distance metric vector and the normalized greater than threshold density vector (estimated probability distribution is the vector) 1: Clustering (based on Mahalanobi’s Distance Euclidean distance) using greater than threshold Principal component analysis (to reduce number of
N. Ye et al. / Attack profiles to derive data observations, features, and characteristics
41
Table 8, continued Paper
Attacks addressed
Data 2: Average bytes transferred 3: Push and Ack flag counts 4: Total packets {Process, query, key, response and return value} variables from each registry access
(Apap, 2002)
Registry based attacks – example: Setup Trojan, back orifice, disable Norton, L0phtcrack
(Eskin, 2002)
Denial of service, remote to local, user to root and probing
1: 41 variables from TCP sessions like duration and bytes transferred. 2: List of all system calls made per process, from BSM data
(Barford, 2003)
1: {ifHCInOctets, ifHCOutOctets, ifHCInUcastPkts and ifHCOutUcastPkts} SNMP counters 2: Packet and byte counts for IP flows (input data treated as signals, organized into low frequency and high frequency strata)
Wavelet analysis Frame-let system- using bi-frame version of a system known as PS(4,1)Type II
Features variables)
Characteristics
1: Likelihood of observed variable occurring, using max likelihood estimate 2: conditional probability of one variable occurring, given another variable 1: cluster based algorithm based on density of other near points 2: k-nearest neighbors method 3: Support vector machine based algorithm that identifies low support regions of probability distribution High deviation score (identified by thresholding technique) points to anomaly
Probability less than threshold value
Distance metric greater than threshold
of attacks including worms, large scale network, privilege escalation, confidentiality, buffer overflow, insider, web based, database, scans and registry attacks. We compare the data, features and characteristics discovered through the attack profiles of the sixteen attacks in our study with those extracted and summarized from existing studies on cyber attack detection. We observe that most of the existing studies use only activity data (such as network traffic data and computer audit log data), leaving out state and performance data, along with their correlations. As a result, several observations that could help differentiate attacks from normal use behavior cannot be identified in existing studies. For example, consider the Process Table attack, where the attacker repeatedly spawns many instances of a process to inundate the process table and cause a denial of service. This attack is not easy to identify unless its state and performance effects are considered. However, observing the number of active processes started by a given process in the system measured over time (from the performance logs) would easily identify such an attack. Thus, using state/performance data can be helpful in attack detection. We explicitly investigate and express the causal, temporal and spatial correlations between observations. Most of the existing studies examine data at separate discrete locations and time points, without considering their relationships. Spatial relationships help in optimizing the selection of locations at which observations need to be observed. Temporal and causal relationships may help in predicting attacks earlier. Our attack profiles lead to the identification of a number of novel data, features and characteristics that are not reported in other studies. Table 9 provides examples of these from several attack profiles. Each
42
N. Ye et al. / Attack profiles to derive data observations, features, and characteristics
of these examples is a new and original way of identifying the corresponding observation based on the SFR framework. Note that there are many observations of state changes (e.g., “FTP connection attempt failures”, indicating unavailability of FTP server) and performance changes (e.g., “Web server response time increases” and “FTP connection attempt failures”) in Table 9 that are discovered using the SFR framework but are not reported in other studies. 5. Generalization of data, features and characteristics We generalize data, features and characteristics corresponding to observation points across all the attack profiles in our research. This generalization helps increase the coverage of similar or related attacks by generalized data, features and characteristics of attack observations, thus possibly leading to identification of newer/unknown attacks that follow behavior similar to known, profiled attacks. This is especially important since most new attacks seen today are either minor modifications of existing attacks, or follow similar patterns as existing attacks. It is also significant since it can help minimize the number and optimize the selection of data observation to monitor in real-time. Table 10 illustrates the generalized data, features and characteristics across all of our attack profiles. For example, consider the Netbus Trojan and Meteor FTP attacks shown in Table 10. In Netbus Trojan, a new system service (the Netbus server) is started. This is identified by looking at a log file (registry log/event logs) on the system (data) for an individual observation (feature) of a specific string (characteristic) indicating the new service. In the Meteor FTP attack, by contrast, a service that is running on the computer is terminated. This is identified by looking at a log file (data) on the system for an individual observation (feature) of a specific string (characteristic) indicating the service termination. A generalization for these two observation points would be to look for any change in status of services running on the system. This observation would capture both the start of a new service, as well as the termination of an existing service. Thus, the generalized observation point will capture both the individual observation points. More importantly, this generalization may also be effective for observation points from any other known/unknown attacks which either start or terminate a system service. As another example, some attacks such as the Nmap Scanner involve access by the attacker to less common ports on the computer. In Nmap Scanner, the attacker accesses various less-than-common ports in an attempt to identify open ports. Thus, if the frequency ratio of access to common ports (like web, ftp and secure shell) to access of infrequent ports is measured, it will identify this port scan. More generally, it will also identify attacks which involve access to infrequent ports on the computer. In a similar manner, several other generalized data, features and characteristics are illustrated in Table 10. 6. Conclusion In this paper, we review existing methods of describing cyber attacks and identify missing attack elements in those methods. We survey data, features and characteristics used to detect attacks in many existing studies and point out their drawbacks. We develop the SFR framework of describing cyber attacks and accordingly propose a method of attack profiling based on concepts from system modeling, to include resource-process interactions and activity-state-performance interactions, risk assessment to embed asset, vulnerability and threat, and fault modeling to consider cause-effect chains for describing and profiling cyber attacks. We present attack profiles for a select set of representative attacks along with observation points and causal, temporal and spatial relationships among them. These observation
N. Ye et al. / Attack profiles to derive data observations, features, and characteristics
43
Table 9 Novel Data, Features and Characteristics – Examples From attack Apache Denial of Service
Nmap Port/Service Scanner Meteor FTP Server Termination
Observation Multiple HTTP requests for the same file
Data Pair-wise observations of filename in HTTP GET requests
Feature EWMA
Characteristic Step increase
Requests from one source arrive unusually fast Web server response time increases
Inter arrival times of HTTP GET requests from the same source Difference in HTTP GET request and corresponding HTTP POST to the same source Ratio of count of HTTP GET/POST messages Ratio of count of TCP SYN to ACK messages received
EWMA
Step decrease
EWMA
Step increase
EWMA
Step increase
EWMA
Step increase
EWMA
Step increase
EWMA
Step increase
EWMA
Step increase
Individual observation
More http requests arrive than are serviced SYN packets received by all ports on the victim All open ports respond to TCP SYN packets FTP connection attempt failures Fall in network traffic to server
Netbus Trojan
Port opened for service by distrusted service
Smurf attack
More ICMP response packets arrive, than requests were sent, at router Increase in ICMP echo reply packets addressed to victim Multiple processes started from same parent process
Process table attack
Number of active processes increase ARP poison attack
All updates do not have same value
UDP storm attack Sobig Worm
Increase in UDP traffic compared to TCP traffic Higher e mail activity at mail server Higher file system activity
Number of ports sending TCP SYN/ACK packets from at victim Count of TCP RST packets with SRC PORT sent from victim TCP packets/sec to FTP server’s IP address List of open ports on the computer Ratio of ICMP response/sec to request/sec at the router
EWMA
Port opened by distrusted application Step decrease
Inter-arrival time of ICMP echo reply packets Similarity scores of pair-wise observations of Creating process id from processor object (for each process) Processor queue length from system object Target HA field of ARP reply packets received
EWMA
Step decrease
EWMA
Step decrease
EWMA
Step increase
String comparison of values EWMA
All updates do not have same value Step increase
EWMA EWMA
Step increase Increase
Ratio of UDP packets/sec to TCP packets/sec E-mails received/sec process object – IO data bytes/sec for process winppr.exe
points are described in terms of data, features and characteristics. We generalize the data, features and characteristics of observations across all our attack profiles, and compare these in our attack profiles with elements used in other studies on cyber attack detection to illustrate novel data, features and characteristics of attack observations discovered through our attack profiles. Attack profiling for a broad set of attacks will allow us to identify frequently seen data, features and characteristics, and relationships among observation points. This aids in optimizing the selection of data variables that need to be tracked and analyzed, for effective detection of these attacks. Thus, along with the example attacks profiled in this paper, we focus on a set of representative attacks from a broad range including buffer overflows, denials of service, privilege escalation, confidentiality, cross-site scripting, worms, Trojans, database insider attacks and attacks on large scale networks.
44
N. Ye et al. / Attack profiles to derive data observations, features, and characteristics Table 10 Generalization of Data, Features and Characteristics
Generalized Data/ feature/ characteristic The length of the buffer to hold the packet header Total similarity score from string comparisons in all the fields of pair wise packets The access ratio of common files to uncommon files Intensity ratio of incoming packets to outgoing packets Access ratio of common to uncommon ports
Same change in specific performance object on two/more computers on the network Frequency ratio of common entries to uncommon entries in the Windows system/ security/ application log Ratio of incoming to outgoing traffic volume per second String in system/ security/ application log indicating start/ end of computer /network application without normal procedure File from restricted directory accessed by non administrative user File with system specific extension accessed by non administrative user Computer connection to distrusted remote machine over the network Network data with code to open a new shell on the system Multiple processes started by same parent process Registry key edited by user without administrative privileges User added/removed to system by process other than usrmgr service Yaga user to root Sudden failure seen in using a system resource like network, files and memory
Attack(s) Addressed Apache Apache
Attack-specific Data, Features and Characteristics
UDP Storm Apache
Identical packets sent/received by victim machines Multiple HTTP packets requesting same file
Apache
More HTTP requests arrive than are serviced
Nmap Port Scanner Netbus Trojan Smurf IRC Chat Server Abuse UDP Storm
TCP SYN packets received by all ports on the victim Attempt to connect to the new port on victim Increase in ICMP echo reply packets to victim New port opened for service on server
HTTP packets with large headers Multiple HTTP packets requesting same file
Dictionary
Increased network traffic by constant amount on both machines Multiple login failures
Meteor FTP
Fall in network traffic to ftp server
Smurf Netbus Trojan
Increased incoming traffic New system service added to startup automatically
Half-Life EzPublish
Client application terminated abnormally File from settings directory of EzPublish application is accessed File with system specific extension is accessed by non administrative user Half life client connects with distrusted half life server on the network Response has code to open a new shell
EzPublish Half-Life Half-Life Process Table Yaga user to root
Multiple calculator processes started by same user process Unauthorized registry edit/New file added
Yaga user to root
New user added, not by usrmgr service
user removed, not by usrmgr service ARP Poison
Victim is unable to reach destination
Our SFR framework of attack description and profiling addresses the drawbacks of other methods. First, our SFR framework explicitly addresses state and performance changes, along with the correlations of activity, state and performance changes in the cause-effect chain, whereas state changes and performance impact are often missing in the other methods. Next, the SFR-based method of attack profiling leads to the discovery of a number of novel data, features and characteristics that are not reported in other studies, as shown in Table 10. Each of these examples is a new and original way of identifying the corresponding
N. Ye et al. / Attack profiles to derive data observations, features, and characteristics
45
observation, not seen in current literature. Finally, in our study we generalize data, features and characteristics across attacks. This allows us to choose data elements, features and characteristics that can be used for more than one attack (including new attacks), having similar characteristics. This allows us to optimize their selection for monitoring and analysis for detection of attacks. The other studies do not address such generalization. Acknowledgements This material is based upon work supported in part by the Air Force Research Laboratory (AFRL) and Advanced Research and Development Activity (ARDA) of the Intelligence Community under Contract No. F30602-03-C-0233, the Air Force Office of Scientific Research (AFOSR) under Grant No. F49620-03-1-0109 and gifts from Symantec Corporation. Any opinions, findings and conclusions or recommendations expressed in this material are those of the author(s) and do not necessarily reflect the views of AFRL, ARDA, AFOSR or Symantec Corporation. References [1] [2] [3] [4] [5] [6] [7] [8] [9] [10] [11] [12] [13] [14] [15] [16] [17]
J.P. Anderson, Computer security threat monitoring and surveillance (Technical Report). Ft. Washington, Pennsylvania: J. P. Anderson Co, 1980. F. Apap, A. Honig, S. Hershkop, E. Eskin and S. Stoflo, Detecting malicious software by monitoring anomalous windows registry accesses, Proceedings of the Fifth International Symposium on Recent Advances in Intrusion Detection(RAID) (2002), 36–53. D. Barbara, N. Wu and S. Jajodia, ADAM: Detecting intrusions by data mining, In Proceedings of the IEEE Workshop on Information Assurance and Security, 2001. P. Barford, J. Kline, D. Plonka and A. Ron, A signal analysis of network traffic anomalies, Proceedings of the second ACM SIGCOMM Workshop on Internet measurement (2002), 71–82. M. Bishop, A standard audit trail format (Technical Report). Davis, CA: Department of Computer Science, University of California at Davis, 1995. Bugtraq, Mailing list archive (http://www.securityfocus.com/archive/), 2003. J.B.D. Cabrera, L. Lewis and R.K. Mehra, Detection and classification of intrusions and faults using sequences of system calls, ACM SIGMOD 30(4) (2001), 25–34. M.J. Cox, Overview of security vulnerabilities in Apache httpd 1.3 (http://www.apacheweek.com/features/ security-13), 1998. F. Cuppens and R. Ortalo, Lambda: A language to model a database for detection of attacks, Proceedings of the Third International Workshop on the Recent Advances in Intrusion Detection (2000), 197–216. D. Curry and H. Debar, Intrusion detection message exchange format, data model and extensible markup language (XML) document type definition (Internet Draft: http://xml.coverpages.org/draft-ietf-idwg-idmef-xml-10.txt), 2003. S.T. Eckmann, G. Vigna and R.A. Kemmerer, STATL: An attack language for state based intrusion detection, Journal of Computer Security. 10(1/2) (2002), 71–104. E. Eskin, A. Arnold, M. Prerau, L. Portnoy and S. Stoflo, A geometric framework for unsupervised anomaly detection: Detecting intrusions in unlabeled data, in: Applications of Data Mining in Computer Security, D. Barbara and S. Jajodia, eds, 2002, pp. 77–102. H.H. Feng, O.M. Kolesnikov, P. Fogla, W. Lee and W. Gong, Anomaly detection using call stack information, Proceedings of the IEEE Symposium on Security and Privacy (2003), 62. E.A. Fisch and G.B. White, Secure computers and networks: Analysis, design and implementation., Boca Raton: CRC Press, 2000. A.K. Ghosh, A. Schwartzbard and M. Schatz, Learning program behavior profiles for intrusion detection, Proceedings 1st USENIX Workshop on Intrusion Detection and Network Monitoring (1999), 51–62. B. Harish, Cyber attack profiling using cause-effect networks (Master’s Thesis), Tempe, AZ: Arizona State University, 2004. Y. Hu and B. Panda, A data mining approach for database intrusion detection, Proceedings of the 2004 ACM Symposium on Applied Computing. (2004), 711–716.
46 [18] [19] [20] [21] [22] [23] [24] [25] [26] [27] [28] [29] [30] [31] [32] [33] [34] [35] [36] [37] [38] [39] [40] [41] [42] [43] [44] [45] [46] [47]
N. Ye et al. / Attack profiles to derive data observations, features, and characteristics K. Ilgun, R.A. Kemmerer and P.A. Porras, State transition analysis: A rule-based intrusion detection approach, Software Engineering Journal. 21(3) (1995), 181–199. Insecure, Nmap Security Scanner (http://www.insecure.org), 2004. C. Kruegel and G. Vigna, Anomaly detection of web-based attacks. Proceedings of the 10th ACM Conference on Computer and Communication Security. (2003), 251–261. C. Krugel, T. Toth and E. Kirda, Service specific anomaly detection for network intrusion detection, Proceedings of the 2002 ACM symposium on applied computing. (2002), 201–208. W. Lee, S. Stolfo, P. Chan, E. Eskin, W. Fan, M. Miller, S. Hershkop and J. Zhang, Real Time Data Mining-based Intrusion Detection, In Proceedings Second DARPA Information Survivability Conference and Exposition. (2001), I85–I100. U. Lindqvist and P. Porras, Detecting computer and network misuse through the production-based expert system toolset (P-BEST), Proceedings of the 1999 IEEE Symposium on Security and Privacy. (1999), 146–161. M.V. Mahoney and P.K. Chan, Detecting novel attacks by identifying anomalous network packet headers (CS-2001-2). Melbourne, FL: Florida Institute of Technology, 2001. L. Me, Gassata: A genetic algorithm as an alternate tool for security audit trails analysis, In the proceedings of the Third International Workshop on the Recent Advances in Intrusion Detection (RAID). Web proceedings: (http://www.raidsymposium.org/raid98/Prog RAID98/Talks.html#Me 06), 1998. P. Mell, Understanding the world of your enemy with I-CAT (Internet-Categorization of Attacks Toolkit). Proceedings of 22nd NIST-NCSC National Information Systems Security Conference (1999), 432–443. C.C. Michael and A. Ghosh, Simple, state-based approaches to program-based anomaly detection, ACM Transactions on Information System Security. 5(3) (2002), 203–237. C. Michel and L. Me, Adele: An attack description language for knowledge based intrusion detection, Proceedings of the 16th International Conference on Information Security (2001), 353–365. V. Paxson, Bro: A system for detecting network intruders in real time, Computer Networks 31(23–24) (1999), 2435–2463. M. Roush and W.M. Webb, Applied reliability engineering College Park, MD: University of Maryland, 2000. Secure Networks, Custom attack simulation language (http://www.sockpuppet.org/tqbf/casl.html), 1998. Security Tracker, Archives, alert ID: 1006578 (http://securitytracker.com/alerts/2003/Apr/1006578.html), 2004. R. Sion, M. Atallah and S. Prabhakar, On-the-fly intrusion detection for web portals (2002-36). West Lafayette, IN: Purdue University, 2002. R. Sommer and V. Paxson, Enhancing byte level network intrusion detection signatures with context, Proceedings of the 10th ACM Conference on Computer and Communication Security (2003), 262–271. S. Staniford-Chen, S. Cheung, R. Crawford, M. Dilger, J. Frank, J. Hoagland, K. Levitt, C. Wee, R. Yip and D. Zerkle, The design of GrIDS: A graph-based intrusion detection system, Proceedings of the 19th National Information Systems Security Conference (1996), 361–370. Symantec, Security Response: W32.sobig.F@mm (http://securityresponse.symantec.com/avcenter/venc/data/
[email protected]), 2004. C. Taylor and J. Alves-Foss, NATE - Network analysis of anomalous traffic events: A low-cost approach, Proceedings of the 2001 Workshop on New Security Paradigms (2001), 89–96. S.J. Templeton and K. Levitt, A requires/provides model for computer attacks Proceedings of the 2000 Workshop on New Security Paradigms (2001), 31–38. TrendMicro, Technical Details: Worm Sobig.F (http://www.trendmicro.com/vinfo/virusencyclo/default5.asp? VName=WORM SOBIG.F&VSect=T), 2003. K. Wang and S.J. Stolfo, Anomalous payload-based network intrusion detection, In Proceedings RAID 2004 (2004), 203–222. N. Ye, Q. Chen, S.M. Emran and S. Vilbert, Hotelling’s T2 multivariate profiling for anomaly detection, Proceedings of the 2000 IEEE Workshop on Information Assurance and Security (2000), 175–181. N. Ye and Q. Chen, An anomaly detection technique based on a chi-square statistic for detecting intrusions into information systems, Quality and Reliability Engineering International 17(2) (2001), 105–112. N. Ye and X. Li, A scalable clustering technique for intrusion signature recognition, In Proceedings of the 2001 IEEE Information Assurance Workshop (2001) 1–4. N. Ye, X. Li, Q. Chen, S.M. Emran and M. Xu, Probabilistic techniques for intrusion detection based on computer audit data, IEEE Transactions on Systems, Man and Cybernetics, Part-A 31(4) (2001), 266–274. N. Ye, QoS-centric stateful resource management in information systems, Information Systems Frontiers 4(2) (2002), 149–160. N. Ye and Q. Chen, Computer intrusion detection through EWMA for auto-correlated and uncorrelated data, IEEE Transactions on Reliability 52(1) (2003), 73–82. N. Ye, Newman and T. Farley, A system-fault-risk framework for cyber attack classification and profiling, Information Systems Frontiers (2005), In review.
N. Ye et al. / Attack profiles to derive data observations, features, and characteristics
47
Nong Ye is a Professor of Industrial Engineering and an Affiliated Professor of Computer Science and Engineering at Arizona State University (ASU) the Director of the Information Systems Assurance Laboratory at ASU. Her research interests lie in security and Quality of Service assurance of information systems and infrastructures. She holds a Ph.D. degree in Industrial Engineering from Purdue University, West Lafayette, and M.S. and B.S. degrees in Computer Science from the Chinese Academy of Sciences and Peking University in China respectively. She is a senior member of IIE and IEEE, and an Associate Editor for IEEE Transactions on Systems, Man, and Cybernetics and IEEE Transactions on Reliability. Her email address is
[email protected]. Harish Bashettihalli currently works with Siebel Systems as a Software Engineer on compiler development projects. He holds a Master of Science degree in Computer Science from Arizona State University and a Computer Science and Engineering degree from Bangalore University. His research focus at Arizona State University was on computer and network intrusions.
Toni Farley is the Assistant Director of the Information and Systems Assurance Laboratory, and a doctoral student of Computer Science at Arizona State University (ASU), Tempe, Arizona. She is studying under a Graduate Fellowship from AT&T Labs – Research. Her research interests include computer networks and network security. She holds a B.S degree in Computer Science and Engineering from ASU. She is a member of IEEE and the IEEE Computer Society. Her email address is
[email protected].