JMLR: Workshop and Conference Proceedings 10: 35-44 The Fourth Workshop on Feature Selection in Data Mining
Attribute Selection Based on FRiS-Compactness Nikolai G. Zagoruiko
[email protected]
Institute of Mathematics SD RAS, pr. Koptyg 4, Novosibirsk 630090, Russia
Irina A. Borisova
[email protected]
Institute of Mathematics SD RAS, pr. Koptyg 4, Novosibirsk 630090, Russia
Vladimir V. Duybanov
[email protected]
Novosibirsk State University Pirogov st. 2, Novosibirsk 630090, Russia
Olga A. Kutnenko
[email protected]
Institute of Mathematics SD RAS, pr. Koptyg 4, Novosibirsk 630090, Russia
Editor: Huan Liu, Hiroshi Motoda, Rudy Setiono, and Zheng Zhao
Abstract Commonly to classify new object in Data Mining one should estimate its similarity with given classes. Function of Rival Similarity (FRiS) is assigned to calculate quantitative measure of similarity considering a competitive situation. FRiS-function allows constructing new effective algorithms for various Data Mining tasks solving. In particular, it enables to obtain quantitative estimation of compactness of patterns which can be used as indirect criterion for informative attributes selection. FRiS-compactness predicts reliability of recognition of control sample more precisely, than such widespread methods as One-LeaveOut and Cross-Validation. Presented in the paper results of real genetic task solving confirm efficiency of FRiS-function using in attributes selection and decision rules construction. Keywords: Pattern recognition, Function of Rival Similarity, Compactness, Iformativeness
1. Introduction Two main parts “engine” and “criterion” can be partitioned in attribute selection algorithms. Engine forms different variants of attributes subsystems and criterion estimates quality of considered systems. We guess that the main element of the engine is algorithm of directed search, the main characteristic calculated by criterion is compactness of the patterns, and the basic element in compactness estimation is a measure of objects similarity. These three items are considered in this work. In Section 2 relative measure of similarity (FRiS-function) is introduced, measure of compactness of patterns based on FRiS-function is defined in Section 3, in Section 4 algorithm for decision rule construction FRiS-Stolp is described. Then, in Section 5 algorithm FRiS-GRAD for simultaneous attribute selection and decision rule construction is proposed. Effectiveness of this algorithm on real recognition task is illustrated in Section 6. c ⃝2010 Zagoruiko, Borisova, Duybanov and Kutnenko.
Zagoruiko, Borisova, Duybanov and Kutnenko
2. How to estimate similarity? Similarity of two objects z and a according to some attribute X in metric space usually depeds on difference R(z, a) between values of X for these objects. Many such type measures of similarity are described in the literature. Common peculiarity of these measures is that similarity is considered as absolute category. Similarity of objects z and a does not depend on the similarities of them with other objects. But the measure of similarity, used in pattern recognition is not so primitive. Classifying object z as a member of pattern A in case of two patterns it is important to know not only similarity of z with the A, but similarity of z with the rival pattern B, and compare these values. Consequently, the similarity in pattern recognition is not absolute but relative category. To answer the question “How much is z similar to a?” you need to know “In comparison with what?”. Adequate measure of similarity should reflect relative nature of similarity, which depends on rival situation in the neighborhood of object z. All statistical recognition algorithms take into account competition between classes. If probability density of class A in point z is equal to PA , and probability density of class B in this point is PB , then z is classified, for example, as member of class A not because value PA exceeds certain threshold, but because PA > PB . When distributions of classes are unknown or the number of attributes is higher than number of objects in training dataset, recognition methods based on probability densities are inapplicable. In these cases distances R(z, ai ) from object z to standards (representatives) of patterns Ai , i = 1, . . . , K, (K is the number of patterns) are commonly used. As a result object z is classified as a member of pattern distance to which standard is less than the distances to the standards of other patterns. For example, in the method “k nearest neighbours” (kNN) (Fix & Hodges, 1951) new object z is recognized as object of pattern A if the distance to this pattern, equal to average distance from z to its k nearest neighbours from pattern A, is smaller than the distance to the nearest rival pattern B. Similarity in this algorithm is considered in scale of order. Measures of rival similarity in strong scales are used in pattern recognition as well. Quantitative estimation of rival similarity was proposed by Kira and Rendell (1992) in the algorithm RELIEF . To determine similarity of object z with the object a in competition with the object b value W (z, a|b) is calculated, which depends on the difference between distances R(z, a) and R(z, b) to competitors in an explicit form: W (z, a|b) =
R(z, b) − R(z, a) . Rmax − Rmin
There Rmin and Rmax are the minimum and maximum distances between objects of the analyzed dataset. Normalization by the difference (Rmax − Rmin ) has some weaknesses. If dataset consists of only two objects a and b, then value of similarity of any new object z with them can not be defined because the denominator is equal to 0. The same problem appears, if dataset consists of three points located in vertex of equilateral triangle. In addition, value W (z, a|b) strongly depends on distant objects and can vary in considerable range when membership of training dataset is changed. Thus, this measure has absolute quality only within single task, its values in different tasks can not be compared to each over directly. We would like to obtain better measure of similarity. Specify properties that should have this measure: 36
Attribute Selection Based on FRiS-Compactness
1. Locality. Measure of similarity should depend on distribution of objects in the neighborhood of object z, not entire dataset. 2. Normalizing. While measure of similarity of object z with the object a in competition with object b (a ̸= b) is estimated, if z coincides with the object a, value F (z, a|b) should amount to its maximal value equal to 1, if z coincides with the b its similarity F (z, a|b) should be minimal and equal to −1. In other cases rival similarity takes values in range between −1 and 1. 3. Antisymmetry. In all cases F (z, a|b) = −F (z, b|a). If distances R(z, a) and R(z, b) from object z to objects a and b are equal then z is equally similar (and not similar) to both that objects and F (z, a|b) = F (z, b|a) = 0. 4. Invariance. Values F (z, a|b) and F (z, b|a) should be invariant under such attributes system transformation as moving, rotating and extending all coordinate axes with the same coefficient. Any sigmoid function obeys these conditions. We propose the following simple version of this function: R(z, b) − R(z, a) F (z, a|b) = . R(z, b) + R(z, a) This kind of similarity measure we called FRiS-function (Function of Rival Similarity) (Zagoruiko et al., 2008a). Function F (z, a|b) is invariant under coordinate system moving, rotating and extending all coordinate axes with the same coefficient. But extending coordinate axes with different coefficients is changed effect of individual characteristics on similarity estimation. So, the similarity between objects depends on weights of their attributes. Changing these weights one can boost similarity or difference between the specified objects, or subsets. Such technique is ordinary used in pattern recognition. After weights fixing FRiS-function measures the similarity in absolute scale: its interpretation is chaneged by adding some coefficient over than 0 to value of F (z, a|b), or multiplying F (z, a|b) by any value other than 1. It turned out that the additional information providing by absolute scale in comparing with the order scale allows to significantly improve methods of Data Mining.
3. Measure of compactness of patterns Almost all recognition algorithms are based on compactness hypotheses (Braverman, 1962). Definitions of compactness presented in literature operate such no-formalized terms as “sufficiently extensive neighborhood”, “not too complex border”, and so on. We are interested in quantitative measure of compactness directly correspondent with expected reliability of recognition. Main idea such kind measure proposed by Vorontsov and Koloskov (2006) is in the compactness profile calculation. Compactness profile is function V (j) equals to share of samples which j-th neighbor is the object of another class. Compactness profile is the formal expression of the basic idea of compactness hypotheses stating that similar objects more often lie in the same class than in different. The simpler task is, i.e. the more often close objects appears to be in the same class, the closer to the zero start part of profile V (j) is. In complex tasks or in spurious attribute subsystems all parts of profile V are close to 0.5 or another constant value depending on prior probabilities of patterns. 37
Zagoruiko, Borisova, Duybanov and Kutnenko
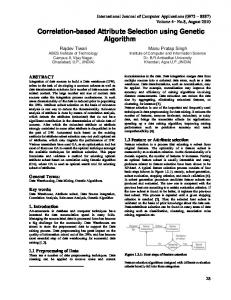
Only order between objects in dataset is important during compactness profile calculating. Consequently, if the patterns do not intersect, the profile reminds the same when variances of the patterns or the distance between them are changed. We are interested in quantitative measure of compactness, which allows estimating as single pattern compactness, as compactness of whole system of patterns in dataset taking into account any changes in the variances and distances between patterns. Such a measure should answer following requirements: 1. Universality. Measure should allow correctly evaluating the compactness of patterns with any types of probability distributions, as for each pattern individually as for the entire set of recognized patterns. 2. Sensitivity. Value of compactness should increase with the area of pattern intersection decreasing. In case of disjoint patterns compactness should depend on both the variance of the patterns and the distance between them. 3. Normalizing. Measure of compactness should take values in range between −1 (in case of full coincidence of patterns) and 1 (in case of infinite distance between patterns ). 4. Invariance. Measure should be invariant under coordinate system moving, rotating and extending all coordinate axes with the same coefficient. Using of rival similarity (FRiS-functions) allows to determining quantitative measure of compactness, meeting the specified requirements. This procedure is based on calculation of the similarity of objects from the same pattern with each over and distinctiveness (differences) of these objects with the objects of other patterns. The algorithm of FRiScompactness calculation in case of two patterns is illustrated on Figure 1 and acts as follows: 1. Similarity of each object aj , j = 1, . . . , MA , of pattern A with some fixed object ai of the same pattern in competition with nearest to aj object bj of rival pattern B is calculated on distances R(aj , ai ) and R(aj , bj ) from aj to objects ai and bj by the next formula: F (aj , ai |bj ) = (R(bj , ai ) − R(aj , ai ))/(R(bj , ai ) + R(aj , ai )). These values are added to the counter Ci .
Figure 1: Rival similarities of objects of patterns A and B with fixed object ai . 38
Attribute Selection Based on FRiS-Compactness
2. Distinctiveness of each object bq , q = 1, . . . , MB , of pattern B with the object ai is calculated, as rival similarity of bq with its nearest neighbor from the same pattern in competition with the ai . So two distances are needed: distance R(bq , bs ) from object bq to its nearest neighbor bs from pattern B, and distance R(bq , ai ) from object bq to object ai . Calculated on these distances measures of rival similarity F (bq , bs |ai ) for all objects bq of pattern B are added to the counter Ci . To averaging value Ci is divided by number of objects in dataset (MA + MB ). Resulting value C i characterizes similarity of “own” objects and distinctiveness of “anothers” objects with fixed object ai . 3. After calculating values C i for all objects ai , i = 1, . . . , MA , of pattern A average value GA of pattern A compactness is calculated: GA =
MA 1 ∑ C i. MA i=1
4. The same way compactness of pattern B can be estimated. If number of patterns in task is larger than two, then to define compactness of k-th pattern, k = 1, . . . , K, this pattern is considered as pattern A , and all other patterns associate in pattern B. 5. General value of compactness G of all K patterns estimated on given dataset is calculated as geometrical mean of all Gk : v uK u∏ K Gk . G= t k=1
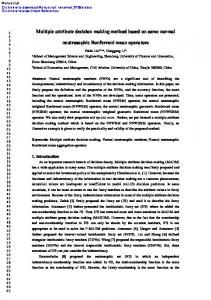
The lower the variances of patterns and the higher distances between them are, the higher value of compactness G becomes. Measure of compactness proposed by Fisher to calculate informativeness of attribute subsystems has the same peculiarity. The difference is that the Fishers measure is designed for patterns with Gaussian distributions, and measure of FRiS-compactness is applied to arbitrary distributions. Our experiments with using proposed measure of compactness as a criterion for informative attributes selection (Zagoruiko, 2009) demonstrate its higher efficiency in comparing with widely used criterion based on number of objects of training dataset unrecognized by KNN rule in the mode One-Leave-Out (OLO). These two criteria G and OLO are compared in following experiment. The initial data included 200 objects belonging to two patterns (100 objects for each pattern) in the 100-dimensional space. Attributes were generated in such a way that they have different informativeness. As a result, about 30 attributes were more or less informative, whereas other attributes generated by random number generator were certainly spurious. In addition, the dataset was distorted by noises with different intensity. For every pattern, 35 randomly chosen objects were selected for training. Other 130 objects formed the test dataset. At every noise level (from 0.05 to 0.3), the most informative subsystems were selected. The recognition reliability in selected attributes subsystems averaging over 10 experiments for each noise level is presented on Figure 2. Thin lines correspond to results on training subsets, bold lines – to results on test subsets. Attribute systems, selected with OLO, have high reliability estimations (upper dotted line) on training datasets independently of noise level. But their quality on test datasets 39
Zagoruiko, Borisova, Duybanov and Kutnenko
(lower bold dotted line) is greatly worse. Attributes selected with FRiS-compactness criterion G have more realistic reliability estimations (upper solid line) which are confirmed on test samples (lower solid bold line). Higher stability of criterion G can be explained as follows. Most of objects affected by noise are situated far from central part of pattern on the patterns bounds. Measure OLO depends on samples from the bound between patterns, while measure G is based on all objects of the pattern.
Figure 2: Results of training and test recognition with G and OLO criteria.
4. Algorithm FRiS-Stolp for set of representatives forming To classify test object z values of rival similarities of the z with typical representatives (stolps) of patterns are used. Algorithm FRiS-Stolp (Zagoruiko et al., 2008b) selects objects with defensive capability (high similarity with other objects from the same pattern allows recognizing that objects) and tolerance (low similarity with the objects of other patterns prevents their unrecognizing as “own”) to use as stolps. This procedure is realized as follows: 1. Some object ai of pattern A is tested as a single stolp of this pattern. As in compactness estimation similarity of each object aj , j = 1, . . . , MA , of pattern A, and distinctiveness of each object bq , q = 1, . . . , MB , of pattern B with ai are calculated and added to counter Ci . Averaging value C i is considered as efficiency of object ai in a role of the stolp of pattern A. 2. Step 1 is repeated for all objects of pattern A. Object ai which provides maximum value C i is selected as the first stolp of pattern A. All m1 objects of pattern A, which similarity with this stolp is higher than F ∗ (for example, F ∗ = 0), form first cluster and are eliminated from pattern A. Average value of similarity of objects from cluster Q1 with the stolp of the cluster is used as compactness of this cluster estimation. 40
Attribute Selection Based on FRiS-Compactness
3. If m1 < MA steps 1–2 are repeated on remaining objects of pattern A. As a result list of kA stolps of pattern A with values of corresponded clusters compactnesses Qj , j = 1, . . . , kA , is obtained. 4. Average weighted value of compactnesses of all clusters of pattern A: G′A
kA 1 ∑ = Qj mj . kA j=1
can be used as compactness of pattern A estimation. In contrast to GA this value characterizes quality of description of pattern A by the system of stolps. In our algorithms for inconclusive attributes elimination less labour-intensive criterion GA is used. But for more precise attribute subsystem selection criterion G′A appears to be more effective. 5. Steps 1–4 are repeated for pattern B to construct list of kB stolps of this pattern. If number of patterns in task is larger than two, then technique described in previous section is used. In case of Gaussian distributions, for example, the most typical objects of the patterns are selected by algorithm FRiS-Stolp at the points of statistical expectations. In case of multimodal distributions and linearly inseparable patterns stolps are placed at the centers of the modes (at the centers of areas of local concentrations of objects). With growing distribution complexity the number of stolps increases. The decision rule consists of the list of objects-stolps and procedure of calculation of similarity of control object z with all stolps. Object z is classified as a member of pattern similarity with which stolp is maximal. Value of rival similarity can be used as estimation of reliability of object z recognition.
5. Attributes subsystems forming. Algorithm FRiS-GRAD There are many variants of “engines” to select n most informative attributes among base set of N attributes. Main ideas of two basic greedy approaches (forward and backward searches) are used in our engine. Backward elimination (algorithm Deletion) offered by Merill and Green (1963) increases attribute subsystem quality as much as possible with each deletion of attributes. Forward selection (algorithm Addition) offered by Barabash et al. (1963) achieves this aim with each inclusion of attributes. In algorithm AdDel (Zagoruiko, 1999) next combination of these approaches is used: at first, n1 informative attributes are selected by method Add. Then n2 worst of them (n2 < n1 ) are eliminated by method Del. Number of attributes in selected subset after that two steps is equal to (n2 − n1 ). Such consecution of actions (algorithms Add and Del) is repeated until quality of selected attributes is maximum. Analysis of subsystems with different number of attributes shows that on first steps while the number of attributes increases the quality increases too. But at some moment when all informative attributes are in selected subsystem already, the quality becomes decreasing after adding redundant or not relevant attributes. Inflection on the curve of quality allows specifying optimum number of attributes. In algorithm GRAD (Zagoruiko, Borisova & Kutnenko, 2005) (“Granulated AdDel”) method AdDel works on set of most informative “granules”. Each granule consists of w attributes (w = 1, 2, 3). In list of one-dimensional granules m1 “best” according to their individual informativeness attributes (m1 < N ) are included. 41
Zagoruiko, Borisova, Duybanov and Kutnenko
Exhaustive search among all possible pairs and triplets of m1 attributes is used for m2 two-dimensional and m3 three-dimensional granules forming. Among them m most informative granules are selected and used as an input of algorithm AdDel. Comparing effectiveness of algorithms AdDel and GRAD on different tasks showed, that algorithm GRAD was much better than algorithm AdDel. To find the best subsystem of attributes and effective decision rule algorithm FRiSGRAD (Zagoruiko et al., 2008b) uses procedure of directed search, offered in algorithm GRAD. On each step some variant of attribute subsystem is formed and then algorithm FRIS-Stolp is started to construct set of stolps and to calculate FRiS-quality G′ of the subsystem. If t-dimension subsystem of attributes has been selected and q next steps of algorithm GRAD working quality of decision was decreasing then this subsystem is considered as most informative and set of stolps in this subspace determines the rule to classify new objects.
6. Recognition of two types of leukemia with algorithm FRiS-GRAD Efficiency of offered algorithm was demonstrated on task for medical diagnosis (two types of leukemia recognition). This task was interesting for us because results of its solving by different researchers were published and we could compare effectiveness of our algorithm with competitors. In the work (Guyon et al., 2002) the best in the world at the moment of the publication results obtained by Support Vector Machines (SVM) were presented. In this task analyzed data set consists of a matrix of gene expression vectors obtained from DNA micro-arrays for a number of patients with two different types of leukemia (ALL and AML) (Golub et al., 1999). Training set consists of 38 samples (27 ALL and 11 AML) from bone marrow specimens. The test set has 34 samples (20 ALL and 14 AML). It prepared under different experimental conditions and including 24 bone marrow and 10 blood sample specimens. Number of features in the task is 7129. Each attribute corresponds to some normalized gene expression extracted from the micro-array pattern. The informative subset of attributes in (Guyon et al., 2002) got out by method RFE (a version of algorithm Deletion). In selected subspace of two best attributes 30 test objects were correctly recognized, in subspace of 4 attributes number of correctly recognized objects was 31, in subspace of 128 attributes it was 33. Our results for this task were the following (Zagoruiko et al., 2008b). From 7129 initial attributes algorithm FRiS-GRAD selected 39 most informative attributes and constructed 30 decision rules: 27 of them recognized all 34 test samples correctly. Ten most informative according their FRiS-compactness G′ attribute subsystems are presented in Table 1. Indexes attached to attribute numbers show weights of these attributes in decision rules. These weights are defined by algorithm GRAD. At calculation of distances between objects the values of the attribute with weight v, are multiplied by v. Offered algorithm is linear. Its laboriousness has the order of complexity O[(N + m31 /6)M 3 ]. There M is number of objects in the mixed dataset, N is dimension of features space, m1 — number of attributes used for forming two- and three- dimension granules. Here we used m1 = m2 = m3 = 100. Difference in presented results and results of SVM can be explained by peculiarities of as attributes selection method, as algorithm of decision rule construction. To compare 42
Attribute Selection Based on FRiS-Compactness
Informative attributes 3561 , 22661 , 23581 , 26415 , 40495 , 62801 3561 , 22661 , 23581 , 26414 , 27241 , 40494 3561 , 22661 , 26414 , 37721 , 40494 , 42611 13831 , 18331 , 26414 , 40494 , 54411 , 68001 3561 , 4351 , 26414 , 40494 3561 , 4351 , 26414 , 27241 , 40494 18331 , 26414 , 40494 , 43671 , 48731 , 68001 3561 , 4351 , 26414 , 35601 , 40494 , 68001 3561 , 26414 , 28951 , 35061 , 40494 , 50591 3561 , 22661 , 26414 , 40494 , 42291 , 62801
G 0,73835 0,73405 0,73302 0,73263 0,73214 0,73204 0,73088 0,72919 0,72814 0,72699
P 34 34 34 34 34 34 34 34 34 34
Table 1: Attributes, used in decision rules in leukemia task their effectiveness SVM and FRiS-Stolp were run on subspace of two selected by method RFE attributes (genes 803 and 4846). Decision rule constructed by FRiS-Stolp correctly recognized 33 test objects, SVM — 30 objects. In subspace of one gene (4846) results of FRiS-Stolp and SVM were 30 and 27 correctly recognized objects correspondingly. For comparison decision rule constructed in best two-dimension attribute subsystem (2641 and 4049) selected by FRIS-GRAD gave 33 of 34 correct predictions, in one-dimension subsystem (2461) — 32 of 34 correct predictions. This example demonstrates high competitiveness of attribute selection and decision rule construction based on FRiS-function.
7. Conclusion Using of similarity measure which considers competitive situation, allows building effective algorithms for main Data Mining tasks solving. Function of rival similarity gives a way to estimate quantitative values of compactness of patterns, informativeness of attribute subspaces and to build easily interpreted decision rules. Presented method can be applied to tasks with any number of patterns, any character of their distributions and any ratio between number of objects and number of attributes in dataset. Laboriousness of a method allows to use it for the decision enough complex real tasks. Applied tasks decisions quality can compete with other methods. Our future researches of FRiS deal with its application on other types of tasks of the Data Mining — filling of blanks, search of associations, censoring a training dataset and analysis of other types of function of rival similarity.
Acknowledgments The given work is executed at financial support by the Russian Fund of Basic Researches, Grant 08-01-00040, by International Fund “Scientific potential” and ADTP grant 2.1.1/3235. Yu.L. Barabash, B.V. Varsky, at al. Automatic Pattern Recognition. KVAIU Publishing house, Kiev, 1963. (In Russian) 43
Zagoruiko, Borisova, Duybanov and Kutnenko
E.M. Braverman. Experiences on training the machine to recognition of visual patterns. Automatics and Telemechanics, 23(3):349–365, 1962. (In Russian) E. Fix, J. Hodges. Discriminatory Analysis: Nonparametric Discrimination: Consistency Properties. Technical report, USAF School of Aviation Med., Randolph Field, TX, Rep. 21–49–004, 1951. T.R. Golub, D.K. Slonim, P. Tamayo, C. Huard, M. Gaasenbeek, J.P. Mesirov, H. Coller, M.L. Loh, J.R. Downing, M.A. Caligiuri, C.D. Bloomfield , E.S. Lander. Molecular Classification of Cancer: Class Discovery and Class Prediction by Gene Expression Monitoring. Science, V. 286, 1999. URL: http://www.genome.wi.mit.edu/MPR/data set ALL AML.html. I. Guyon, J. Weston, S. Barnhill, V. Vapnik. Gene Selection for Cancer Classification using Support Vector Machines. Machine Learning, 46(1–3):389–422, 2002. K. Kira, L. Rendell. The Feature Selection Problem: Traditional Methods and a New Algorithm. In Proc. 10 Natl Conf. Artificial Intelligence (AAAI-92), pages 129–134, Menlo Park: AAAI Press, 1992. T. Merill, O.M. Green. On the effectiveness of receptions in recognition systems. IEEE Trans. Inform. Theory. IT-9:11–17, 1963. K.V. Vorontsov, A.O. Koloskov. Support Vectors Selection for Nearest Neighbor Classifier based on Compactness Profile. Artificial Intelligence 2:30–33, 2006. (In Russian) N.G. Zagoruiko. Applied Methods of Data and Knowledge Analysis. Publishing house of Institute of Mathematics SD RAS, Novosibirsk, 1999. (In Russian) N.G. Zagoruiko. Measure of Similarity and Compactness in Competitive Space. In Proc. of 8 International Symposium on In Intelligent Data Analysis (IDA-09), pages 369– 380, Lion, France, 2009. N.G. Zagoruiko, I.A. Borisova, O.A. Kutnenko. Informative attribute subspace selection (algorithm GRAD) In Proc. of 12 All-Russian Conf. Mathematical Methods of Pattern Recognition (MMRO-12), pages 106–109, Moskow, 2005. N.G. Zagoruiko, I.A. Borisova, V.V. Dyubanov, O.A. Kutnenko. Methods of Recognition Based on the Function of Rival Similarity. Pattern Recognition and Image Analysis, 18:1–6, 2008. Yu.L. N.G. Zagoruiko, I.A. Borisova, V.V. Dyubanov, O.A. Kutnenko. Attribute selection through decision rules construction (algorithm FRiS-GRAD). In Proc. of 9 Intern Conf. Pattern Recognition and Image Analysis, V. 2, pages 335–338, Nizhni Novgorod, 2008.
44