Auditing Large Spreadsheet Programs Markus Clermont
?
[email protected]
Roland Mittermeir
??
[email protected]
Abstract: Spreadsheets are an important device for computer based decision support. In this capacity, they might reach a level of complexity and show evolutionary patterns similar to conventional software. However, as end-user devices, they are not subjected to as rigorous a development and maintenance process as professionally written software. Thus, the significance of the decisions they are supporting and their correctness become increasingly divergent. The properties contributing to the success of small scale sheets tend to become a burden with larger sheets. This paper presents an approach that enables auditors to understand the structure of large spreadsheets by aggregating cells with related properties. It will be shown, how different auditing strategies can be supported by this approach.
1
Introduction
In contrast to conventional programs, where computations are performed internally and values are shown externally only when explicitly presented on the interface by specific I/Ooperations, spreadsheets allow their users and their writers (usually assumed to be the same person) to actively see everything that happens in a computation. This ”everything”, however, is restricted to the value-level. The dependencies among the computed values as expressed in the formulas contained in the various cells are under normal operations hidden. Only the formula-content of the single cell under the curser is shown on the screen. This property is considered to be a highly desirable feature for small sheets where the author of the sheet has a clear and complete conceptual model of the whole computation and the sheets lifetime does not exceed the lifetime of the computed results. It becomes detrimental though, when sheets become large, their lifetime exceeds the memory of the original author, or when different persons have to perform extensions and adaptations on the sheet over this life-time. Notably for these sheets, the negative results reported from studies on spreadsheet quality [11, 9] apply. To improve this situation, techniques considering the fact that spreadsheet writers are professionals in other areas than in computing are needed. Approaches relying too heavily on involved software-engineering methodologies will not be received with enthusiasm by this group of users. Hence, we propose a light-weight methodology of spreadsheet auditing. However, as cell-by-cell inspections would be too cumbersome for even moderately sized sheets, scalable support needs to be provided. The approach this paper deals with aims for huge, regular spreadsheets as commonly used in business life. These spreadsheets have usually one or more large parts were blocks ? ??
Institut f¨ ur Informatik-Systeme, Universit¨at Klagenfurt, Universit¨atsstrasse 65–67, A-9020 Klagenfurt Institut f¨ ur Informatik-Systeme, Universit¨at Klagenfurt, Universit¨atsstrasse 65–67, A-9020 Klagenfurt
consisting of several cells, e.g. rows or columns, are inherently similar. They might have been created by copy and paste operations or other regular forms of spreadsheet development. Of course, these spreadsheets also have parts, where complex calculations occur, e.g. the calculation of checksums or of some business-ratios. However, these areas are usually rather small compared to the vast regular parts. In this paper we focus on auditing strategies made feasible by forming categories of similar cells. The approach not only aims to reduce the number of items to be checked by an order of magnitude. The strategy also benefits from the fact that spreadsheet-writers usually do not arrange the computations on the sheet in random order. Thus, auditing considers not only the core content of ”similar” cells. It also considers divergences between similarity patterns resulting from the analysis provided by our tool and conceptual patterns of how computations should be placed on the sheet according to the writers conceptual model. The paper first explains the concepts used to capture similarity between cells (logical areas) and how this concept can be extended to cover similarity between regions of the sheet (semantic classes). Based on these definitions, three auditing strategies, pattern driven, SRG1 -driven and structure driven auditing, are presented and discussed. Before concluding, we will discuss the position of our work in the context of other applications for spreadsheet aggregation and visualization.
2
Background
To reduce the complexity of size that makes the comprehension and auditing of large spreadsheets so cumbersome, a conceptual model of the spreadsheet is built by grouping cells into large, coherent units. This grouping is strictly determined by the formulas 2 they contain 2.1
Logical Areas
Logical areas are the initial stage of grouping individual cells into larger units. Cells will be assigned to the same logical area, if their formulas are in one of the following equivalence classes: Copy equivalence: As defined in [13], two cells are copy-equivalent, if they have the same format, and their formulas are equal3 . Logical equivalence: Two formulas are logically equivalent, if they differ only in constant values and absolute cell-references. Structural equivalence: Two formulas are structurally equivalent, if they differ in constant values, absolute- and relative references. Nevertheless, the same operators and functions are applied in the same order to different data. A more detailed discussion of these and further equivalence classes is given in [6]. Cells with the same or a similar formula are assumed to express the same meaning. Therefore, they can be seen as one entity in the conceptual model the spreadsheet’s 1
2 3
A SRG is a directed, acyclic graph, where each node represents a set of cells. Edges link nodes when there is data-flow from some cell in the source node to some cell in the target node. Constant values are treated as trivial formulas. Cells without any entry are considered to be empty. Relative references are compared in the R1C1-notation.
creator had in mind. Although logical areas can contain cells that are spread all over the spreadsheet, these cells tend to form a regular geometrical pattern on the sheet. By visualizing these regularities the user will get a better understanding of the conceptual model behind the spreadsheet program. This enables the user (a) to maintain the spreadsheet without introducing inconsistencies into the model, (b) to find dangerous parts of the spreadsheets more easily, and (c) to reduce the testing effort. The first point is very important because certain spreadsheets that are used for periodical data collection and reports have very short maintenance cycles. Each maintenance cycle, though, tends to introduce new errors (see [3]). The dangerous parts of the spreadsheets are those were irregularities in the geometrical pattern of the conceptual model occur. These irregularities are generally a sign for inconsistent maintenance or error-corrections having taken place. Of course, these parts have to be tested very carefully and eventually need to be corrected. In a large field audit, a prototype to identify logical areas has been effectively used [3]. It helps the user to find logical areas and visualizes the data-flow between the logical areas. This toolkit is integrated into the gnumeric spreadsheet system. The experience gained in using this tool suggested, however, to further broaden the concept of logical areas. Semantic classes can be considered a generalization of this concept suitable for very large sheets. 2.2
Semantic Classes
Semantic classes are formed by similar cells with similar spatial neighbors. The strict adherence to recover the writers conceptual model from the contents of the cells has been kept, but auditors can provide the tool with hints, suggesting whether the sheet follows mainly a column-wise or mainly a row-wise pattern. (Patterns leading to repetitions of not-trivial rectangles can also be identified). To achieve this, users may define, which cells they consider to be neighbors, depending on their view of the spreadsheet (row or column-oriented, dense or sparse). The individual semantic units partaking in a semantic class are groups of cells which satisfy the following combination of semantic and spatial constraints: 1. Cells within a unit must not be separated by more than d foreign cells. (Such foreign cells are usually empty cells or labels). 2. Cells of different units of the same class, residing within their unit on the same relative position have to belong to the same equivalence class. ’The first constraint requires semantic units to be spatially relatively dense. Denseness is expressed by geometrical constraints defined in a distance vector. The geometrical constraints auditors can impose on the unit define the direction and maximal distance of cells partaking in the same semantic unit. Hence, semantic units can be forced to have an extent only in one dimension, by specifying 0 as the maximal distance for all other dimensions. Further, to be consistent with the notion of multi-dimensionality, distances can be indicated over several dimensions. For the two-dimensional case this implies three distance parameters: dv , dh and dm with dv denoting the maximal vertical distance allowed between two cells in a semantic unit, dh the maximal horizontal distance allowed, and dm the maximum Manhattan distance between two cells in the unit without cells not belonging to this unit in-between. By adjusting these parameters, users can restrict the semantic
units to consist of cells in the same row (dv = 0) or in the same column (dh = 0). Distance constraints greater one would allow gaps. E.g. a distance vector (dv , dh , dm ) = (2, 3, 4) would allow cells in a semantic unit to be separated by at most one empty column or by a column containing labels. Further, blocks might be separated by two lines. However, blocks must not be broken by both, a foreign (say empty) column and two foreign rows. ~ In the rest of this chapter, (dh , dv , dm ) will be referred to as the distance vector d. The second constraint is in essence a generalization of the concept of logical areas. It focusses strictly on equivalences between formulas. To communicate the idea, it is easiest to assume the spatial extent of a semantic unit already given and to require copy equivalence between different units of the same class. Constructively, this would be achieved by copying the unit to another location on the sheet. Apparently, there is no equivalence or other condition assumed to hold between cells within a given semantic unit. The explanation given in the previous paragraph is too simple minded in so far, as weaker (and in fact different) equivalence criteria can be defined for the cells to hold between units. Further, the spatial extent of the unit cannot be presupposed right from the beginning. A formal definition of semantic units is given in [6] and [2]. An algorithm for constructing them and a discussion about the additional parameter, determining whether size or homogeneity of the unit is to be stressed, is given in [2].
3
Auditing Strategies
The broad variation of domains using spreadsheets (see [1, 4, 5]) suggests that most likely, one needs different strategies to assess their quality or to comprehend their full content. Hence, three different auditing strategies for spreadsheets will be introduced. They are based on the semantic classes defined in the previous section. Each of the auditing strategies will be explained using an example which was introduced by Panko [10] and that is commonly used for the evaluation of new spreadsheet auditing approaches. The example spreadsheet (see Figure 3 on page 8 and Figure 4 on page 9- the shading of the areas is not part of the spreadsheet program) is meant to be used by students to perform some annual cost-accounting. It consists of 108 non-empty cells, including 57 cells with formulas. However, the spreadsheet contains a couple of seeded errors. Thus, the efficiency in auditing this spreadsheet is an acknowledged benchmark for the efficiency of a spreadsheet auditing approach. Although the spreadsheet program looks correct at first sight, the following errors are hidden: E19: + should be D20: 20 should be B20. F5: Cells in sum-formula should be F14 − F20 B17: should be 12 ∗ 30 F8: should reference F5 instead of E5. There are further omission errors, e.g. parental gifts and parking expenses, both being relevant factors for a students budget, that are not taken into account. However, these errors are not obvious on the value level and a written specification of the spreadsheet’s task has to be known in order to find them.
3.1
Pattern Driven Auditing
Pattern driven auditing is a helpful aid for understanding spreadsheet programs intuitively. It will support the spreadsheet auditor in finding errors due to irregularities in the pattern resulting form the aggregation of cells into logical areas and semantic units. Using a pattern driven auditing approach with semantic classes will involve the following steps: – Identify semantic units and semantic classes. – Interactively map semantic classes and semantic units back to the spreadsheet’s user interface by coloring cells in the same semantic unit with the same color. – Find geometrical patterns for the occurrences of the member units of a given semantic class. – Irregularities in the geometrical patterns are indicators for hot-spots. With this strategy, the auditor is not looking for regular patterns in the distribution of single cells, but in the distribution of the building blocks of the spreadsheet. The pattern thus generated might be a regular occurrence of a semantic unit that is a whole row or a large part of a column. Thus, a single erroneous cell will hinder the membership of the corresponding building block in a semantic class and will lead to a severe irregularity in the geometrical pattern, that is easy to spot. It has to be stressed though, that the approach just identify hot spots. Whether this hot spot is actually an error or whether it is an intended irregularity has to be decided by the author. Quite often, those hot spots are intentionally introduced during maintenance patches. However, in future runs of the same spreadsheet program instantiated with different input, they might turn into true faults. 4 Additionally, the pattern driven auditing strategy will also support the comprehension of a spreadsheet program, as building blocks with equal functionality are highlighted. In the following example, the pattern of semantic units in a part of a spreadsheet is discussed. Example 1: Pattern of Semantic Units In Figure 4 on page 9 the example spreadsheet appropriately colorized is shown. Although the three columns obviously fulfill the same task, i.e. calculating the budget for a semester, the discovered semantic units are not in equal semantic classes. For column D, this behaviour can be lead back to some special initialization values, but for the columns E and F it has to be examined, why the discovered semantic units of the spreadsheet are not in the same semantic class. This irregularity is due to the errors in F5 and F8 and due to errors in D20 and E19. ♦ However, at this time there is an additional dimension the spreadsheet auditor has to consider: It is not only the pattern of occurrence of semantic units in a semantic class, but also the extent of each of the semantic units. If there are near semantic units in distinct semantic classes , that the auditor considers related, it has to be checked, why no merging has happened. Usually, this is the case because the pattern of co-occurrence is distorted, or the parameters for the merging algorithm have not been carefully chosen. 4
A standard example of such dormant faults is to replace a formula with the constant value this formula is to compute in the given spreadsheet instance. In the sheet fed with new inputs, the constant remains unchanged.
3.2
SRG Driven Auditing Strategy
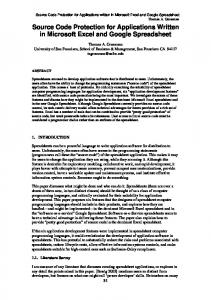
The SRG driven auditing strategy banks on an abstraction of the DDG 5 . It can be performed on the level of logical areas as well as on the level of semantic classes. Nodes in the SRG represent a set of cells. In the auditing effort reported in [3], nodes were logical areas. In the current discussions, we represent each semantic class by a node. An edge between two nodes n1 and n2 is drawn, if a cell in the aggregate represented by n1 references a cell in the aggregate represented by n2 . Although SRG-based auditing seems at first glance to be independent of what is represented in a node, there is a fundamental difference. In a semantic-class-SRG the nodes represent units that are supposed to fulfill a given self contained task, whereas with logical areas the nodes in the generated SRG represent sets of cells with equivalent formulas. Thus, at this time the data-flow between different tasks are observable, not dependencies on the formula level. Thus, the focus is not on regularity but rather on modularization. Again, the number of nodes and edges in the SRG is expected to be significantly smaller than in the DDG. In the example spreadsheet introduced above, the SRG consists of 10 nodes and 20 edges (see Figure 1 on the next page), whereas the DDG consists of some 57 nodes and 91 and edges. Although the SRG looks complicated at first sight, the auditor has to deal with a graph representation with a significantly reduced number of nodes and edges. The visualization can be further enhanced by zooming into certain semantic classes, i.e. replacing the node of the semantic class in the SRG with a node for each semantic unit in the semantic class. This visualization technique, also known as fisheye-view, has already been used by approaches for the visualization and comprehension of conventional software systems., e.g. in the RIGI- Project (see Mueller et al. [7, 8]). Applying fisheye-views in SRG-driven auditing for spreadsheet programs has the advantage that the spreadsheet auditor can choose an individual level of abstraction for each part of the spreadsheet program. Thus, the three levels of abstraction 1. Semantic Class 2. Semantic Unit 3. Cell can be individually assigned and chosen according to focus of interest. E.g., the spreadsheet auditor can choose to replace a certain semantic class sc1 in the SRG with the units su1 , · · · , sun that form the class. Now, the auditor can decide again, to replace sui , with 1 < i < n in the SRG with the cells c1 , · · · cm that form su1 . Thus, the DDG of a given semantic unit can be examined in the context of the SRG. 3.3
Structure Driven Auditing Strategy
The strictness of the similarity criteria for semantic units can be defined on two levels (EqStart and EqRest ). Therefore, structure driven auditing is for semantic classes more complicated than for logical areas. Hence, the structure browser for semantic classes (see Figure 2) cannot grasp the hierarchy of different combinations of EqStart and EqRest any more (see Figure 1). 5
Data dependency graph
EqStart
EqRest
le
se
ce
le
le
ce
le
le
le
se
(a) SRG
ce
ce
ce
se
ce
se
se
se
(b) Hierarchy of strictness
Fig. 1: Figure (a) shows the SRG for the example spreadsheet. The numbers the node represent semantic classes. The class assignment of specific semantic units and cells is shown in Figure 2. Parameters for the recovery of semantic units were d~ = (0, 1, 1), b = 70%, Eqstart = se, Eqrest = se. Figure (b) shows a hierarchy of strictness for similarity criteria EqStart and EqRest for semantic units. The gray-shaded combinations have EqStart stricter than EqRest , according to the hierarchy of logical equivalence criteria.
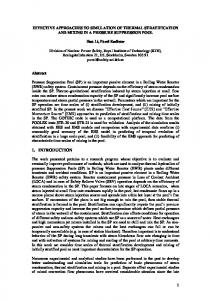
Fig. 2: Semantic classes and semantic units of the example spreadsheet in the structure browser.The merging algorithm was invoked with d~ = (0, 1, 1), b = 70%, Eqstart = se, Eqrest = se.
Fig. 3: Visualization of semantic classes with EqStart,Rest = se, d~ = (0, 1, 1). Semantic units are framed with a thick border. Semantic units in the same class are shaded in the same gray-scale. Semantic units with singleton generators are not shaded at all. Not framed cells are in semantic units consisting of single cells. However, the spreadsheet auditor can still calculate a partitioning of the spreadsheet program into semantic classes with a stricter and a weaker combination of EqStart , EqRest and b and compare the outcome, by coloring the result of each partitioning on the spreadsheet program, as it is shown in the following example: Example 2: Structure driven auditing with Semantic Classes In Figure 3, the partitioning of the example spreadsheet into semantic classes and semantic units with EqStart = se and EqRest = se (structural equivalent) is shown, where EqStart = ce and EqRest = ce (copy equivalent) in Figure 4 on the next page. Comparing the colored spreadsheets, the following inconsistencies can be detected: – Obviously, column D is distinct from E and F . Having a look at the logic (and the formulas) of the spreadsheet, this can be explained by the fact that in D some initialization is performed. – In the columns E and F the upper parts are structural equivalent, the middle part consists of cells that are mutually copy-equivalent, and thus not merged into a semantic unit. The following questions have to be answered: • Why is there no such similarity relation between the bottom of the two columns? • Why is the middle part copy-equivalent, whereas the upper part consists of two semantic units that have the same extent, but are only structural equivalent? Indeed, examining the spreadsheet in order to answer these questions will reveal 4 of the 5 errors that are hidden in the spreadsheet. ♦
Fig. 4: Visualization of semantic classes with EqStart,Rest = ce, d~ = (0, 1, 1). Formula view.
4
Discussion
Semantic classes introduce a higher level of abstraction to the spreadsheet auditing process. This can enhance the understanding of complex spreadsheet programs, or enable the auditor to spot irregularities without going too deep into detail. However, the irregularities found do only indicate hot-spots that need further investigation. Some of the identified problems might turn out to be deliberately introduced. Besides for spreadsheet auditing, semantic classes are also a powerful tool for the maintenance of spreadsheet programs. Spreadsheet programmers can be supervised and warned, whenever a change to the spreadsheet program will change the structure of semantic classes and units, i.e. when the structure of the semantic building blocks of the spreadsheet program is endangered to become blurred. The concept can also be used as protective device against inadvertent omissions in the spreadsheet evolution process. Assuming, that somebody had for whatever reason, good or bad, introduced a change to the sheet that leads to the break-up of a semantic unit. In this case, the number of semantic classes will rise. If the number of semantic classes the sheet is assumed to contain is kept somewhere, this change will be highlighted. Changes of the sheet that remain within the given conceptual model, even if they introduce a host of newly defined cells, will not change this number. However, although this technique promises to increase spreadsheet comprehension, it is not applicable without special training any more. The spreadsheet auditor has to be aware of the impact of the decision for a certain distance vector and of the influence of the boundary parameter on the result. Nevertheless, no special IT-Terminology is necessary in order to train people, only a thorough explanation of the geometrical terms is necessary. Additionally, the result of the partitioning is well suited to be discussed with untrained domain-experts, as it should correspond to their model of the spreadsheet program. Thus, this auditing technique violates the requirement for no special vocabulary for spreadsheet auditing technologies that has been stated by Reichwein et al. [12]. However, it is argued that the end user can take advantage of logical areas, with a concept that
is easy to communicate and easy-to-use auditing strategies. For a more sophisticated spreadsheet user, who creates and audits large spreadsheet programs, the support that is gained by the usage of semantic classes might be a motivation to have a look at the necessary extra vocabulary, that is still non-IT vocabulary. However, the other criteria claimed namely seamless integration into the spreadsheet system and minimal overhead, have been met by a prototype that implements the analysis technique suggested. As semantic classes build upon the concept of logical areas, they inherit the characteristic, that they are well suited for large, but regular spreadsheets, or for the regular parts of a given spreadsheet program. They are not designed for spreadsheets with a rather irregular pattern in their formula structure.
5
Conclusion
The paper shows how semantic units can be used to identify irregularities in very large spreadsheets. While such irregularities might have been introduced on purpose, they constitute a dormant threat further spreadsheet evolution. By identifying semantically coherent cells and grouping them into logical areas and by extending this concept further to identify groups of cells that show a coherent recurring pattern as group, the effort needed for auditing spreadsheets can be reduced drastically. In order to impact the field of end-user programming, the approach aims to hide the theoretical complexity needed in the construction of semantic units from its users.
Bibliography 1. Rommert Casimir. Real programmers don’t use spreadsheets. ACM SIGPLAN Notices, 27(6):10–16, June 1992. 2. Markus Clermont. A Scalable Approach to Spreadsheet Visualization. PhD thesis, Universit¨at Klagenfurt, Universit¨atsstrasse 65–67, A-9020 Klagenfurt, Austria, March 2003. 3. Markus Clermont, Christian Hanin, and Roland Mittermeir. A Spreadsheet Auditing Tool Evaluated in an Industrial Context . In Spreadsheet Risks, Audit and Development Methods, volume 3, pages 35–46. EUSPRIG, 7 2002. 4. Gordon Filby, editor. Spreadsheets in Science and Engineering. Springer, Berlin, Heidelberg, 1998. 5. Peter Kokol. Some Applications of Spreadsheet Programs in Software Engineering. Software Engineering Notes, 12(3):45–50, July 1987. 6. Roland Mittermeir and Markus Clermont. Finding High-Level Structures in Spreadsheets. In Proceedings of the 9th Working Conference on Reverse Engineering, 2002. 7. Hausi M¨ uller, Mehmet Orgun, Scott Tilley, and James Uhl. A Reverse Engineering Approach To Subsystem Structure Identification. Software Maintenance: Research and Practice, 5(4):181–204, December 1993. 8. Hausi M¨ uller, Kenny Wong, and Scott Tilley. Understanding Software Systems Using Reverse Engineering Technology. In Colloquium on Object Orientation in Databases and Software Engineering, volume 62. Association Canadienne Francaise pour l’Avancement des Sciences (ACFAS), 1994. 9. Bonnie Nardi and James Miller. An Ethnographic Study of Distributed Problem Solving in Spreadsheet Development . In Proceedings of the conference on Computer-supported cooperative work , pages 197–208. ACM, October 1990.
10. Raymond R. Panko. Applying code inspection to spreadsheet testing. Working Paper, November 1997. 11. Raymond R. Panko. What we know about spreadsheet errors. Journal of End User Computing: Special issue on Scaling Up End User Development, 10(2):15–21, Spring 1998. 12. James Reichwein, Gregg Rothermel, and Margret Burnett. Slicing spreadsheets: An integrated methodology for spreadsheet testing and debugging. In Proceedings of the 2nd Conference on domain-specific languages, volume 2, pages 25–38. ACM, 2000. 13. Jorma Sajaniemi. Modeling spreadsheet audit: A rigorous approach to automatic visualization. Journal of Visual Languages and Computing, 11(1):49–82, 2000.