Auditory Processing under Cross-Modal Visual Load Investigated with Simultaneous EEG-fMRI Christina Regenbogen1,2*, Maarten De Vos3,4, Stefan Debener3,5, Bruce I. Turetsky6, Carolin Mo¨ßnang1,2, Andreas Finkelmeyer1,7, Ute Habel1,2, Irene Neuner1,2., Thilo Kellermann1,2. 1 Department of Psychiatry, Psychotherapy, and Psychosomatics, Medical School, RWTH Aachen University, Aachen, Germany, 2 JARA Translational Brain Medicine, University of Oldenburg, Oldenburg, Germany, 3 Neuropsychology Laboratory, Department of Psychology, University of Oldenburg, Oldenburg, Germany, 4 Department of Electrical Engineering, ESAT-SCD, KU Leuven, Leuven, Belgium, 5 Department of Neurology, Biomagnetic Center, University Hospital Jena, Jena, Germany, 6 Department of Psychiatry, University of Pennsylvania, School of Medicine, Philadelphia, Pennsylvania, United States of America, 7 Institute of Neuroscience, Newcastle University, England, United Kingdom
Abstract Cognitive task demands in one sensory modality (T1) can have beneficial effects on a secondary task (T2) in a different modality, due to reduced top-down control needed to inhibit the secondary task, as well as crossmodal spread of attention. This contrasts findings of cognitive load compromising a secondary modality’s processing. We manipulated cognitive load within one modality (visual) and studied the consequences of cognitive demands on secondary (auditory) processing. 15 healthy participants underwent a simultaneous EEG-fMRI experiment. Data from 8 participants were obtained outside the scanner for validation purposes. The primary task (T1) was to respond to a visual working memory (WM) task with four conditions, while the secondary task (T2) consisted of an auditory oddball stream, which participants were asked to ignore. The fMRI results revealed fronto-parietal WM network activations in response to T1 task manipulation. This was accompanied by significantly higher reaction times and lower hit rates with increasing task difficulty which confirmed successful manipulation of WM load. Amplitudes of auditory evoked potentials, representing fundamental auditory processing showed a continuous augmentation which demonstrated a systematic relation to cross-modal cognitive load. With increasing WM load, primary auditory cortices were increasingly deactivated while psychophysiological interaction results suggested the emergence of auditory cortices connectivity with visual WM regions. These results suggest differential effects of crossmodal attention on fundamental auditory processing. We suggest a continuous allocation of resources to brain regions processing primary tasks when challenging the central executive under high cognitive load. Citation: Regenbogen C, De Vos M, Debener S, Turetsky BI, Mo¨ßnang C, et al. (2012) Auditory Processing under Cross-Modal Visual Load Investigated with Simultaneous EEG-fMRI. PLoS ONE 7(12): e52267. doi:10.1371/journal.pone.0052267 Editor: Francesco Di Russo, University of Rome, Italy Received October 9, 2012; Accepted November 12, 2012; Published December 14, 2012 Copyright: ß 2012 Regenbogen et al. This is an open-access article distributed under the terms of the Creative Commons Attribution License, which permits unrestricted use, distribution, and reproduction in any medium, provided the original author and source are credited. Funding: This work was supported by the Deutsche Forschungsgemeinschaft (DFG: IRTG1328, KFO-112/TP9: Ha3202/2-2), the Interdisciplinary Center for Clinical Research of the Medical Faculty of the RWTH Aachen University (N2-6, N4-4), the Research Council KUL (GOA MaNet), and the Flemish Government (FWO G.0427.10N, Integrated EEG-fMRI).CR is supported by a start-up grant of the IRTG1328 (DFG). MDV is supported by an Alexander von Humboldt stipend. The funders had no role in study design, data collection and analysis, decision to publish, or preparation of the manuscript. Competing Interests: The authors have declared that no competing interests exist. * E-mail:
[email protected]. . These authors contributed equally to this work.
able and distractable components of crossmodal attention (e.g. reduced distraction effect but intact automatic change-detection mechanisms, [11]). Recently, Haroush and colleagues [12] have reported evidence for yet another alternative. In a perceptually demanding visual attentional blink paradigm healthy young participants showed cross-modal augmentation processing of unattended sounds. This was interpreted as a consequence of executive control due to cognitive overload resulting from the attended task. The decrease in executive control challenged the otherwise effective suppression of irrelevant input [13]. In contrast to the gain-load theory, the effects expected here on secondary task processing are beneficial rather than detrimental. Another alternative explanation for advantageous crossmodal effects may include generalized attention, a concept attributed to a spread of cognitive alertness [14,15]. This may be caused by the challenging task in the primary modality, which supports the
Introduction The brain’s capacity to re-allocate resources and to deal with its attentional capacities is relevant for survival and serves adaptive functioning [1,2]. How limited processing resources are managed between sensory modalities which are implicated simultaneously via two or more different tasks is however not fully understood. Cross-modal processing has been subject to several experimental investigations [3,4,5]. The results can be subsumed under different theoretical frameworks: The ‘automaticity theory’ [6] states automatic processing to be present in the unattended secondary task and immunity to cross-modal influences [7,8]. Several studies have found evidence for an absence of crossmodal effects on secondary task processing [9]. In contrast, the ‘gain-load theory’ [1] suggests that the primarily engaged modality uses the limited capacities which causes inhibition and thereby decreased processing of secondary input. This was also supported by others [10] and moderated by the assumption of differential effects on undistractPLOS ONE | www.plosone.org
1
December 2012 | Volume 7 | Issue 12 | e52267
Crossmodal Effects of WM on Auditory Processing
notion of attention being a general, modality-independent cognitive resource serving beneficial purposes for other modalities. One family of crossmodal effects are primary visual load effects on secondary auditor processing. Most studies focused on the auditory change effects [16]. Results show inconsistencies regarding the directionality of crossmodal effects. Some report decreased MMN amplitudes in the secondary task [1,10], others find the opposite [17,18] and there also exist null-findings on potential crossmodal influences [7,8,9]). While the MMN reflects active sensory memory processing [19], the N1 as its prerequisite contributes to encoding the sensory memory trace. It acts out stimulus perception as well as feature-detection mechanisms and represents fundamental auditory processing [20]. However, it was usually not distinguished whether standard or deviant processing was affected and which of the two was responsible for the decrease in auditory change detection [12]. It remained open whether the observable effects would already be present during basic tone processing. SanMiguel and colleagues [11] made an exception to this reporting an effect of visual working memory (WM) on the auditory N1. However, memory load was manipulated only on one level and the directionality of this effect (decreasing/ increasing) could not be determined. Haroush and colleagues [12] also reported auditory evoked responses (AEPs), however, they also focused on the MMN and the significance of the effect specifically of N1 or P2 amplitudes could not be evaluated. The aim of the present study was to investigate how stepwise increases in a four-level visual WM design would influence basic auditory processing. Rather than audiotry change effects we wanted to specifically analyze standard tones, representing sensory encoding for the memory trace which is the prerequisite for further higher-level processes such as the auditory change effect. We used FMRI in order to assess WM manipulation and concurrently recorded event-related potentials (ERP) to measure auditory processing. Although a simultaneous recording of both modalities is not strictly required, it has several advantages: It enables disentangling modality-specific effects but guarantees inferring direct relations due to the measurement simultaneity and the time-point stable task manipulation of both modalities. Often-replicated fronto-parietal network activations are wellestablished fMRI correlates of visual WM [21,22,23]. Electrophysiological tone responses are characterized by the auditory N1P2 vertex potential. These ERP components can also be reliably obtained when recorded in the MR scanner and the potential coupling between both measures is a matter of ongoing research [24]. Our hypotheses were based on a successful manipulation of visual WM load, which would result in uni-modally enhanced fMRI activation patterns in WM-related areas. Cross-modal effects in fundamental auditory processing were investigated via AEPs simultaneously measured, as well as measured outside the scanner in a different sample. Our simultaneous measurement setup would further help us to provide a more refined answer to how the spatial and temporal correlates of potential crossmodal load effects would manifest themselves by reciprocally informing one measurement modality by the results of the other [25,26,27].
Subjects The group of participants consisted of 15 healthy adults (7 females, M age = 25.60 yrs., SD = 2.87) for simultaneous EEGfMRI (inside) measurements and 8 healthy adults (5 females, M age = 24.25 yrs., SD = 3.20) for EEG-only (outside) measurements (5 subjects were measured inside and outside, with 12 months in between measurements,). Participants were recruited through local advertisements, followed by a detailed screening which confirmed a negative history of psychiatric disorder, neurological illness or current substance abuse. All participants were right-handed [28], had normal or corrected-to-normal vision and fulfilled MR scanning inclusion criteria. Two participants were excluded from the EEG analysis and subsequent integration of fMRI and EEG due to low EEG signal quality. This reduced the final sample for EEG and EEG-informed analyses to 13 participants.
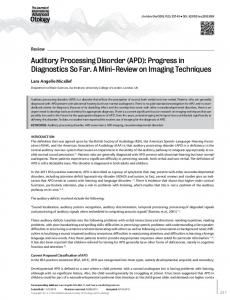
Stimuli and Task The experiment (Figure 1) consisted of an attended visual nback task (T1) with four conditions for parametric modulation of WM load. The baseline condition (‘fixation’) included watching a presented series of letters, the ‘0-back’ condition required subjects to respond via a button-press to the target letter ‘X’, in ‘1-back’, they had to respond to two consecutive identical letters, and in ‘2back’, they had to respond to letters identical to the one presented two trials before. Letters in 1-back and 2-back could be any of the alphabet, except ’X’. Each of the 3 condition-blocks (0-back, 1back, 2-back) appeared five times, interspersed with 15 baseline blocks. Stimuli were presented for 500 ms every 1.4 s for block duration of 27 s in the n-back conditions and 15 s in the baseline. Every block was initiated by a 3 s task instruction. A fixed order was repeated five times. The unattended task (T2) consisted of frequent standard tones (1000 Hz, ,60 dB) and infrequent deviant tones (1300 Hz, ,60 dB), continuously presented every 1.4 s with a standard oddball ratio of 9:1. This resulted in approximately 14–16 standards and 1–2 deviants per experimental block (9–11 standards and 1 deviant during fixation) and a total of 360 standards and 45 deviants. Tones and visual stimuli were timelocked to each other: tones were presented first and always followed after 500 ms by visual stimuli. The presentation of the tones was not directly triggered to the MR pulse to prevent from time-locking of the MR artifact signal and the EEG signal. The very first three standards and off-timed tones (exceeding 630 ms deviance from inter-stimulus-interval) were excluded from further analysis. This was the same for standards following deviants and first standards of each block.
Procedure Participants were prepared for the simultaneous measurement and comfortably placed in the MR scanner with the right hand’s index finger placed on a response button (LUMItouchTM, Lightwave Technologies, Richmond, Canada). The experimental stimuli were presented using PresentationH (Neurobehavioral Systems Inc., San Francisco, CA). Tones were presented at ,60 dB via MR-compatible heaphones (Behringer H). In order to guarantee that EEG quality of auditory evoked potential was reliable inside the scanner, eight control participants were prepared for an EEG-only measurement and measured in a dimly-lit room, in a supine position, wearing goggles and headphone to ensure comparability of experimental influence. Subjects were instructed to engage in the visual n-back task and to ignore all tones.
Methods Ethics Statement The experimental set-up conformed to the Code of Ethics of the World Medical Association and the study was approved by the ethics board of the medical faculty, RWTH Aachen University. Participants gave written informed consent on the study protocol.
PLOS ONE | www.plosone.org
2
December 2012 | Volume 7 | Issue 12 | e52267
Crossmodal Effects of WM on Auditory Processing
Figure 1. While presenting participants with an attended visual n-back task we investigated cross-modal effects of ignored auditory events consisting of frequent standard tones of 1000 Hz and infrequent deviant tones of 1300 Hz on brain responses (ISI = 1.4 s). The experiment consisted of 5 blocks per condition (27 s) and 15 fixation (baseline) blocks (15 s). doi:10.1371/journal.pone.0052267.g001
further used for the group-level analysis. A first step was to validate visual WM load by analyzing fMRI activations corresponding to the visual letter presentation. A mixed-effects GLM was used for group-level inference with subjects as random effects and WM conditions as fixed effects. Departures from sphericity were corrected for by variance components assuming a compound symmetry structure for within-subjects (correlated) measures and heteroscedasticity between subjects and conditions. In order to reveal neural activation corresponding to visual WM load, we carried out an F-test, testing for general difference between the four conditions. The statistical parametric map was thresholded at p,.05, corrected for multiple comparisons at the voxel-level using Gaussian random field theory (family-wise-error, FWE) and a cluster-extent threshold of 20 voxels. A T-contrast was carried out, testing for a parametric increase of WM-load (conjunction analysis 2-back.1-back > 1-back.0-back > 0back.fixation). This contrast was thresholded with a combined height and extent threshold technique based on Monte-Carlo (MC) simulations calculated with AlphaSim [32]. Based on an uncorrected threshold of p,.001 and the spatial properties of the residual image an extent threshold of 125 voxels was estimated using 100000 and complied with a family wise error of p,.05. Activation maxima are reported as MNI-coordinates and anatomical locations are based on the Talairach Client (Lancaster & Fox, Research Imaging Center, University of Texas Health Science Center San Antonio) and the Anatomy Toolbox [33].
Data Acquisition and Analysis In order to investigate cross-modal effects caused by increasing visual WM load on basic auditory processing, we followed a reciprocal analysis strategy of informing the EEG analysis by effects found in the fMRI and vice versa.
Behavior Behavioral responses (hit rates and reaction times) were analyzed one-way repeated measures ANOVAs in IBMH SPSSH (version 20). These models included the within-subjects factor ‘nback’ with three levels (leaving out fixation). Post-hoc tests were performed using paired t-tests and Bonferroni correction.
FMRI Preprocessing and Whole Brain Analysis fMRI data were obtained on a 3 Tesla Tim TrioH MR scanner (Siemens Medical Systems, Erlangen, Germany) during one run with an echo-planar imaging (EPI) T2* contrast sequence sensitive to blood oxygenation level dependent (BOLD) changes (3.12563.12563.4 mm3 voxel size, 64664 matrix, 2006200 mm2 FOV, 33 3.4 mm-thick axial (AC-PC) slices with whole brain coverage (0.51 mm gap), ascending acquisition, TR/ TE = 2000/30 ms, 76u flip angle [29], 360 volumes). Data analysis was performed using SPM8 (Wellcome Department of Cognitive Neurology, London, UK). Preprocessing of data included realignment of data to correct for head movement, coregistration of the mean EPI scan onto the SPM8 grey matter tissue probability map, and normalization using the unified segmentation approach [30]. Images were resampled to a voxel size of 1.561.561.5 mm3 and smoothed with an isotropic 8 mm FWHM (full width at half maximum) Gaussian kernel. On a single-subject level, four regressors (one for each WM condition) were created by convolving the respective box-car function with the canonical double-gamma hemodynamic response function (HRF) [31]. Realignment parameters were included as covariates of no interest and the session mean was regressed on a constant term. Prior to parameter estimation, a 128 s high-pass filter was applied. Serial auto-correlations were accounted for by including a first order autoregressive model (AR1). Simple main contrasts (fixation, 0-back, 1-back, 2-back) were PLOS ONE | www.plosone.org
EEG Preprocessing and ERP Analysis We used a 64-channel MR-compatible EEG system (two BrainAmp MR plus 32-channel amplifiers, BrainProducts GmbH, Gilching, Germany), connected to a MR-compatible electrode cap (Easycap GmbH, Herrsching-Breitbrunn, Germany) with 64 Ag– AgCl electrodes (5 kV resistors), 63 of which covered the 10–20 system and one electrocardiogram (ECG) electrode placed ,10 cm below the left scapula. Electrodes at positions FCz and AFz served as the recording reference and ground electrode, respectively. The online sampling rate was set to 5000 Hz (0.01– 250 Hz analog band-pass filter), and electrode impedances were below 20 kV. To improve EEG artifact attenuation a sync box 3
December 2012 | Volume 7 | Issue 12 | e52267
Crossmodal Effects of WM on Auditory Processing
covariate interacting with the task effect (differences between WMload conditions). Both contrasts were masked with the effects of interest of the F-contrast testing for unsigned differences between visual WM-conditions of the four BOLD regressors (inclusive mask, thresholded at p,.05 uncorrected) and thresholded at p,.001 (MC-cluster-corrected, p,.05).
(BrainProducts GmbH, Gilching, Germany) was used for optimal synchronization of EEG acquisition with the clock controlling MRI slice acquisition. At the start of each volume acquisition, an event marker was sent to the recording device (Brain Vision Recorder 1.0, BrainProducts GmbH, Gilching, Germany) to enable identification of gradient onsets and to create a template for artifact subtraction. Offline analysis of EEG data was accomplished using Brain Vision Analyzer software, version 2.0 (BVA 2.0, Brainproducts, Gilching, Germany) and EEGLAB, version 8.0.3.5b [34]. Continuous EEG data underwent gradient artifact removal using the template matching algorithm in BVA [35]. After gradient artifact removal, the data were low-pass-filtered with a digital infinite impulse response filter (IIR, 70 Hz, 48 dB slope) and downsampled to 500 Hz. Cardiac pulse correction was carried out based on an automatically detected pulse template in the ECG channel. Markers were set at highly correlated (.0.7) and abovethreshold amplitude (0.4–1.4) time-points. Cardiac pulse markers were visually confirmed and the data subsequently exported to EEGLAB in order to apply a channel-wise optimal basis set procedure [36,37] as implemented in the EEGLAB-plugin FMRIB 1.2. Data was then re-referenced to linked mastoids (mean TP9-TP10). Independent component analysis (ICA, extended infomax) [38,39] revealed components relating to eye movement which were removed from the data (maximally two components were removed). Data were filtered (1–30 Hz) and epochs exceeding 125 mV were rejected from further analysis. Fundamental auditory processing was assessed by analyzing saturated standard tones (Figure 1) which were conceptualized as any tone not appearing as first tones of a block or following a deviant, leaving 372 trials total. Since blocks were uniformly distributed across the experiment a direct comparison of conditions did not include general adaptation effects across time. Cross-modal effects on event-related auditory potentials (AEPs) were assessed by extracting auditory events in different WM conditions and analyzing condition-specific peak amplitudes and latencies. AEP epochs included 700 ms around the tones (2100 to 600 ms post-stimulus onset, baseline-corrected) and were averaged within each of the four visual WM load condition. Based on other work [1,8,9] we extracted peak amplitudes from electrode position Fz. The absolute N1-P2 peak-to-peak values were extracted using an N1 search window between 80–140 ms and a P2 search window between 170–210 ms for each of the four conditions. This yielded four values per subject (fixation, 0-back, 1back, 2-back). N1-P2 amplitudes and the latencies of N1 and P2 peaks were statistically analyzed within generalized linear estimating equations (GEE) in IBMH SPSSH (version 20). The statistical models included main effect of the factors ’n-back’ (four levels). Post-hoc tests were performed using paired t-tests and Bonferroni correction.
Region-of-interest Analysis in the Auditory Cortex Cross-modal effects caused by visual working memory load on basic auditory processing motivated a subsequent individual region-of-interest analysis in primary auditory cortex (AC). Since auditory processing of the tones was not experimentally manipulated (only visual working memory load was), we would have expected null findings in both auditory cortices. However, primary and non-primary AC are the primary generator regions of AEPs [42,43,44]. Therefore it was investigated whether the BOLD signal measured in AC complemented the effects of cross-modal manipulation of AEP amplitudes. For this region-of interest analysis, anatomical masks of left and right Heschl’s gyrus were created using the AAL database [45] in WFU Pickatlas [46,47]. Using MarsBaR [48], the same single subject analysis was performed as described above for the whole brain analysis (four regressors modeling the BOLD response of each WM load condition) separately for each AC. The conditionwise averaged time-series of AC activation were analyzed in IBMH SPSSH (version 20) using generalized linear models with the within-subject factor condition (four levels).
Psychophysiological Interaction (PPI) While the region-of-interest analysis would allow specific insight into the effect of experimental conditions in a specific region it was also of interest how functional connectivity patterns of this region and others would emerge in different WM conditions. In the subsequent PPI analysis we therefore extracted the individual time-series of left and right primary AC (same masks as used for the ROI analysis). After deconvolution, data vectors were multiplied with the respective box-car functions representing one WM condition each and reconvolved with the canonical HRF [49]. On a single subject level, the data vector (representing one of four conditions) was implemented as a PPI regressor. The convolved main effect of each condition, the seed region’s timecourse, and six realignment parameters as well as an intercept were entered as covariates of no interest into the analysis. After model estimation, parameter estimates of the PPI regressors from each subject’s four first-level analyses were entered into a mixed-effects GLM for group-level inference with subjects as random effects and four PPI regressors as fixed effects. As in the BOLD-GLM described above, departures from sphericity were corrected for by variance components assuming a compound symmetry structure for within-subjects measures and heteroscedasticity between subjects and conditions. Simple main effects, representing task-related connectivity of AC with in each WMload condition were thresholded at p,0.05 (FWE-corrected), the conjunction analysis testing for effects correlating with parametrically increasing visual WM load was thresholded at p,.05 (MCcluster-corrected).
EEG-informed fMRI Covariate Analysis (ANCOVA) We carried out three ANCOVA models, each testing for the effect of the mean N1, P2, and N1-P2 amplitude of standards, respectively on a group level. Values (four per subject) were entered into the statistical design as a covariate explaining interindividual BOLD variance after mean-centering. This approach assumes a correspondence of event-related potentials to neural activity measured via changes in BOLD [24,40,41]. While allowing for an interaction between the covariate and the main task, we were interested in two contrasts: A T-contrast testing for the average effect of the covariate regressors which would represent a general effect of the auditory response on brain activation, as well as an F-contrast testing for the effect of the PLOS ONE | www.plosone.org
Results Neural Activation Patterns of Visual WM Load The main effect of the WM task (F-contrast testing for differences between all conditions, Table 1A, Figure 2) revealed activations in bilateral inferior frontal and prefrontal cortex, supplementary motor area (SMA) and ventromedial prefrontal 4
December 2012 | Volume 7 | Issue 12 | e52267
Crossmodal Effects of WM on Auditory Processing
Figure 2. A) Behavioral results of WM-load manipulation on subjects’ hit rates (correct %) and reaction times (both M±SEM). In EEGfMRI subjects (n = 15) GLMs confirmed a significant increase in RTs and decrease in hit rates when WM-load increased. This was replicated in EEGonly subjects (n = 5), but only significant for hit rates. B: Neural activation of visual WM-load, displayed by a contrasts from a random-effects GLM testing for general unsigned differences between visual WM load conditions (F-contrast, F.14.46, p,.05, FWE-corrected, k.20). Within the left dorsolateral prefrontal cortex (DLPFC) and the left inferior parietal cortex (IPC), cluster mean voxel activation (6SEM) were displayed via bar charts. MNI coordinates indicate the location of the maximum within the respective cluster. doi:10.1371/journal.pone.0052267.g002
cortex (vmPFC), middle cingulate gyrus, and precuneus, as well as activations in parietal areas (intraparietal sulcus, inferior parietal lobe and angular gyrus) extending to temporal areas, and several cerebellar clusters. The parametric effect of WM load (T-contrast conjunction 2back.1-back > 1-back.0-back > 0-back.fixation, Table 1B) showed activation in Area 6 (precentral gyrus) and supplementary premotor area (SMA).
PLOS ONE | www.plosone.org
Behavioral Effects of Visual WM Load The GLM analyzing participants’ hit rates and reaction times each showed a significant main-effect of ’n-back’ (hit rates: Wald x2(2) = 17.74, p,.001; RTs: Wald x2(2) = 35.47, p,.001). Post-hoc tests of hit rates showed a significant decrease from condition 0back to 2-back (t(14) = 3.92, p,.001) and from condition 1-back to 2-back (t(14) = 3.84, p = .013). Post-hoc tests of RTs showed a significant increase condition 0-back to conditions 1-back (t(14) = 24.11) and 2-back (t(14) = 24.10) (Table 2 and Figure 2). 5
December 2012 | Volume 7 | Issue 12 | e52267
Crossmodal Effects of WM on Auditory Processing
Table 1. Activation patterns corresponding to the effects of visual WM load.
Brain region
Hemisphere
Cluster size
T/F
p
x
y
z
L
2772
32.30
,.001
235
21
26
R
1132
29.21
,.001
30
23
0
Orbitofrontal gyrus
R
408
25.39
,.001
36
54
26
DLPFC
L
2977
8.47
,.001
248
26
29
L
46
2.34
.001
239
35
218
L
27
17.09
.008
226
17
221 12
A) Main effect (F-Test) Inferior frontal gyrus
R
20
18.15
.004
45
21
Middle frontal gyrus
L
143
16.58
.012
244
47
9
Superior frontal gyrus
L
29
16.91
.009
230
57
0 50
SMA
L
14751
8.44
,.001
25
5
vmPFC
L
5385
35.47
,.001
26
54
217
R
45
21.14
.001
9
50
26
L
1352
25.26
,.001
28
245
36
L
56
17.20
.008
25
227
45
Precuneus
R
108
18.57
.003
8
259
26
Inferior parietal gyrus
L
16781
68.32
,.001
242
241
45
Angular gyrus
L
118
17.06
.008
247
263
26
Insula
L
25
2.30
.001
247
0
14
R
166
25.00
,.001
39
215
17
R
56
18.80
.003
48
229
20
Inferior temporal gyrus
L
152
21.42
.001
254
263
215
Fusiform gyrus
L
25
16.95
.009
232
236
218
R
268
23.36
,.001
57
256
217
R
50
19.70
.001
42
262
215
Thalamus
R
617
22.46
,.001
12
26
22
Putamen
R
411
2.42
.001
21
11
2
Lobule VIIa crus I
L
2077
45.25
,.001
232
265
232
R
133
2.98
.001
36
278
239
Lobule VI
R
5229
44.42
,.001
35
251
232
Lobule VIIIa
R
116
25.36
,.001
39
244
254
Lobule VIIa crus II
R
172
19.55
.002
38
263
251
Substantia nigra
L
69
18.87
.003
28
220
212
Middle cingulate gyrus
B) Parametric effect (T-Test conjunction) Precentral gyrus
R
236
4.35
–
30
23
47
SMA
R
449
4.85
–
5
9
51
A) The F-contrast (F.14.46) resulted from a group-level GLM, testing for general differences between all visual WM conditions, p,.05, FWE-corrected, k.20). B) The Tcontrast conjunction (T.3.24) combined the effects of 2-back.1-back > 1-back.0-back > 0-back.fixation, p,.05, MC-corrected, k.125). P-values are only reported if surviving voxel-level FWE correction. DLPFC = dorsolateral prefrontal cortex, SMA = supplementary motor area, vmPFC = ventromedial PFC. doi:10.1371/journal.pone.0052267.t001
In control participants (EEG-only), hit rates also significantly increased (main effect of ‘n-back’, Wald x2(2) = 16.09, p,.001). Post-hoc tests showed a significant decrease in hit rates from condition 0-back to 2-back (t(4) = 3.50, p,.001) and from condition 1-back to 2-back (t(4) = 2.73, p = .006). Although on a descriptive level, the effects were comparable to those observed in inside data the main effect of ‘n-back’ on RTs was not significant (Wald x2(2) = 3.95, p,.139).
PLOS ONE | www.plosone.org
Cross-modal Effects of Visual WM-load on AEPs Generally, EEG data quality was similar after correction of MR- and CB-artifacts of EEG data measured inside the scanner, and signal-to-noise ratios (’noise’ being defined as the difference of an odd-even split) were not significantly different between EEGfMRI and EEG-only data (t(21) = 21.26, p = .13). This supports former reports of valid data recorded from simultaneous continuous measurements compared to interleaved gap measurements [50] or measurements inside the MR scanner without applying HF pulses [51].
6
December 2012 | Volume 7 | Issue 12 | e52267
Crossmodal Effects of WM on Auditory Processing
Table 2. Mean values of subjects’ behavioral performance (mean percent correct hit rates and reaction times in ms, SD in brackets) in three visual WM conditions.
Hit rates
Table 3. Auditory evoked potential (absolute N1-P2 amplitude, M mV, SD in brackets) in different cross-modal visual WM conditions in two different populations.
Reaction times
n-back condition
Standard tones N1-P2 amplitude (M mV, SD)
EEGfMRI data
WMcondition
EEGfMRI
EEG-only
EEGfMRI
EEG-only
Fixation
10.40 (5.23)
0-back
99.24 (1.70)
99.43 (1.28)
391.38 (33.25)
439.56 (41.82)
0-back
11.50 (4.27)
1-back
97.33 (3.96)
98.29 (2.55)
429.13 (58.33)
437.57 (77.43)
1-back
12.65 (5.24)
2-back
92.00 (7.26)
91.43 (2.71)
445.38 (42.48)
464.43 (25.06)
2-back
13.34 (4.79)
EEG-only data
‘EEGfMRI’ refers to the participants measured with simultaneous EEG-fMRI (n = 15), ‘outside’ refers to controls measured outside the scanner. Due to recording problems, behavioral data were unavailable for three outside participants which decreased the sample size to n = 5. doi:10.1371/journal.pone.0052267.t002
N1-P2 amplitude of standard tones of EEG data from inside the scanner showed a significant main effect of ‘n-back’ (Table 3, Figure 3; Wald x2(3) = 15.66, p,.001). Post-hoc pairwise comparisons showed that with increasing WM load, AEP amplitudes continuously increased from fixation to all subsequent WMconditions. The difference was significant (Bonferroni-corrected for all possible comparisons) between fixation and 2-back (t(12) = 22.62, p = .002) as well as between 0-back and 2-back (t(12) = 23.03, p = .01). The comparison between fixation and 1back (t(12) = 22.41, p = .03) was only significant if not Bonferronicorrected and the other comparisons (fixation compared to 0-back,
Fixation
9.19 (4.39)
0-back
10.34 (5.80)
1-back
11.41 (5.32)
2-back
11.28 (6.62)
doi:10.1371/journal.pone.0052267.t003
0-back compared to 1-back and 1-back compared to 2-back) were not significant. In EEG-only data, crossmodal effects on auditory processing replicated the effects of the data recorded inside the scanner. We found a significant main effect of ‘n-back’ on AEPs (Wald x2(3) = 9.49, p,.023). Post-hoc tests showed a significant increase from fixation to 1-back (t(7) = 22.83, p = .025). No other post-hoc test showed significant differences between conditions.
Figure 3. Cross-modal effects of visual WM load on auditory processing. Grand average waveforms represent the evoked responses to unattended standard sounds, measured inside the scanner (EEG-fMRI), and outside (EEG-only) under different crossmodal visual WM-load manipulations. For each WM condition, topographic maps are shown at the latency of the N1 peak at Fz. Line plots below the figures show the condition-effect on AEPs (absolute peak-to-peak N1-P2 amplitude). doi:10.1371/journal.pone.0052267.g003
PLOS ONE | www.plosone.org
7
December 2012 | Volume 7 | Issue 12 | e52267
Crossmodal Effects of WM on Auditory Processing
Table 4. N1-peak amplitudes covarying with BOLD signal (ANCOVA).
Brain region
Hemisphere
Size
T/F
P
x
y
Z
Average effect N1 (T-Test) Area 6
L
153
4.69
224
11
53
L
224
4.91
227
212
65
ACC
L
1870
5.77
,.001
28
36
9
PCC
L
2104
5.60
,.001
25
250
41
Middle Frontal gyrus
L
160
5.55
226
45
6
Inferior temporal gyrus
L
240
6.20
262
215
232
Superior parietal lobe
L
399
4.47
0.017
211
269
48
Amygdala
R
387
4.60
0.020
36
23
5
Caudate nucleus
R
400
4.58
0.017
9
26
23
Hippocampus
L
391
6.63
0.019
229
229
220
Main effect N1 (F-Test) DLPFC
L
146
11.78
254
32
28
Superior medial gyrus
L
297
11.99
212
59
21
Inferior parietal cortex
R
215
12.76
44
268
23
Precuneus
L
257
10.67
23
251
39
Activation patterns resulted from a group-level GLM. ‘Average effect N1’: T-contrast (T.3.29) testing for general effects of N1-amplitudes as a covariate. ‘Main effect N1’: F-contrast (F.6.48) testing for this covariate taking into account any differences between crossmodally manipulated n-back conditions. Both contrasts were inclusively masked (p,.05, uncorrected) with the effects of interest of the four HRF regressors and thresholded at p,.05 MC-corrected, k.125. P-values are only reported if surviving voxel-level FWE correction. doi:10.1371/journal.pone.0052267.t004
No significant main effect of ‘n-back’ was found for N1 or P2 latency in EEGfMRI or EEG-only data.
parietal lobe. Subcortical activation was located in the amygdala, caudate nucleus, and hippocampus (T-contrast testing for the average effect of the covariate, Figure 4, Table 4). When taking into account the cross-modal condition effect and testing for unsigned differences between any of the N1 peak amplitude regressors with an F-Test, activation patterns consisted of focal activations in the left DLPFC and superior medial gyrus, inferior parietal cortex and precuneus.
EEG-informed fMRI Covariate Analysis (ANCOVA) Generally, the N1 peak values of standard tones explained interindividual subject variance of the BOLD signal in bilateral anterior and posterior cingulate cortex, in left inferior and middle frontal gyrus, as well as inferior temporal gyrus and superior
Figure 4. Sagittal and axial slices displaying overlap of inter-subject variations in N1 peak values explaining BOLD variance with frontal core WM regions. Activation patterns resulted from a random-effects GLM including condition-wise N1 peak values for each participant as covariates, inclusively masked (p,.05 uncorrected) with the effects of interest of the HRF regressors. Green indicates the average effect of the AEP amplitudes (F.6.48, p,.05, MC-corrected), yellow indicates the main effect of AEP amplitudes, accounting for the cross-modal visual WM-condition (T.3.29, p,.05, MC-corrected). Both contrasts are overlaid on background blue coloring indicating the main n-back effect shown in Figure 3. DLPFC = dorsolateral prefrontal cortex, MPG = medial prefrontal gyrus, IPC = inferior parietal cortex. doi:10.1371/journal.pone.0052267.g004
PLOS ONE | www.plosone.org
8
December 2012 | Volume 7 | Issue 12 | e52267
Crossmodal Effects of WM on Auditory Processing
This effect was replicated in right AC (Wald x2(3) = 12.56, p = .006). Post-hoc t-tests tests indicated significantly higher deactivation in 2-back compared to fixation (t(14) = 4.68, p,.001), 2-back compared to 0-back (t(14) = 4.57, p,.001) and 2-back compared to 1-back (t(14) = 3.224, p = .006).
Table 5. Region-of-interest analyses of primary auditory cortices (AC), averages of mean activation (SD in brackets), subject to a generalized linear model (GLM) testing for significant differences between conditions.
Psychophysiological Interaction
Primary auditory cortex WM-condition
Left
Right
Fixation
20.15 (0.19)
20.13 (0.26)
0-back
20.07 (0.20)
20.16 (0.28)
1-back
20.07 (0.25)
20.26 (0.29)
2-back
20.29 (0.33)
20.48 (0.38)
Testing task-related functional connectivity of left AC in each WM-condition yielded the following results: during fixation, the AC showed significant functional connectivity with the right primary AC, precuneus, fusiform gyrus, and ventromedial PFC (Table 6, Figure 5). This changed with increasing WM-load to a connectivity pattern increasingly representing the fronto-parietal WM network (SMA, DLPFC, inferior parietal lobe, thalamus, and cerebellum). The parametric effect of WM-load (T-contrast conjunction combining 2-back.1-back > 1-back.0-back > 0back.fixation) revealed functional connectivity with bilateral inferior parietal lobes and sulci, several frontal areas (IFG, middle and superior frontal gyrus, SMA) as well as thalamus and lobules VI and VIIa crus I of the cerebellum (Table 6). When masking this contrast with the parametric effect of the initial nback GLM (inclusively masking, p,.05 uncorrected) we found one cluster in right DLPFC (MC-cluster-corrected, p,.05). The results of the PPI analysis of right AC task-related connectivity yielded similar results. Functional connectivity with the left AC under fixation condition appeared slightly weaker but the parametrically increasing functional connectivity with the fronto-parietal WM network was replicated.
doi:10.1371/journal.pone.0052267.t005
Neither P2 peak amplitudes, nor N1-P2 absolute peaks explained inter-individual subject variance above the set Montecarlo corrected threshold of p,.05.
Primary Auditory Cortex Region of Interest Analysis The GLM analyzing averaged time-series of each WM condition BOLD response from a region-of-interest analysis of left AC (main effect ‘n-back’, Wald x2(3) = 8.52, p = .04) revealed a significant increase in deactivation from the fixation condition to the different WM load conditions. Post-hoc tests showed significant deactivation increases between 0-back and 2-back (t(14) = 2.82, p = .014) and between 1-back and2-back (t()14) = 2.59, p = .21) only if uncorrected for multiple comparisons (Table 5).
Figure 5. Functional connectivity of left auditory cortex (PPI seed region) in different visual WM-load conditions. The top display reflects the parametrically increasing functional connectivity with core regions from the visual WM-load (p,.05, MC-corrected, k.125). The red circled region survives inclusive masking with the initial GLM testing for a parametric WM.-load increase. Lower displays show task-dependent functional connectivity of left AC in different conditions. All contrasts resulted from a group-level random-effects GLM analyzing effects for PPI interaction parameters (task by seed region) (p,.05, FWE-corrected, k.20). doi:10.1371/journal.pone.0052267.g005
PLOS ONE | www.plosone.org
9
December 2012 | Volume 7 | Issue 12 | e52267
Crossmodal Effects of WM on Auditory Processing
Table 6. Functional connectivity of left auditory cortex in different visual WM conditions.
Brain region
Hemisphere
Size
T
p*
x
236
21
25
.032
39
41
26
y
z
Parametric WM-load (conjunction 2-back.1-back > 1-back.0-back > 0-back.fixation) Inferior frontal gyrus/DLPFC
L
183
4.46
Middle frontal gyrus
R
342
4.53
R
499
5.04
29
0
51
Inferior parietal gyrus
L
1085
5.57
,.001
242
238
44
R
734
4.94
,.001
35
245
44
L
288
4.54
238
262
235
Lobule VIIa crus I Fixation Orbitofrontal/rectal gyrus
L
1682
7.91
,.001
25
53
217
Medial frontal gyrus
L
83
7.22
,.001
212
69
8
Heschl’s gyrus
R
457
7.72
,.001
39
215
15
Angular gyrus
L
208
6.22
.004
245
263
27
Precuneus
L
1502
7.43
,.001
29
254
12
R
114
6.24
.004
8
260
24
L
121
7.22
,.001
233
238
217
Medial frontal gyrus
L
298
7.04
,.001
26
54
14
SMA
R
258
6.91
,.001
0
25
62
L
62
6.36
.003
26
5
47
Putamen
L
130
6.65
,.001
229
22
3
Lobule VI
R
601
8.45
,.001
11
256
214
L
294
7.14
,.001
241
17
2
V
112
6.79
.001
47
5
32
Fusiform gyrus 0-back
1-back Inferior frontal gyrus
R
135
6.52
.002
57
8
17
Middle frontal gyrus
R
214
7.01
,.001
41
35
27
R
266
7.57
,.001
38
23
54
Superior frontal gyrus
R
65
6.48
.002
32
54
212
Rolandic Operculum
L
31
6.61
.001
253
5
11
Precentral gyrus
L
68
6.50
.002
238
217
59
SMA/pCC
L
2369
8.53
,.001
28
2
50
Inferior parietal lobule
L
954
7.40
,.001
250
236
50
R
2504
7.72
,.001
39
244
42
Insula
R
220
6.59
.001
32
20
3
Fusiform gyrus
R
29
6.22
.004
42
259
214
Putamen
L
276
7.35
,.001
233
3
25
R
111
6.33
.003
35
8
22
Thalamus
L
85
6.29
.003
212
214
6
R
110
6.18
.005
9
212
8
Lobule VIIb
L
37
6.11
.006
28
274
239
Lobule VIIa crus I
L
1234
8.38
,.001
233
266
230
Lobule VIIIa/VI
R
148
7.84
,.001
8
268
235
Lobule IV/VIIa
R
539
7.81
,.001
36
251
232 214
Lobule VI/V
R
124
6.53
.002
11
256
Lobule VI/VIIa crus I
L
284
7.39
,.001
29
277
224
Lobule VIIb
L
51
6.45
.002
227
269
251
L
906
9.47
,.001
236
21
26
R
1004
8.13
,.001
30
26
23
2-back Inferior frontal gyrus
PLOS ONE | www.plosone.org
10
December 2012 | Volume 7 | Issue 12 | e52267
Crossmodal Effects of WM on Auditory Processing
Table 6. Cont.
p*
x
y
z
13.12
,.001
248
26
29
9.80
,.001
45
30
33
6.91
,.001
239
48
12
174
6.53
.002
33
53
26
7299
12.58
,.001
25
6
50
7784
13.17
,.001
242
239
45
7855
11.84
,.001
36
245
44
539
7.86
,.001
253
265
215
Brain region
Hemisphere
Size
T
DLPFC
L
6068
R
3246
Middle frontal gyrus
L
735
R SMA
L
Inferior parietal gyrus
L R
Fusiform gyrus
L R
34
6.34
.003
44
260
214
Lentiform nucleus
L
1708
8.59
,.001
218
22
17
Thalamus
R
1246
8.01
,.001
18
0
17
Lobule VIIa crus I
L
3747
9.33
,.001
236
263
233
Lobule VIIa crus I/VI
R
1333
1.41
,.001
36
257
232
Lobule VIIb
L
51
7.12
,.001
227
271
251
Lobule VI/VIIIa
R
36
6.71
.001
39
242
253
Lobule VI
R
66
6.54
.001
18
253
224
Parametric WM-load conjunction contrast, T.3.24, p,.05, MC-cluster-corrected, k.125. Simple main effects of WM-load conditions, Ts.5.45, ps,0.05, FWE-corrected, k.20. doi:10.1371/journal.pone.0052267.t006
Crossmodal Augmentation Effects in Unattended Task Processing
busy with T1 consolidation, was challenged to a point of cognitive overflow where the effective suppression of inputs other than the attended one could not be guaranteed anymore. While the attentional blink paradigm challenges participants to the limits of conscious perception via temporal manipulation of sensory perception [52,53,54,55] and working memory consolidation in a short time period [12] the applied n-back task employed several levels of working memory load. Here, under low T1-load, the crossmodal processing of unattended T2-processing was smaller (smaller AEP amplitudes) than when compared to high T1-load (higher AEP amplitudes). Because an intuitive cause of this would
The primary task manipulation, a visual WM task, was validated by the fMRI results showing bilateral fronto-parietal and subcortical neural activation patterns corresponding to WMload [23] and participants’ behavior (increasing RTs and decreasing hit rates with increasing WM load, Figure 6). Basic auditory processing, represented by saturated standard tones revealed a simultaneously happening stepwise increase of the AEP corresponding to a gradual increase in crossmodal WM load. Cross-modal attention effects have been repeatedly reported on auditory processing [1,8,18]. Nevertheless, first, results are contradictory and range from an automaticity assumption regarding the basic analysis of auditory perception [6,7], to proposing differential effects of the primary task on several outcome parameters of the secondary task [10,11]. Secondly, to our knowledge, fundamental processing, as expressed by the N1P2 complex, had not been explicitly studied in a comparable design. Our results contradict the automaticity assumption and show a clear susceptibility of fundamental auditory processing to crossmodal WM load manipulation, systematically investigated by using four modulations. A susceptibility to crossmodal cognitive load influences supports and extends Haroush’s [12] findings. They argued that the enhanced processing of T2 was due to a lack of executive control which usually causes an attenuation of secondmodality input. This lack was present because the system, being
Figure 6. Outline of the reciprocal analysis strategy carried out with simultaneous EEG-fMRI, investigating differential effects of primary task visual working memory load on secondary task fundamental auditory processing. fMRI = functional magnetic resonance imaging, WM = working memory, ERP = event-related potential, ANCOVA = analysis of covariance, BOLD = blood oxygenation level dependent, ROI = region-of-interest, PPI = psychophysiological interaction. doi:10.1371/journal.pone.0052267.g006
Discussion The present study investigated how increasing visual WM-load (T1) affected secondary fundamental auditory processing (T2). EEG-fMRI enabled us to identify WM load activation representing the primary task manipulation as well as precision in the temporal domain to analyze neural action of simultaneously ongoing auditory processing.
PLOS ONE | www.plosone.org
11
December 2012 | Volume 7 | Issue 12 | e52267
Crossmodal Effects of WM on Auditory Processing
have to be found in generators of this response, we carried out a region-of-interest analyses in the primary auditory cortices in which active suppression of secondary input is either not possible or not intended due to mechanisms of generalizing attentional resources as described next.
smaller difference between deviant and standard tone processing under high load. The current investigation of fundamental tone processing might be an important step in a sensitive approach for evaluating cognitive load effects on continuous stimulus processing in a different modality. It remains speculative if deviant processing which recruits automatic, bottom-up attentional resources [59,19 63] appears less sensitive to cognitive load manipulations compared to standard processing (the datasets included only 45 deviant tones in total and we refrained from a condition-wise analysis).
Re-allocation of Cognitive Resources to the Primary Task and Spread of Attention Potential effects of decreasing central executive control inhibition on secondary task processing were investigated with region-ofinterest analyses of the BOLD response in both primary auditory cortices (ACs) as important auditory response generators [42,43]. The results revealed AC deactivation associated with cross-modal increasing task demands in T1. This, at first, questioned the presence of break-down of cognitive control on primary sensory areas because the latter should have intuitively caused an increase of the (uninhibited) primary AC. Instead, this processing decrease of a secondary task supported ’gain theory’ assumptions of resource allocation to the primary attended modality [56,57]. However, the auditory cortices are not the only generators of late AEPs [58] and attentional effects seem to play a crucial role here [17,59]. This promotes the possibility of differential regional contributions to the AEP [60] when cognitive crossmodal load comes into play. Indeed, our data showed correlations of N1amplitudes with BOLD activation in potential frontal contributors of AEPs [58]. When taking into account the cross-modal manipulation (main effect of covariate, F-contrast, Table 4), activation was present in DLPFC, superior medial gyrus and inferior parietal gyrus (Figure 4, yellow coloring). This hints to an involvement of the so-called ‘core’ network of WM-load activation [23] covarying with the electrophysiological response specifically when considering crossmodally manipulated WM load rather than if simply considering general effects the N1 amplitudes have on BOLD variance (green coloring). Hence, the AEP seems to be associated with visual WM nodes. We further carried out a psychophysiological interaction analysis (PPI) which resulted in a parametric effect of task-dependent functional connectivity of AC with the WM network. This might be due to a stepwise re-allocation of cognitive resources to regions associated with processing primary cognitive load. Contrary, during fixation, where no cognitive load was imputed left AC connectivity patterns were present in its contralateral counterpart, precuneus and vmPFC. We propose that low WM load did not intervene much with the limits of executive control and there was no necessity to re-allocate attentional resources. High load, however, subtracted attention from uni-modal sensory processing areas and allocated the available resources to the relevant neural structures which may contribute to a more increased joint generation of responses in the secondary modality [2,14,15,61,62]. This strongly suggests that the AEP is associated with nodes in a network, which may or may not biophysically contribute or modulate to its appearance. Our findings may finally help to explain the often reported decreases of the auditory change-effects which is represented in a
Limitations and Conclusion Using a simultaneous EEG-fMRI measurement protocol we demonstrated that basic auditory processing is systematically related to cross-modal cognitive load. We extend existing findings and show that increasing cognitive load impacts secondary task sensory processing. While a beneficial effect of crossmodal task load was found in elctrocortical responses of basic auditory processing by the vertex potential a deactivations of primary auditory cortices contradict a break down of executive control and rather points to a reallocation of attentional resources and spread of attention. However, the region-of-interest analysis was based on an anatomical template of the complete Heschl’s gyrus, which neglects to pay tribute to potential differential effects within this region. A potential caveat that should be considered is the mixing of effects in the fMRI analyses (main and PPI) in which one block consisted of multiple letter presentations, but also tone presentations. While this should be generally considered, a condition-effect is likely to be caused by the manipulated letter presentation (nback), however, an interaction with the (stable) tone presentation cannot be ruled out. Another aspect refers to trial-by-trial fluctuations as they have been shown to be of predictive value in simultaneous EEG-fMRI designs [64]. While regarding auditory trial-by-trial coupling is a matter of ongoing debate [24], our design with an inter-trial interval of 1.4 s of the tones did not allow for an event-related investigation of the BOLD response because of its inertness. Summarized, we could show that auditory cortices are increasingly connected to exactly those regions, which are upregulated during increasing demands of cognitive/attentional control. We further demonstrate that cognitive load crossmodally manipulates auditory-cortex functional connectivity patterns via mechanisms of spread of attention. This causes a re-allocation of neural networks associated with the generation of a secondary sensory memory signal. To what extent the identified nodes actually represent neural generators of the AEP remains to be explicitly tested.
Author Contributions Conceived and designed the experiments: CR UH TK IN. Performed the experiments: CR AF CM TK. Analyzed the data: CR MDV SD BIT. Contributed reagents/materials/analysis tools: BT UH IN. Wrote the paper: CR MDV SD.
References 4. Spence C (2011) Crossmodal correspondences: a tutorial review. Atten Percept Psychophys 73: 971–995. 5. Thorne JD, De Vos M, Viola FC, Debener S (2011) Cross-modal phase reset predicts auditory task performance in humans. J Neurosci 31: 3853–3861. 6. Na¨a¨ta¨nen R (1990) The role of attention in auditory information processing as revealed by event-related potentials and other brain measures of cognitive function. Behavioral and Brain Sciences 13: 201–288.
1. Bendixen A, Grimm S, Deouell LY, Wetzel N, Madebach A, et al. (2010) The time-course of auditory and visual distraction effects in a new crossmodal paradigm. Neuropsychologia 48: 2130–2139. 2. Zimmer U, Itthipanyanan S, Grent-’t-Jong T, Woldorff MG (2010) The electrophysiological time course of the interaction of stimulus conflict and the multisensory spread of attention. Eur J Neurosci 31: 1744–1754. 3. Driver J, Spence C (1998) Crossmodal attention. Curr Opin Neurobiol 8: 245– 253.
PLOS ONE | www.plosone.org
12
December 2012 | Volume 7 | Issue 12 | e52267
Crossmodal Effects of WM on Auditory Processing
7. Muller-Gass A, Macdonald M, Schroger E, Sculthorpe L, Campbell K (2007) Evidence for the auditory P3a reflecting an automatic process: elicitation during highly-focused continuous visual attention. Brain Res 1170: 71–78. 8. Otten LJ, Alain C, Picton TW (2000) Effects of visual attentional load on auditory processing. Neuroreport 11: 875–880. 9. Haroush K, Hochstein S, Deouell LY (2009) Momentary Fluctuations in Allocation of Attention: Cross-modal Effects of Visual Task Load on Auditory Discrimination. J Cogn Neurosci 22: 1440–1451. 10. Munka L, Berti S (2006) Examining task-dependencies of different attentional processes as reflected in the P3a and reorienting negativity components of the human event-related brain potential. Neurosci Lett 396: 177–181. 11. SanMiguel I, Corral MJ, Escera C (2008) When loading working memory reduces distraction: behavioral and electrophysiological evidence from an auditory-visual distraction paradigm. J Cogn Neurosci 20: 1131–1145. 12. Haroush K, Deouell LY, Hochstein S (2011) Hearing while blinking: multisensory attentional blink revisited. J Neurosci 31: 922–927. 13. Lavie N, Hirst A, de Fockert JW, Viding E (2004) Load theory of selective attention and cognitive control. J Exp Psychol Gen 133: 339–354. 14. Busse L, Roberts KC, Crist RE, Weissman DH, Woldorff MG (2005) The spread of attention across modalities and space in a multisensory object. Proc Natl Acad Sci U S A 102: 18751–18756. 15. de Fockert JW, Bremner AJ (2011) Release of inattentional blindness by high working memory load: elucidating the relationship between working memory and selective attention. Cognition 121: 400–408. 16. Na¨a¨ta¨nen R, Gaillard AWK, Ma¨ntysalo S (1978) Early selective-attention effect on evoked potential reinterpreted. Acta Psychol 42: 313–29. 17. Restuccia D, Della Marca G, Marra C, Rubino M, Valeriani M (2005) Attentional load of the primary task influences the frontal but not the temporal generators of mismatch negativity. Brain Res Cogn Brain Res 25: 891–899. 18. Zhang P, Chen X, Yuan P, Zhang D, He S (2006) The effect of visuospatial attentional load on the processing of irrelevant acoustic distractors. Neuroimage 33: 715–724. 19. May PJ, Tiitinen H (2010) Mismatch negativity. MMN., the deviance-elicited auditory deflection, explained. Psychophysiology 47: 66–122. 20. Na¨a¨ta¨nen R, Kujala T, Winkler I (2011) Auditory processing that leads to conscious perception: a unique window to central auditory processing opened by the mismatch negativity and related responses. Psychophysiology 48: 4–22. 21. Owen AM, McMillan KM, Laird AR, Bullmore E (2005) N-back working memory paradigm: a meta-analysis of normative functional neuroimaging studies. Hum Brain Mapp 25: 46–59. 22. Jaeggi SM, Buschkuehl M, Perrig WJ, Meier B (2010) The concurrent validity of the N-back task as a working memory measure. Memory 18: 394–412. 23. Rottschy C, Langner R, Dogan I, Reetz K, Laird AR, et al. (2012) Modelling neural correlates of working memory: A coordinate-based meta-analysis. Neuroimage 60: 830–846. 24. Mayhew SD, Dirckx SG, Niazy RK, Iannetti GD, Wise RG (2010) EEG signatures of auditory activity correlate with simultaneously recorded fMRI responses in humans. Neuroimage 49: 849–864. 25. Mulert C, Lemieux L (2009) EEG - fMRI: Physiological Basis, Technique, and Applications. Berlin Heidlberg: Springer. 26. Neuner I, Sto¨cker T, Kellermann T, Ermer V, Wegener HP, et al. (2010) Electrophysiology meets fMRI: neural correlates of the startle reflex assessed by simultaneous EMG-fMRI data acquisition. Hum Brain Mapp 31: 1675–1685. 27. Ullsperger M, Debener S (2010) Simultaneous EEG and fMRI: Recording, Analysis, and Application: Oxford University Press. 28. Oldfield RC (1971) The assessment and analysis of handedness: the Edinburgh inventory. Neuropsychologia 9: 97–113. 29. Ernst RR, Anderson WA. (1966) Application of Fourier transform spectroscopy to magnetic resonance. Rev Sci Instr 37: 93–102. 30. Ashburner J, Friston KJ (2005) Unified segmentation. Neuroimage 26: 839–851. 31. Glover GH (1999) Deconvolution of impulse response in event-related bold fmri. Neuroimage 9: 416–29. 32. Cox RW (1996) AFNI: software for analysis and visualization of functional magnetic resonance neuroimages. Computers and Biomedical Research 29: 162–173. 33. Eickhoff SB, Stephan KE, Mohlberg H, Grefkes C, Fink GR, et al. (2005) A new SPM toolbox for combining probabilistic cytoarchitectonic maps and functional imaging data. Neuroimage 25: 1325–1335. 34. Delorme A, Makeig S (2004) EEGLAB: an open source toolbox for analysis of single-trial EEG dynamics including independent component analysis. J Neurosci Methods 134: 9–21. 35. Allen PJ, Polizzi G, Krakow K, Fish DR, Lemieux L (1998) Identification of EEG events in the MR scanner: the problem of pulse artifact and a method for its subtraction. Neuroimage 8: 229–239. 36. Niazy RK, Beckmann CF, Iannetti GD, Brady JM, Smith SM (2005) Removal of FMRI environment artifacts from EEG data using optimal basis sets. Neuroimage 28: 720–737. 37. Vanderperren K, De Vos M, Ramautar JR, Novitskiy N, Mennes M, et al. (2010) Removal of BCG artifacts from EEG recordings inside the MR scanner: a
PLOS ONE | www.plosone.org
38.
39.
40. 41.
42.
43. 44. 45.
46. 47.
48.
49.
50. 51.
52. 53. 54. 55. 56. 57.
58.
59.
60.
61.
62. 63.
64.
13
comparison of methodological and validation-related aspects. Neuroimage 50: 920–934. Debener S, Strobel A, Sorger B, Peters J, Kranczioch C, Engel AK, Goebel R (2007) Improved quality of auditory event-related potentials recorded simultaneously with 3-T fMRI: removal of the ballistocardiogram artefact. Neuroimage 34: 587–597. De Vos M, De Lathauwer L, Van Huffel S (2011) Spatially Constrained ICA algorithms with an application in EEG processing. Signal Processing 91: 1963– 1972. Logothetis NK (2003) The underpinnings of the BOLD functional magnetic resonance imaging signal. J Neurosci 23: 3963–3971. Mijovic B, Vanderperren K, Novitskiy N, Vanrumste B, Stiers P, et al. (2012) The ‘‘why’’ and ‘‘how’’ of JointICA: Results from a visual detection task. Neuroimage 60: 1171–1185. Hari R, Aittoniemi K, Jarvinen ML, Katila T, Varpula T (1980) Auditory evoked transient and sustained magnetic fields of the human brain. Localization of neural generators. Exp Brain Res 40: 237–240. Picton TW, Alain C, Woods DL, John MS, Scherg M, et al. (1999) Intracerebral sources of human auditory-evoked potentials. Audiol Neurootol 4: 64–79. Hine J, Debener S (2007) Late auditory evoked potentials asymmetry revisited. Clin Neurophysiol 118: 1274–1285. Tzourio-Mazoyer N, Landeau B, Papathanassiou D, Crivello F, Etard O, et al. (2002) Automated anatomical labeling of activations in SPM using a macroscopic anatomical parcellation of the MNI MRI single-subject brain. Neuroimage 15: 279–289. Maldjian JA, Laurienti PJ, Burdette JH (2004) Precentral Gyrus Discrepancy in Electronic Versions of the Talairach Atlas. Neuroimage 21: 450–455. Maldjian JA, Laurienti PJ, Burdette JB, Kraft RA (2003) An Automated Method for Neuroanatomic and Cytoarchitectonic Atlas-based Interrogation of fMRI Data Sets. Neuroimage 19: 1233–1239. Brett M, Anton JL, Valabregue R, Poline JB (2002) Region of interest analysis using an SPM toolbox. In: 8th International Conference on Functional Mapping of the Human Brain. Sendai, Japan. Friston KJ, Buechel C, Fink GR, Morris J, Rolls E, et al. (1997) Psychophysiological and modulatory interactions in neuroimaging. Neuroimage 6: 218–229. Warbrick T, Bagshaw AP (2008) Scanning strategies for simultaneous EEGfMRI evoked potential studies at 3 T. Int J Psychophysiol 67: 169–177. Lazeyras F, Zimine I, Blanke O, Perrig SH, Seeck M (2001) Functional MRI with simultaneous EEG recording: feasibility and application to motor and visual activation. J Magn Reson Imaging 13: 943–948. Marois R, Ivanoff J (2005) Capacity limits of information processing in the brain. Trends Cogn Sci 9: 296–305. Kranczioch C, Debener S, Maye A, Engel AK (2007) Temporal dynamics of access to consciousness in the attentional blink. Neuroimage 37: 947–955. Dux PE, Marois R (2009) The attentional blink: a review of data and theory. Atten Percept Psychophys 71: 1683–1700. Janson J, Kranczioch C (2011) Good vibrations, bad vibrations: Oscillatory brain activity in the attentional blink. Adv Cogn Psychol 7: 92–107. Johnson JA, Zatorre RJ (2005) Attention to simultaneous unrelated auditory and visual events: behavioral and neural correlates. Cereb Cortex 15: 1609–1620. Mozolic JL, Joyner D, Hugenschmidt CE, Peiffer AM, Kraft RA, et al. (2008) Cross-modal deactivations during modality-specific selective attention. BMC Neurol 8: 35. Gallinat J, Mulert C, Bajbouj M, Herrmann WM, Schunter J, et al. (2002) Frontal and temporal dysfunction of auditory stimulus processing in schizophrenia. Neuroimage 17: 110–127. Debener S, Makeig S, Delorme A, Engel AK (2005) What is novel in the novelty oddball paradigm? Functional significance of the novelty P3 event-related potential as revealed by independent component analysis. Brain Res Cogn Brain Res 22: 309–321. Leavitt VM, Molholm S, Gomez-Ramirez M, Foxe JJ (2011) "What" and "where" in auditory sensory processing: a high-density electrical mapping study of distinct neural processes underlying sound object recognition and sound localization. Front Integr Neurosci 5: 23. Karns CM, Knight RT (2008) Intermodal Auditory, Visual, and Tactile Attention Modulates Early Stages of Neural Processing. J Cogn Neurosci 21: 669–683. Tellinghuisen DJ, Nowak EJ (2003) The inability to ignore auditory distractors as a function of visual task perceptual load. Percept Psychophys 65: 817–828. Na¨a¨ta¨nen R, Paavilainen P, Rinne T, Alho K (2007) The mismatch negativity. MMN. in basic research of central auditory processing: a review. Clin Neurophysiol 118: 2544–2590. Debener S, Ullsperger M, Siegel M, Fiehler K, von Cramon DY, et al. (2005) Trial-by-trial coupling of concurrent electroencephalogram and functional magnetic resonance imaging identifies the dynamics of performance monitoring. J Neurosc 25: 11730–11737.
December 2012 | Volume 7 | Issue 12 | e52267