area of interest to monitor and measure phenomenon and collaboratively ... including Local Area Network (LAN), Wireless Local. Area Network (WLAN), and ...
Augmented Reality Environmental Monitoring Using Wireless Sensor Networks Daniel Goldsmith, Fotis Liarokapis, Garry Malone, John Kemp Cogent Computing Applied Research Centre, Coventry University Department of Computer Science, Coventry CV1 5FB {goldsmid, F.Liarokapis, maloneg, kempj}@coventry.ac.uk Abstract Environmental monitoring brings many challenges to wireless sensor networks: including the need to collect and process large volumes of data before presenting the information to the user in an easy to understand format. This paper presents SensAR, a prototype augmented reality interface specifically designed for monitoring environmental information. The input of our prototype is sound and temperature data which are located inside a networked environment. Participants can visualise 3D as well as textual representations of environmental information in real-time using a lightweight handheld computer. Keywords--- Augmented Reality, Handheld Interfaces, Human-Computer Interaction, Wireless Sensor Networks.
1. Introduction Augmented Reality (AR) is a subset of a Mixed Reality (MR) that allows for seamless integration of virtual and real information in real-time. Other important characteristics of AR include real-time and accurate representation in three-dimensions (3D) as well as being interactive. However, AR is not limited to vision but can be applied to all senses including touch, and hearing [1]. Although many applications of AR have emerged, they are usually concerned with tracking. This is achieved using computer vision techniques, sensor devices, or multimodal interactions to calculate position and orientation of a camera/user. However, AR has not been actively employed for the visualisation of environmental information originating from a Wireless Sensor Network (WSN). Research within the WSN community has led to the development of new computing models ranging from distributed computing to large-scale pervasive computing environments [2]. This rapid evolution of pervasive computing technologies has allowed the development of novel interfaces which are capable of interacting with sensory information originating from the environment with little or no manual intervention. Although a number of technologies are able to perform natural interactions, pervasive AR is one of the strongest candidates. WSN technology uses networks of sense enabled miniature computing devices to gather information about the world around them. Common applications include
environmental monitoring, military, health, home, and education [3], [4]. While the gathering of data within a sensor network is one challenge, another of equal importance is presenting the data in a useful way to the user. Using low cost, low power computing devices equipped. A sensor network is composed of a large number of sensor nodes, with wireless communication and sensing hardware. These are deployed within the area of interest to monitor and measure phenomenon and collaboratively processes the data before relaying information to a base station or sink node. The constrained nature of the data gathering platform has lead to much of the active WSN research to be focused on network concerns such as data communication and energy efficiency. Recent initiatives such as Nokia's Sensor Planet [5] aim to incorporate sensor networks, mobile phones, and other devices into a large scale ad-hoc multipurpose sensor network [6] with sensor information available via a web based Application Programming Interface (API). The use of these commonly available and familiar devices is envisaged to allow WSN to become part of the pervasive computing mainstream, requiring new approaches to information visualisation to process the vast amount of information available. This paper presents SensAR - an environmental monitoring prototype that uses WSN to gather temperature and audio data about the user’s surroundings. SensAR displays the environmental information in an understandable format using a realtime handheld AR interface. Participants can visualise 3D as well as textual representations of the sound and temperature information in a tangible manner. To our knowledge, SensAR is the first to embody the idea of combining sound and temperature data in a handheld AR environment. The remainder of this paper is organised as follows: Section 2 describes some of the most important related work. Section 3 gives an overview of our systems architecture including a brief description of its main components. Section 4 presents the operation of the handheld AR interface in an indoor networked environment. Section 5 illustrates how the environmental information coming from the sound and temperature sensors is visualised in an AR environment through 3D objects and textual annotations. Finally, section 6 concludes by presenting our plans for future work
2. Related Work A number of WSN applications have been proposed in the past and some of the most characteristic systems are presented here. iPower [7] utilises a WSN to provide intelligent energy conservation for buildings. The system is composed of a sensor network that gathers data on light levels, temperature, and sound to activate appliances based on the likelihood of a room being occupied. If the system detects low temperature or high brightness in a room that is unlikely to be occupied, a signal can be sent to turn off the air-conditioning or reduce lighting levels. If the network receives a signal that the area is still occupied (for instance detection of a noise) the system returns the light and temperature levels to values suitable for comfortable use of the room. Aside from a system overview provided by the user interface iPower has no data visualization, it nevertheless presents a practical application of wireless sensor networks in environmental monitoring. SpyGlass [8] is concerned with the provision of a visualization framework for WSNs. Data is gathered on a gateway node within the network then passed to the visualization application on a remote machine. The data is passed using the TCP/IP suite of protocols and therefore can be carried over many network types including Local Area Network (LAN), Wireless Local Area Network (WLAN), and General Packet Radio Service (GPRS). Network visualisation is provided by a Graphical User Interface (GUI) allowing an overall view of the network to be displayed. This visualization component is comprised of a relation layer to display relationships between nodes and a node layer to draw the nodes themselves. The ‘Plug’ sensor network [9] is a ubiquitous networked sensing platform ideally suited to broad deployment in environments where people work and live. The backbone of the Plug sensor network is a set of 35 sensor, radio, and computation enabled power strips. A single Plug device fulfils all the functional requirements of a normal power strip and can be used without special training. Additionally, each Plug has a wide range of sensing modalities (e.g., sound, light, electrical voltage and current, vibration, motion, and temperature) for gathering data about how it is being used and its nearby environment. In terms of handheld AR sensing applications, most prototypes that exist focus on multimodal interactions using tracking sensors. An interesting approach to 3D multimodal interaction in immersive AR environment that accounts for the uncertain nature of the information sources was proposed by [10]. The multimodal system fuses symbolic and statistical information from a set of 3D gesture, spoken language, and referential agents. The referential agents employ visible or invisible volumes that can be attached to 3D trackers in the environment, and which use a time stamped history of the objects that intersect them to derive statistics for ranking potential referents.
Another approach proposed an architecture for handling events from different tracking systems and maintaining a consistent spatial model of people and objects [11]. The principal distinguishing feature is the automatic derivation of dataflow network of distributed sensors, dynamically and at run-time, based on requirements expressed by clients. This work also classifies sensor characteristics for AR and Ubicomp. Moreover, a grid of sensors was used to synthesize images in AR by interpolating the data and mapping them to colour values [12]. This application used an optically tracked mobile phone as a see-through handheld AR display allowing for interaction metaphors already familiar to most mobile phone users. The sensor network is interfaced by visualizing its data within its context, taking advantage of the spatial information. Furthermore, techniques for creating indoor location based applications for mobile augmented reality systems using computer vision and sensors have been also well documented [13]. An indoor tracking system was proposed that covers a substantial part of a building. It is based on visual tracking of fiducial markers enhanced with an inertial sensor for fast rotational updates. To scale such a system to a whole building, a space partitioning scheme was introduced to reuse fiducial markers throughout the environment.
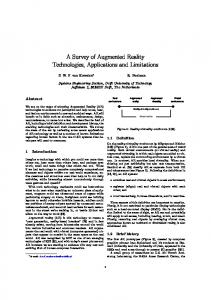
3. System Architecture SensAR follows an experimental prototype recently presented [14]. However, there are many differences with the earlier prototype. Firstly, sound and temperature sensors are populated inside the environment (see Figure 2). Secondly, WiFi is used instead of Bluetooth providing a much faster method of communication, although Bluetooth can be enabled for connecting other hardware devices. Finally, the mobile client side provides enhanced visualisation options including textual and 3D information. SensAR uses a three-tier architecture consisting of a sensor layer, communication layer, and visualisation layer. A diagrammatic overview of the pipeline of our system is presented in Figure 1.
Figure 1 Architecture of SensAR The sensor layer handles multimodal data from temperature and sound sensors, positioned at fixed locations within an indoor environment. These sensors are attached to a WSN node, which is capable of performing the initial processing before passing the data up the protocol stack. In the case of the WSN node, the
data is formatted ready for transmission by the communication layer. The data is transferred over a WiFi link via User Datagram Protocol (UDP) to a dedicated server on the visualisation machine. This link is bidirectional, and allows control packets to be sent between each device. The visualisation layer contains the handheld device running the AR software. The data received is represented using visual information such as 3D objects and textual information.
3.1 Hardware There are a variety of available embedded platforms for sensing applications. Communication technologies such as Bluetooth, WiFi and ZigBee [15] allow for network collection and transfer of environmental data to wearable devices. The hardware choice decision for the network discussed here was based on the available platforms' sensing capability, ease of software development and size. Gumstix Verdex XM4-bt boards were selected as the main processing platform. Although not as popular as Mica2 motes for wireless sensing applications, they are becoming more prevalent [16]. These devices offer more processing power and memory (in terms of both RAM and flash) than many similarly sized platforms. The particular model chosen includes an Intel XScale PXA270 400MHz processor, 16MB of flash memory, 64MB of RAM, a Bluetooth controller and antenna, 60pin and 120-pin connectors for expansion boards, and a further 24-pin flex ribbon connector. There are no onboard sensors provided, though a variety of interface methods are available.
Figure 2 Sound and Temperature Sensors Commercially available expansion boards for the Gumstix platform include communications options such as WiFi and Ethernet, along with additional storage provided by Compact Flash (CF) cards. An expansion board developed in house additionally provides an I2C
bus for the connection of sensors, along with a ZigBee compatible module. The sensors used for temperature sensing were the Analog Digital ADT75A chip [17], which performs sampling and conversion internally, providing the sensed temperature values via an I2C bus. For visualisation, a VAIO UX Ultra Mobile PC (UMPC) was used, which is one of the smallest fully functioning PCs ever made. Comparable to PDAs in size, but with more powerful processing capabilities, it is able to run complex AR applications. VAIO UX includes an Intel® Core™ Solo Processor at 1.3MHz, wireless 802.11a/b/g, 32GB hard drive, 1GB SDRAM, 4.5" touch panel LCD, a Graphics Accelerator and 2 built-in digital cameras. This makes it a suitable device to handle our WSN configuration and display the visualisation with real-time performance
3.2 Software At the heart of the sensing system is a collection of software libraries developed as part a software support system for WSN. The provision of a generic interface to common sensor network tasks allows the implementation details of complex tasks to be hidden, thereby offering the systems designer a cleaner workflow. Software abstractions of sensing and communication tasks have been created, allowing the user to plug functionality into the application. A generic interface to the I2C bus has been implemented to allow access to data from the temperature modules. The API allows other I2C enabled devices such as digital compasses, pressure sensors, accelerometers, and light meters to be supported. Using an abstraction model for sensing interfaces, the process of gathering data is simplified, as similar function calls are used to retrieve information from different devices. This in turn allows a modular approach to application development. The framework supports a range of communication protocols and interfaces, offering the choice of Bluetooth, WiFi and Ethernet based data transfer. Support is also provided for network protocols offered by each communications stack. As an example, WiFi offers connection orientated TCP and connectionless UDP allowing the user to balance the requirements of the application with the quality of service received. In keeping with the modular theme of the framework, the communication modules are interchangeable. This allows the user to swap between radio devices by simply changing the software module used. In the instance of WiFi and Ethernet this is a straight swap as the two communications mediums use the IP suite of protocols, and addressing schemes. However if the user wishes to switch to Bluetooth communication, the alternative hardware addressing would scheme would need used, all other communication calls are handled in the same way regardless of communication medium. The sensing layer was developed using the above framework. Using the high-level Python programming language for development has allowed the algorithms for
the gathering of data to be prototyped with a development cycle much shorter that that associated with complied languages such as C. Although Python offered ease of development, the framework has also been implemented in a collection of C libraries, allowing the final application to be transferred to this faster executing compiled language for deployment. Whilst Python and C have differences in syntax, the framework has been designed to take account of the similarities in functionality and programming methodology afforded by both languages. This allows the code developed to be transferred between each language making only small syntactical changes. The visualisation layer used the OpenGL API for the rendering of the 3D environmental representations. The textual augmentations were implemented based on GLUT API which provides support for bitmap fonts. The six-degrees-of-freedom tracking of the user inside the environment was based on ARToolKit library [18] and the rest of the coding of the handheld interface was performed in C programming language. Finally, the 3D models used in the visualisation were designed using an open source modelling tool (Blender) and exported in VRML file format.
Users can navigate inside the room by moving the UMPC and detecting different markers. SensAR checks each video frame for predetermined patterns that are included in the environment. These are squares containing a unique black and white image that the program can be programmed to recognize. The markers used in this project have been specifically selected from the ARTag library [19] to be distinct from one another regardless of orientation or reflection. The current version of the system uses patterns numbered 1 to 12, taken from the ARTag implementation of the ARToolKit as shown in Figure 4.
4. Handheld AR Interface A handheld AR interface has been implemented in order to allow a user to experience the environmental information gathered. Sensors collect sound and temperature level data at various points in space and relay this information to SensAR. A user interface is then used to seamlessly superimpose computer generated representations of sound and temperature based on the readings of these sensors. Figure 3 illustrates how a user operating the handheld interface would perceive a 3D representation of environmental information (in this case temperature and sound) in a mobile AR environment.
Figure 3 Handheld AR Visualisation
Figure 4 Marker Setup The markers are placed so that the centre of the pattern is halfway up the height of the wall (142.5cm from the floor). For each marker different sound and temperature sensors are attached as close to the markers as possible to give accurate localisation readings. The markers are enlarged as much as possible whilst still fitting on a single sheet of A4 size sheet of paper. When the program detects a marker within a video frame, it overlays a 3D model of a thermometer and a music note onto the video image (Figure 6 and Figure 7). One of the versions of our program also includes a 3D representation of the entire room, which is projected over the real room in AR. In order for this to line up with the real image sent from the camera, we have to attach the model to one of the 12 markers (Figure 4), much in the same way as the 3D virtual sensors as illustrated in Figure 5.
Figure 5 Virtual Representation of Environment
Figure 6 Low Levels of Sound and Temperature
However, if there are several markers in view, we don't want the program to draw multiple versions of the virtual room. To prevent this, we exploit the confidence value that is used in marker detection. Each detected pattern is then checked for correlation with the markers detected by the program and a confidence value is generated to show the level of similarity. SensAR compares the confidence values of the patterns that have been established as being markers. The marker that has the greatest confidence value is used as the point from which to draw the virtual room. One advantage with using this system is that the room will automatically revert to the next best marker in sight should the most visible marker become obscured.
When environmental data is transferred to the AR interface, the color of the 3D thermometer and the 3D music note change according to the temperature level and sound volume accordingly. In addition, textual annotations indicate the sensor readings. For the temperature data, the readings from the sensors (which have an error of ± 0.1) are superimposed as text next to the 3D thermometer. For the sound data, a different measure was employed based on a scale 0 to 4, where 0 corresponds to ‘quiet’, 1 corresponds to ‘low’, 2 corresponds to ‘medium’, 3 corresponds to ‘loud’ and 4 corresponds to ‘very loud’. This choice of banding has been based on user input, to provide a clearer representation of sound levels than a raw value could. Also note that the bottom right side displays the intensity of the sound level. A screenshot of the above configuration is shown in Figure 7.
5. Environmental Data Visualisation There is an open issue of how to visually represent environmental data coming from the WSNs. One of the aims of this work was to select an appropriate metaphor to assist users in rapid interpretation of the information. After some informal evaluation, it was decided to represent the environmental information through the use of a 3D thermometer and a 3D music note. In the previous prototype (which included only sound data) a 3D microphone was used. In terms of operation, as soon as the temperature and sound sensors are ready to transmit data, visual representations including a 3D thermometer and a 3D music note as well as textual annotations are superimposed onto the appropriate marker. This is the neutral stage of SensAR where no sensor readings are actually inputted to the AR interface. An example screenshot of the neutral stage is illustrated in Figure 6.
Figure 7 High Levels of Sound and Temperature It is worth-mentioning that the camera position is also displayed on the top left side of the interface. This feature is useful for calculating the position of the user in respect to the rest of the environment. Moreover, users can interact with the superimposed information using the keyboard or the mouse of the UMPC. In this way, it is possible to translate, rotate or scale the visual augmentations in real-time. In addition, it is possible to
hide the various elements of the interface such as the camera position, the textual annotations and the 3D objects.
[7]
6. Conclusions and Future Work
[8]
This paper describes SensAR, a prototype mobile AR system for visualising environmental information including temperature and sound data. Sound and temperature data are transmitted wirelessly to our client which is a handheld device. Environmental information is represented graphically as 3D objects and textual information in real-time based. Participants visualise and interact with the augmented environmental information using a small but powerful handheld computer. The main advantage of SensAR is the visual representation of wireless sensor data in a meaningful and tangible way. We believe that SensAR design principle is essential for the effective realisation of ubiquitous computing. In the future we are planning to integrate more sensors to SensAR including light, pressure and humidity. On the visualization side, we are currently working with a head-mounted display that includes orientation tracking to provide a greater level of immersion to the users. In terms of interaction other forms of interaction will be added to the prototype such as a digital compass, a virtual reality glove and the Wii controller. Finally we plan to do user extensive studies to test the feasibility of SensAR application.
[9]
[10]
[11]
[12]
[13]
[14]
Acknowledgements The authors would like to thank Dr. Elena Gaura and the rest of the team in the Cogent Computing Applied Research Centre for their support and inspiration as well as Louis Macan, Sarah Mount and Prof. Robert Newman who worked so hard during the development of the first prototype.
[15] [16]
References [1] [2]
[3] [4] [5] [6]
Azuma, R., Baillot, Y., et al. Recent Advances in Augmented Reality, IEEE Computer Graphics and Applications, 21(6): 34-47, 2001. Harihar, K., Kurkovsky, S. Using Jini to Enable Pervasive Computing Environments, In Proc. of the 43rd Annual Southeast Regional Conference - Volume 1, Architecture and distributed systems, ACM Press, Kennesaw, Georgia, 188-193, 2005. Akyildiz, I.F., Su, W., Sankarasubramaniam, Y., Cayirci, E. Wireless sensor networks: a survey. Computer Networks, 38(4): 393-422, 2002. Culler, D., Estrin, D., Srivastava, M. Guest Editors' Introduction: Overview of Sensor Networks, Computer 37(8): 41-49, 2004. SensorPlanet, Available at: [http://www.sensorplanet.org/], Accessed at: 29/02/2008. Tuulos, V.H., Scheible, J., Nyholm, H. Combining Web, Mobile Phones and Public Displays in Large-Scale: Manhattan Story Mashup, In Proc. of the 5th Int’l Conference on Pervasive Computing, Canada, 37-54, 2007.
[17] [18] [19]
Yeh, L.W. Wang, Y.C, Tseng, Y.C. iPower: An Energy Conservation System for Intelgent Buildings by Wireless Sensor Networks, To appear in Int'l Journal of Sensor Networks, 5(2), 2009. Buschmann, C., Pfisterer, D., et al. Spyglass: a wireless sensor network visualiser, SIGBED Review, 2(1): 1-6, 2005. Lifton, J., Feldmeier, M., et al. A platform for ubiquitous sensor deployment in occupational and domestic environments, In Proc. of the 6th Int’l Conference on Information Processing in Sensor Networks, ACM Press, Cambridge, Massachusetts, USA, 119-127, 2007. Kaiser, E., Olwal, A., et al. Mutual Disambiguation of 3D Multimodal Interaction in Augmented and Virtual Reality, In Proc. of the 5th Int’l Conference on Multimodal Interfaces, ACM Press, November 5-7, Vancouver, British Columbia, Canada, 12-19, 2003. Newman, J., Schall, G., Schmalstieg, D. Modelling and Handling Seams in Wide-Area Sensor Networks, In Proc. of the 10th Int’l Symposium on Wearable Computers, IEEE Computer Society, Montreux, Switzerland, 51-54, 2006. Rauhala, M., Gunnarsson, A.S., Henrysson, A. A novel interface to sensor networks using handheld augmented reality, In Proc. of the 8th Int’l Conference on HumanComputer Interaction with Mobile Devices and Services, ACM Press, Helsinki, Finland, 145-148, 2006. Reitmayr, G., Schmalstieg, D. Location based Applications for Mobile Augmented Reality, In Proc. of the 4th Australasian User Interface Conference, Adelaide, Australia, 65-73, 2003. Liarokapis, F., Newman, R., et al. Sense-Enabled Mixed Reality Museum Exhibitions, In Proc. of the 8th Int’l Symposium on Virtual Reality, Archaeology and Cultural Heritage, Eurographics, Brighton, UK, 26-30 November, 31-38, 2007. IEEE 802.15.4. IEEE Standard for Information technology Part 15.4: Specifications for Low-Rate Wireless Personal Area Networks (LR-WPANs), 2003. Keoh, S.L., Dulay, N., et al. Self managed cell: A middleware for managing body sensor networks. In Proc of the 4th Int’l Conference on Mobile and Ubiquitous Systems: Computing, Networking and Services (Mobiquitous), Philadelphia, USA, August, 1-5, 2007. ADT75, Available at: [http://www.analog.com/en/prod/0%2C2877%2CADT75 %2C00.html], Accessed at: 25/02/2008. ARToolKit, Available at: [http://www.hitl.washington.edu/artoolkit/], Accessed at: 25/02/2008. ARTAG, Available at: [http://www.artag.net/], Accessed at: 29/02/2008.