USING AUGMENTED REALITY FOR REAL-TIME VISUALIZATION OF TACTILE HEALTH EXAMINATION
Gennadiy Nikishkov and Tomokazu Tsuchimoto University of Aizu, Aizu-Wakamatsu 965-8580, Japan
[email protected],
[email protected]
Keywords:
Augmented reality, visualization, tactile measurements.
Abstract:
An augmented-reality approach to real-time visualization of tactile data with projection on a human organ is presented. A target procedure is breast cancer examination with a tactile sensor. The special tactile sensor is used to measure tissue stiffness values at discrete points of the examined organ. We developed an augmented reality system which integrates the tactile sensor, a head-mounted display with a small video camera, and a notebook computer. Tracking of the human organ and the tactile sensor is based on optical markers. One marker is attached to the patient’s body and is used to track the spatial position of the human organ. Another marker is placed on the tactile sensor. Registering space positions of this marker with respect to the first marker allows determination of the shape of the human organ for subsequent data visualization. Results of stiffness measurements are depicted as semi-transparent three-dimensional objects projected on the patient’s body. Different visualization techniques are employed depending on the amount of data and user preference. Experiments with sensing tactile data and its visualization for a variety of objects, including a silicon breast model and animals organs, have been performed. It was found that the developed augmented-reality system is useful in medical-physics measurements.
1
INTRODUCTION
Most breast cancers are detected by tactile investigation. The most common method of breast cancer detection is palpation. A health care professional employs palpation to feel the size and firmness of a lesion. Human fingers are sensitive tools for determining stiff areas. However, rigorous training and extensive experience of a person performing palpation are necessary. Even in the case of correct diagnosis, it is impossible to register results of palpation in quantitative form. Physical measurements of tactile information can be done with tactile sensors (Omata and Terunuma, 1992), (Srikanchana et al., 2002), (Kearney et al., 2004), (Girnyk et al., 2006). Different tactile sensors are based on different physical principles for measuring information that helps to discover lesions. The main advantage of tactile sensors over hand palpation is the possibility of registering quantitative information which can be stored and used in the future for
comparison purposes. In addition to archiving of tactile information it is important to develop methods of visual representation and digital documentation of the physical examination (Kaufman et al., 2006). It is also important to get real-time visual information on measurements during medical examination procedure. To provide real-time support for breast tactile measurements we selected the augmented reality (AR) approach (Azuma, 1997). The AR approach augments a real view of an object with additional graphical information generated by computer. The purpose of our research is to develop an AR system for real-time visualization of tactile data directly on the surface of a human organ (in this case, breast) under examination. Augmented reality has been used in medical applications for more than a decade (Bajura et al., 1992). Currently, usage of augmented reality in medical applications is characterized by a three-dimensional approach to visualization (Sakas, 2002) and by employing augmented-reality systems in clinical practice
91
GRAPP 2007 - International Conference on Computer Graphics Theory and Applications
Tactile censor
Frequency Voltage
Frequency counter
Tactile data
Camera HMD
Display Sensor
Camera
Video
Artoolkit
Sensor position Projection matrix
Markers
Visualizer
Object
PC
Video
a
b
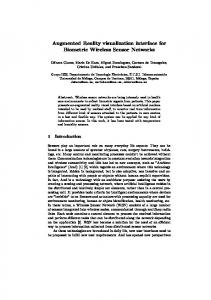
Figure 1: Augmented-reality system for measurement and visualization of human tissue stiffness: a) main system components and software modules with data flow; b) use of the system by the physician.
(Konishi et al., 2005). Related research (Balasingham et al., 2003), (Birkfellner et al., 2002) and (Das et al., 2006) is devoted to augmented reality visualization in operating environments. Typically, AR is used to overlap crosssectional medical images onto patient space, thereby allowing a physician to see under the surface. Rosenthal et al. (Rosenthal et al., 2002) performed projection of a cross-sectional image of a tumor into patient space. An invasive instrument, such as a biopsy needle, is simultaneously tracked and projected into the same patient space. Watching the whole picture, the physician operates the needle with AR guidance. The goal of the work that we present in this article is an augmented reality system which performs real-time visualization of tactile information during breast cancer examination: picture representing measured tactile information projected on the patient’s body, which moves and has complicated shape. To perform AR visualization of tactile data, two markers are used. One marker serves for tracking the patient’s body position. The other marker, placed on the tactile sensor is used to determine three-dimensional shape of the organ where tactile measurements are performed. Visual information – in the form of bars, contours, or contour surfaces – is superimposed on the patient’s body, taking into account the actual organ shape. To observe AR visualization a doctor wears a head-mounted display (HMD) with a small video camera. The AR visualization can be also viewed on a computer screen. Contributions of this paper in medical visualization are: real-time integration with a measurement device; use of a second marker for determining the shape of the human’s organ; and AR visualization of tactile data projected on the patient’s body.
92
2
AR SYSTEM DESCRIPTION
A system for measurement and visualization of tactile information should fulfill the following requirements: • The system should integrate real-time measurements and visualization; • Visualization image should be projected on the patient’s organ, which is not flat; • Depending on the amount of data, different types of visual data representation should be available; • The system should be based on common and inexpensive hardware components.
2.1 System Design The main system components and software modules with data flow in our prototype are shown in Fig. 1a. The system consists of a tactile sensor, an HMD, a video camera, and a notebook computer. Two markers are used for tracking the human organ (measurement object) and for determining its shape. The tactile sensor in combination with the frequency counter produces tactile data in the form of tissue stiffness values at discrete points. Frames from video camera are analyzed using ARToolkit (ARToolkit, 2006) software. Two markers are identified and the position and orientation of the object and the tactile sensor are established. Visible appearance of the object marker is used for estimating a projection matrix. A visualizer software module creates contours or other visualization elements for the tactile data and makes their proper superposition with frames produced by the video camera. The result is real-time AR visualization of the tactile data projected on the patient’s body. The use of the AR system by a physician is illustrated by Fig. 1b.
USING AUGMENTED REALITY FOR REAL-TIME VISUALIZATION OF TACTILE HEALTH EXAMINATION
2.2 Hardware Camera
The following hardware is used to implement the system for real-time visualization of tactile data:
AR
• Tactile sensor with a piezoelectric transducer (PZT) developed at Nihon University (Omata and Terunuma, 1992). • Head-mounted display i-glasses PC/SVGA with two miniature screens of SVGA (800×600) resolution (i-O Display Systems). • Video camera PYRO 1394 WebCam with VGA (640×480) resolution and 30 frames per second output through IEEE 1394 (FireWire) interface (ADS Technologies). • Notebook computer with 3.20 GHz Intel Pentium 4 and 1 GB memory. • Rectangular paper markers. The main part of the tactile sensor is a piezoelectric transducer, which helps to estimate stiffness values of tissue near the surface of the skin. The measurement principle is based on the phenomenon of changing resonant frequency of the vibrating PZT as it comes into contact with a material surface. The changes in frequency are evaluated by the frequency counter and transmitted to a computer through USB interface. The tactile sensor produces single values of tissue stiffness at each contact point. Since the measurement act is immediate, it is not difficult to perform numerous measurements at different points. Two square markers of known size are utilized for optical tracking. Tracking of the target object is performed with the help of an object marker. A sensor marker is used to determine location of the tactile sensor tip and orientation of the sensor axis. In practice, we used three markers attached to the top and sides of the tactile sensor. Usually it is possible to discover two of three markers and to use both for sensor tip position determination with subsequent averaging.
3
TRANSFORMATIONS AND SHAPE DETERMINATION
In order to apply AR to visualization of tactile data, it is necessary to estimate camera parameters, space orientation of the organ, and space locations of the tactile sensor tip at measurement moments. Mathematically these requirements are equivalent to determination of perspective transformation and rigid body transformation matrices for the target object and for the tactile sensor.
Ts To
Sensor marker
Sensor ps
Object marker po
Figure 2: Object, camera, sensor, and markers. The object marker yields transformation matrices for projection. The sensor marker is used for registration of sensor spacial positions.
3.1 Projection Matrix The relationship between a projected (video) image and a three-dimensional object is described by a 4 × 4 projection matrix. Using this matrix, computergenerated objects can be overlaid on real-world objects. We use the open-source library ARToolkit to track small square markers and to determine their transformation matrices in real time. The relationship between a camera screen coordinate system and an object marker coordinate system (see Fig. 2) can be expressed as hxc Xc Xo hyc Yc Yo h = P Z = PTo Z , (1) c o 1 1 1 where h is a scale factor; (xc , yc ) are the camera screen coordinates ; (Xc , Yc , Zc ) are the camera coordinates; (Xo , Yo , Zo ) are the object marker coordinates; P is a perspective projection matrix, and To is a rigid transformation matrix from the object coordinate system to the camera coordinate system. The perspective projection matrix P is predetermined by a camera calibration procedure with the use of four vertices of the object marker. The rigid transformation matrix To for the object is calculated in real-time. These matrices are specified inside the usual computer graphics pipeline for drawing threedimensional objects correctly superimposed on video frames.
3.2 Sensor Space Positions To determine three-dimensional positions of points where measurements of tissue stiffness are performed, images of the sensor and object markers are
93
GRAPP 2007 - International Conference on Computer Graphics Theory and Applications
graphical presentation. In the beginning of a measuring process, when the number of measurements is small, simple visualization like drawing points with numerical values can be appropriate. As the number of points accumulates, it is desirable to use more sophisticated visualization technique like contour maps. During compositing of visualization pictures combined with real-world video,the non-flat shape of the target object (human organ under examination) should be accommodated. Using sensor spatial positions, the surface of the human organ is constructed and the visualization image is projected onto this surface.
Figure 3: Estimating tip position ps for the tactile sensor. For calibration, it is necessary to place the sensor tip at the line intersection.
used. The measurement procedure with the use of two markers is illustrated by Fig. 2. Let ps be a sensor tip position in the sensor marker coordinate system. The same measurement position in the object marker coordinate system po is calculated as po = To T−1 (2) s ps . Here To and Ts are rigid body transformations from the object coordinate system and from the sensor coordinate system to the camera coordinate system, respectively. Since the sensor tip and the sensor marker do not occupy same space position, a calibration procedure is used to establish additional transformation from the sensor marker to the sensor tip. The user interface for calibrating the sensor is shown in Fig. 3. The object marker is placed on a plane surface. Two lines intersecting at z = 0 of the object marker plane are drawn in video image. For calibration, the user puts the sensor tip at the line intersection. The position ps is estimated as ps = Ts T−1 o pi ,
(3)
4.1 Surface and Data Approximation During measurement process, spatial positions of the tactile sensor tip are determined and recorded. These positions are directly used in simple point-wise visualization techniques like bars. For drawing smooth contour graphs, it is necessary to derive smooth surface approximations and possibly smooth data approximations. We have selected a multi-level Bsplines approximation (MBA) approach (Lee et al., 1997). The B-spline surface is defined by a control lattice Φ over the approximation domain. Let φij be the value at the ij-th control point on the lattice Φ, where (i, j) for i = −1, 0, ..., m + 1 and j = −1, 0, ..., n + 1, and m, n are numbers of control points in x and y directions. Coordinates x and y are normalized in such a way that 0 ≤ x < 1, 0 ≤ y < 1. The B-spline approximation f is defined by f (x, y) =
3 X 3 X
Bk (s)Bl (t)φ(i+k)(j+l) ,
(4)
k=0 l=0
where i = ⌊x⌋ − 1; j = ⌊y⌋ − 1:, s = x − ⌊x⌋; t = y − ⌊y⌋; and Bk and Bl are the uniform cubic B-spline basis functions. It is necessary to find values for φij that yield the value zc at (xc , yc ) as zc =
3 X 3 X
Bk (xc − ⌊xc ⌋)Bl (yc − ⌊yc ⌋)φkl . (5)
k=0 l=0
where pi is the position of line intersection in the object marker coordinate system.
4
VISUALIZATION PROCEDURE
Our AR system provides real-time visualization of tactile data in several forms depending on the amount of data and user preference. New measurements of stiffness values are immediately incorporated into the
94
Pseudo-inversion is used to find the values φij at the control points. The approximation domain is subdivided hierarchically up to a specified level. The surface created by the MBA is controlled by initial (m0 , n0 ) and final grid sizes (mh , nh ). We use the MBA approach for approximating both the shape of the object and the tactile data with m0 = n0 = 1 and mh = nh = 256. The MBA approximation can be done in real time since each new additional point affects only 16 surrounding control points.
USING AUGMENTED REALITY FOR REAL-TIME VISUALIZATION OF TACTILE HEALTH EXAMINATION
4.2 Visualization Techniques
Tactile data
Our graphical user interface enables several visualization techniques. Switching among these visualization techniques can be easily done at any time. The visualization techniques of the AR system for tactile data visualization include the following:
Sensor locations
Gradation strip Geometric surface Contour map
• Raw data. Tactile data is shown as points and numbers, which represent measurement spatial locations and measured values. • Circles. Circle centers correspond to the measurement locations; circle areas are proportional to the stiffness values; different circle colors are used for different values. • Bars. Measurement results are represented by bars, drawn normal to the object marker. Bar heights are proportional to result values. Colors from magenta to red are used to draw bars for different measured values. • Contours. Tactile data is presented as color contours. Contour borders correspond to constant stiffness values. The first three techniques are useful for visualization of small amounts of data. When more data points are accumulated, the contour technique provides better visualization of measurements. For all visualization techniques, it is possible to toggle and adjust transparency of computer-generated objects in order to avoid occlusion of the real-world objects. Generation of contours is based on a texture interpolation algorithm. A triangular mesh with vertices at the measurement points is created using Delaunay triangulation. Coordinates of a one-dimensional color texture (gradation strip) are specified at vertices of the triangular mesh. A contour picture is formed by texture interpolation inside each triangle. If B-spline approximation is used, then a triangular mesh is generated on the basis of control points, and geometry and stiffness values are interpolated for triangle vertices. The contour map is rendered to texture memory using orthographic projection. Then, the contour map texture is applied to the approximated geometric surface, which is rendered using perspective projection with predetermined camera parameters. Fig. 4 illustrates the rendering procedure for visualization of tactile information on an object surface.
4.3 Example of Visualization Our augmented-reality visualization has been programmed in the C++ language. The OpenGL graphics library and ARToolkit marker tracking library are used for real-time visualization of tactile data.
Frame buffer Figure 4: Rendering procedure for visualization of the tactile information on the object surface.
Around 40% of the CPU is typically ocupied during real-time measurement and visualization procedure on a notebook computer with 3.2 GHz Intel Pentium 4 processor. Fig. 5 presents an example of tactile examination using a breast cancer model. The head-mounted display with a video camera and a tactile sensor with the markers are shown in Fig. 5a. Figs. 5b,c,d respectively illustrate tactile data visualization as raw data, circles, and bars. In Fig. 5e data is represented as a contour plot based on Delaunay triangulation. Because of small number of points, the contour picture is not smooth. Contours produced with B-spline surface and data approximation are shown in Fig. 5f.
5
CONCLUSION
An augmented-reality system for support of tactile examination and for visualization of tissue stiffness data has been developed. Visual tracking of two markers, attached to the examined human organ and to the tactile sensor, is used. The object marker allows derivation of transformation matrices for augmentation of real-world video by computer generated information. The sensor marker helps to register spatial positions of the tactile sensor during measurements. Several visualization techniques are employed for AR presentation of tactile data. Simple data representations can be used for small quantities of data. When enough data is accumulated, the measured stiffness values are approximated by multi-level B-splines and depicted as contours projected on the human organ.
95
GRAPP 2007 - International Conference on Computer Graphics Theory and Applications
a
b
c
d
e
f
Figure 5: Snapshots of sensing breast cancer model: a) head-mounted display with a video camera and a tactile sensor with the markers; b) raw stiffness data; c) circles; d) bar representation; e) contours based on Delaunay triangulation; f) contours generated with B-spline approximation.
96
USING AUGMENTED REALITY FOR REAL-TIME VISUALIZATION OF TACTILE HEALTH EXAMINATION
The developed augmented-reality system has been tested on a breast cancer model and in experiments with internal animal organs. The correct combination of virtual objects with real-world video at reasonable frame rates with acceptable picture delay have been confirmed. While hand palpation implies involvement of a highly qualified physician, it is possible to imagine that the developed AR system could be used for remote diagnosis since it does not require high medical skills. A video demonstrating the use of the system is available at http://www.u-aizu.ac.jp/ niki/research/ar/.
Omata, S. and Terunuma, Y. (1992). New tactile sensor like the human hand and its applications. Sensor and Actuators A, 35: 9–15. Rosenthal, M., State, A., Lee, J. et al. (2002) Augmented reality guidance for needle biopsies: an initial randomized, controlled trial in phantoms. Medical Image Analysis, 6: 313–320. Sakas, G. (2002) Trends in medical imaging: from 2D to 3D. Computers and Graphics, 26: 577–587. Srikanchana, R., Wang, Y.J., Freedman, M.T. and Nguyen, C.C. (2002). Tactile imaging of palpable breast cancer. Medical Imaging 2002: Physics of Medical Imaging (L.E. Antonuk, M.J. Yaffe Eds.), Proc. SPIE, 4682: 792–800.
REFERENCES ARToolkit, http://www.hitl.washington.edu/artoolkit/. Azuma, R.T. (1997) A Survey of Augmented Reality. Teleoperators and Virtual Environments, 6: 355–385. Bajura, M., Fuchs, H. and Ohbuchi, R. (1992) Merging virtual objects with the real world: Seeing ultrasound imagery within the patient. Computer Graphics, 26: 203–210. Balasingham, I., Samset, E., Hansen, A. and Audral L. (2003) An interactive augmented reality 3D visualization system for destroying liver tumor using cryoablation. International Congress Series, 1256: 690–695. Birkfellner, W., Figl, M., Huber, K. et al. (2002) A headmounted operating binocular for augmented reality visualization in medicine: design and initial evaluation. IEEE Trans Medical Imaging, 21: 991–997. Das, M., Sauer, F., Schoeph, U.J. et al. (2006) Augmented reality visualization for CT-guided interventions: system description, feasibility and initial evaluation in an abdominal phantom. Radiology, 240: 230–235. Girnyk, S., Barannik, A., Barannik, E. et al. (2006). The estimation of elasticity and viscosity of soft tissues in vitro using the data of remote acoustic palpation. Ultrasound in medicine and biology, 32: 211–219. Kaufman, C.S., Jacobson, L., Bachman, B.A. and Kaufman, L.B. (2006). Digital documentation of the physical examination: moving the clinical breast exam to the electronic medical record. The American Journal of Surgery 192: 444-449. Kearney, T.J., Airapetian, S. and Sarvazyan, A. (2004). Tactile breast imaging to increase the sensitivity of breast examination. Journal of Clinical Oncology, 2004 ASCO Annual Meeting Proceedings, 22: 1037. Konishi, K. et al. (2005) Augmented reality navigation system for endoscopic surgery based on threedimensional ultrasound and computed tomography: Application to 20 clinical cases. Int. Congress Series, 1281: 537–542. Lee, S., Wolberg, G. and Shin, S.Y. (1997) Scattered data interpolation, IEEE Trans. on Visualization and Computer Graphics, 3: 228–244.
97