Michel Abdul-Massih, Bedrich Beneš, Tong Zhang, Christopher Platzer,. William Leavenworth, Edwin R. Garcıa, and Zhiwen Liang. Purdue University. Abstract.
Augmenting Heteronanostructure Visualization with Haptic Feedback Michel Abdul-Massih, Bedˇrich Beneˇs, Tong Zhang, Christopher Platzer, William Leavenworth, Edwin R. Garc´ıa, and Zhiwen Liang Purdue University
Abstract. We address the need of researchers in nanotechnology who desire an increased level of perceptualization of their simulation data by adding haptic feedback to existing multidimensional volumetric visualizations. Our approach uses volumetric data from simulation of an LED heteronanostructure, and it translates projected values of amplitude of an electromagnetic field into a force that is delivered interactively to the user. The user can vary the types of forces, and they are then applied to a haptic feedback device with three degrees of freedom. We describe our methods to simulate the heteronanostructure, volume rendering, and generating adequate forces for feedback. A thirty one subject study was performed. Users were asked to identify key areas of the heteronanostructure with only visualization, and then with visualization and the haptic device. Our results favor the usage of haptic devices as a complement to 3-D visualizations of the volumetric data. Test subjects responded that haptic feedback helped them to understand the data. Also, the shape of the structure was better recognized with the use of visuohaptic feedback than with visualization only.
1
Introduction
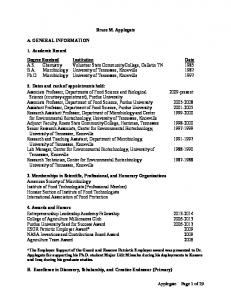
Multidimensional data visualization has been addressed by the computer graphics community for a very long time. The traditional way to visualize such data is by limiting the rendering into the 3-D space and by substituting higher dimensions with visual clues, such as color, glyphs, or other geometry. However, some data sets are suitable for different approaches. Those from physics simulations are one kind, where electromagnetic fields or forces come into play. Rendering the forces directly as forces using haptic devices is intuitive. Haptic rendering offers a physical level of interaction between the real and virtual realms. It requires special devices (such as the Falcon device in Figure 1) that translate the data into mechanical energy to provide tactile interaction [1]. Although visualization is one-directional, the use of haptic feedback-capable devices enables a bidirectional interaction to be achieved [2]. LED technology has been growing in popularity in recent years, but several roadblocks have prevented its advancement in efficiency and spectral emission. They include nucleation, phase segregation, and piezoelectric and spontaneous
polarization fields. Nanotechnology researchers are trying to engineer the quantum well geometry of these heteronanostructures to suppress their built-in electric fields. We hypothesize that using haptics for heteronanostructure visualization will significantly increase the user’s perception and understanding of complex structures the human eye might miss. We assume that users will be able to more easily identify electric field intensities in the heteronanostructure with the addition of a haptic device’s force feedback. The focus of our research is to create an application that will provide visuohaptic feedback and to test whether users will find visual feedback complemented with haptic feedback more useful than purely visual feedback Fig. 1. The Falcon haptic dein the task of finding key areas of an LED het- vice used in our testing. eronanostructure’s electric field. Our application addresses both experts in the field and novice users, such as students of material science.
2
Previous Work
The need for broadening perceptual experience beyond visual clues has been identified in [3], and the same work addresses several challenges that must be overcome, such as real-time processing and much higher update rates (1kHz). Existing haptic devices allow humans to receive information from three translational directions, but certain applications require six degrees of freedom (DOF) [4]. However, 6-DOF haptic rendering is significantly harder [5] because all contact surfaces must be detected instead of stopping at the first detection. Calculating a reaction force and torque at every point is expensive at the high refresh rate, and the same may be said about controlling geometry-driven haptic instability, such as forcing the object into a narrow cavity. [6]. Beyond the common problems of haptic devices, there are specific issues when simulating objects at the micro- and nanoscales. Pacoret et al. [7] allowed the user to feel Brownian motion when doing micromanipulation with optical tweezers. Marliere et al. [8] added multisensorial interaction (seeing, hearing, and feeling) to an Atomic Force Microscope’s (AFM) manipulation of nano objects. A 1-DOF haptic device was used for the manipulation, and simulated forces were returned to it, closing the loop between human movements and the actual physical forces being generated. Sitti et al. [9] concentrated on nanomanipulation with AFM for 1-D and 2-D manipulations. They proposed new strategies for 3D handling, e.g., picking and placing atoms. They later refined the method for giving force feedback based on nanoscale objects in [10]. Because the purpose is to remotely manipulate atomic objects, forces that are incorrectly rendered can damage the experimental samples. The above-mentioned research seeks to
simulate real physical interactions. In our work, we focus on using force feedback to convey information that exists inside volumetric data. Different approaches are available for using haptics with volumetric data. Laehyun et al. [11] focused on a haptic rendering technique that uses hybrid surface representation. The geometric data provides the basic 3-D structure of the object, and the implicit data are mapped around the exterior of the object to provide a simulated tactile response. McNeely et al. proposed a method to manipulate a complex rigid object within an arbitrarily complex environment of rigid objects [6]. Their approach uses collision detection based on probing a voxelized environment with surface point samples. Durbeck et al. [12] integrated a haptic device with general-purpose scientific visualization software. Using their Sensable Phantom Classic hardware, they were able to receive force feedback on a 3-D vector field. Ikits et al. used directional constraints for guiding the user through volumetric data [13]. They proposed constraining the tool proxy along streamlines in a vector field and adding force to represent magnitude and tick marks to represent speed. The main contribution of our work is the actual evaluation and user study performed that attempts to quantify the effect of haptic on the final perception. In the next section we briefly describe the nanorod simulation, the data structures used, its visual rendering, and the haptic feedback. Section 5 describes our implementation and results of the tests. Section 6 concludes the paper and discusses some potential issues for future work.
3 3.1
Method Nanorod Simulation
(In, Ga)N nanostructures show great promise as the basis for next-generation LED lighting technology because they offer the possibility of directly converting electrical energy into light of any visible wavelength without the use of downconverting phosphors. An LED is a solid-state device (Light Emitting Diode) that transforms current into light by confining electrons and holes into a well where they recombine into photons. An heterostructure is a system made of two or more dissimilar semiconducting materials that when put into contact will create a transition region (a depletion zone) where electrons will have to perform electrical work to cross in one direction, and will be favored to go when injected in the opposite direction. In this context, an LED heteronanostructure is a system conformed of two semiconducting materials whose dimensions are on the order of 10s of nanometers in size. In this work, 3-D calculations of the mechanical and electrical equilibrium states in out-of-the-box nanoheterostructures with pyramidal caps, a geometry not very commonly assembled, demonstrate that by tuning the quantum well to cladding layer thickness ratio, hw /hc , a zero built-in electric field can be experimentally realized, especially for hw /hc = 1.28, in the limit of large hc values [14]. In [14] it was found that the (In, Ga)N system naturally grows this
structure under the right conditions and promises to deliver efficiencies that would be unattainable through the traditional thin film geometry. Traditionally, LEDs are fabricated as thin films or mesas. Simulation of the nanorod structure was carried out over a duration of 47 hours on a supercomputer system equipped with Red Hat Enterprise Linux 5 and 128 GB of RAM. A resulting mesh of 150 × 150 × 150 elements was generated. Each element carries multiple values; one is the electric field defined as E = (Ex , Ey , Ez ), and the other is a stress tensor σxx σxy σxz σ = σyx σyy σyz , σzx σzy σzz from which the hydrostatic stress is calculated as σh = 1/3(σxx + σyy + σzz ). We have performed various visualizations of the 3-D volumetric data, such as individual components of σ or E. In all, the haptic feedback was generated from the magnitude of the electric field: q E = |E| = Ex2 + Ey2 + Ez2 . (1) For this application, the electric field is extremely important to visualize because ideally, a zero electric field in this structure is desired in order to have the greatest chance for the electrons and holes in the pyramid to find each other and react into a photon. A non-zero electric field shifts electrons into opposite sides in the thin film cap, making it less likely for the recombination of electrons and holes into light to take place. The electric field in a thin film is around 2M V /cm, while in the equivalent nanorod it reaches only 0.5M V /cm. 3.2
Volume Rendering
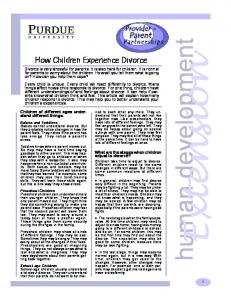
We have used volumetric ray casting to visualize the 3-D volumetric array from the previous section. Ray casting for the nanorod was carried out on a massive parallel processor (NVIDIA GeForce GTX 480) using CUDA to achieve interactive performance. The step size used for sampling along the ray cast from each screen pixel was one voxel, and we used trilinear interpolation for sampling. The transfer function used for converting electric field magnitudes to color was a gradient that made a transition from blue to red, and the function was given to us by researchers in physics. The volume rendering is constrained to the interior of the nanorod’s geometry, and several examples are shown in Figure 2. 3.3
Haptic Feedback
Haptic feedback is generated by processing the magnitude of the nanorod’s electric field (1) at the user’s desired location with a force transfer function f = F (E)
(2)
(a)
(b)
(c)
Fig. 2. (a) Volumetric rendering of the nanorod’s field with the haptic cursor displayed as a sphere, (b) top view of the nanorod, and (c) shows a cut through the nanorod showing the intensity of the electric field mapped to a color variation.
which converts E = |E| into a force f that is rendered through the haptic device. A 3DOF translation device was chosen for implementation of the nanorod’s electric field haptic feedback. A visual proxy object represents the location of the haptic device inside the virtual world (Figure 2a)). The value of the nanorod’s electric field at the proxy’s position is sampled using the nearest neighbor interpolation. The continuous haptic loop consists of the aforementioned steps at a minimum 1kHz, providing the perception of different types of forces. 3.4
Forces
Three types of haptic feedback were used to try conveying the nanorod’s electric field information: vibration, stiffness, and stiffness with vibration. Note that the equations below omit constants necessary to accommodate the range of values of the haptic device to the range of values of the nanorod simulation. Force type 1: presents the user with a vibration. The term F from (2) is evaluated as a function of a small random vector r and a sinus wave by which amplitude and frequency are modulated by E giving f 1 = rE sin(Eω).
(3)
We have used a fixed frequency ω = 50Hz in our implementation. The function (3) yields less vibration amplitude for the low magnitudes of E and more for the high magnitudes. Force type 2: gives the user a better understanding of the nanorod’s shape. The force vector is damping, and it acts in the opposite direction of the user motion v with a strength proportional to the intensity of the electric field. f 2 = −vE.
(4)
The force is proportional to the force with which the user is moving the device’s tool. Therefore this force feedback creates the effect of a surface being touched
on the boundaries with high gradient E. These are well articulated on the edges of the nanorod and in the proximity of the quantum well. Force type 3: The last type of force is a combination of the vibration and the damping. The objective of this feedback is to try to convey shape and highand low-magnitude locations in the electric field at the same time. f 3 = f 1 + f 2.
4
(5)
Assessment and Experiment
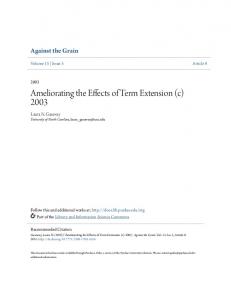
Traditional methods of perceptualization follow the top path of Fig. 3, but our implementation includes haptic feedback in parallel with this, adding another layer of interaction between the user’s senses and the simulation. Our hypothesis is that by adding haptic feedback to a volumetric heteronanostructure visualization, the user will more easily perceive the high magnitudes and the structure’s shape in the simulation environment. By adding another level of complexity, the result could be that the user is overwhelmed with information; thus the haptic device would essentially become useless. To assess the effectiveness of our implementation, a series of tests were formulated and carried out. A set of questions in the form of a questionnaire (see Appendix) was given to a random sample of subjects with no prior exposure to haptic devices and no Fig. 3. Perceptualization model. prior knowledge of the heteronanostructure. The experiment was carried out for one week, and a total of 31 participants were tested (16 males and 15 females, average age 22). All subjects were students of different (technical and nontechnical) areas from a large university. They were first introduced to the haptic device by interacting with a Chai 3-D demo application [15], which demonstrated the various methods of force feedback that the Falcon device can exert. They were then asked to visually assess the heteronanostructure using only the computer’s mouse. Once they were familiar with the structure, they were asked to assess it with only the haptic device. The questionnaire asked them to do a simple task: identify the key structural areas with both the mouse and the haptic device. They were asked to respond as indicated in the following scale: Strongly Disagree-1, Disagree-2, Neutral-3, Agree-4, Strongly Agree-5.
5 5.1
Implementation and Results Implementation
Our system is implemented in C++ and uses OpenGL for visualization, Chai 3D for haptic rendering, and CUDA for volumetric ray casting. The haptic device
used in our testing was a Novint Falcon (See Figure 1). We have performed all testing on a computer equipped with an Intel Xeon X7500 series processor, 12 GB of RAM, an NVIDIA GeForce 480 GTX graphics card with 1.5 GB of memory, and 64-bit Windows 7. The volume and haptic rendering processes are performed in separate CPU threads; however, the haptic rendering process uses data from the volume rendering. With this implementation, we achieved the following results. Haptic rendering was performed stably at approximately 1kHz. Volume rendering yielded an average of 20 fps per second with a window size 400 × 400 pixels. The most timedemanding operation of the implementation was the trilinear interpolation, and the frame rate could be affected by the step size of the ray casting. 5.2
User Study
To analyze the results, we performed two-tailed paired t-tests between specific questions to compare the average difference of the user’s rankings to purely visual feedback and visouhaptic feedback (see Table 3). The questionnaire used for our testing can be found in Appendix A. Ground Truth (bottom) Ground Truth (middle) Method Similar? Q No. Conf. Interval Similar? Q No. Conf. Interval Visual Y Q1 [2.94, 3.83] Y Q2 [1.89, 2.76] Force 1 N Q4 [2.24, 3.17] Y Q5 [2.41, 3.27] Force 2 Y Q6 [2.80, 3.83] N Q7 [2.84, 3.87] Force 3 Y Q8 [3.07, 4.09] N Q9 [3.41, 4.32] Table 1. Statistical comparison and analysis of the visual and haptic feedback.
Table 1 shows a comparison of the conclusion obtained from the results of the user tests and the ground truth (real values from the data) of the magnitude measured at the bottom and middle parts of the nanorod. For example, the visual feedback and the haptic feedback with forces 2 and 3 were perceived as similar to the ground truth for the lower part of the nanorod. Another example from the same table shows that Force 2 and the ground truth for the middle of the structure are different. The reason is that the middle part of the structure does not present a high magnitude of the electric field. The table also includes the number of the corresponding question (see Appendix) and the Confidence Interval for the mean value of the responses to each specific question. From visual examination, users generally were able to correctly conclude that there was a high-magnitude field at the bottom of the cone and a lowmagnitude field at the middle. Using Forces 1, 2 and 3 in general, users correctly concluded one of the two questions. For Force 1, the average conclusion was that there was a low field regardless of the position being tested. This might be because the vibrations felt weaker than the damping force, and even though there were high and low vibration amplitudes, users perceived them both as
lower than the damping and ranked any magnitude as a low magnitude. On the other hand, when testing Forces 2 and 3, users generally concluded that a high magnitude field was at both the base and middle locations. Users’ written comments strongly suggested that that problem lay in the difficulty of visually finding the middle of the cone because the depth of the tool proxy could not be perceived well inside the volumetric data. Table 2 shows a similar comparison to the previous table regarding the shape of the top of the nanorod. Results from visuohaptic feedback inclined toward the correct answer (that the top of the cone is curved and not pointed), but those from only a visual inspection were wrong. Ground Truth (top) Method Similar? Q No. Conf. Interval Visual N Q3 [3.74, 4.58] Haptic Y Q10 [2.61, 3.52] Table 2. Visual versus haptic results.
From question 11, the conclusion can be made that users are not sure if the strictly visual approach would be preferred for analyzing volumetric data with µ = 2.97 σ = 1.28 and a confidence interval [2.52, 3.41]. Most important, users agreed that the haptic device helped them to understand the high- and low-field areas of the data with µ = 3.61 σ = 0.92 and a confidence interval [2.29, 3.93]. Table 3 shows the results of t-tests done for determining if there is a significant difference between pairs of questions concerning visual feedback versus haptic feedback. We can see that there is significant difference between four pairs of questions and no significant difference between three pairs. No significant difference exists between force 2, 3 and visual feedback when evaluating the base of the cone. No significant difference exists when looking at the middle of the cone and using force 1. There is a significant difference between visual feedback and force 1 for the base of the cone. Also, between visual feedback, force 2 and 3, a significant difference can be seen when evaluating the middle of the cone. Finally, there is significant difference in the responses concerning the top of the cone in which haptic feedback aided in concluding that the top of the structure is actually curved.
6
Conclusions and Future Work
We have presented an implementation of a system for visuohaptic rendering of force feedback via a haptic device, which complements the visual rendering of a heteronanostructure’s electric field. Our approach translates the magnitude at the approximate position of the proxy within the volumetric dataset into a force. This force is then rendered via a haptic feedback device. A user study was conducted to evaluate the effectiveness of our implementation. Test subjects’
Summary Avg. Difference t-test p-value Significant Difference? Q1 vs Q4 0.67 t(30)=2.46 0.020 Y Q1 vs Q6 0.06 t(30)=0.22 0.825 N Q1 vs Q8 -0.19 t(30)=0.64 0.526 N Q2 vs Q5 -0.51 t(30)=1.55 0.132 N Q2 vs Q7 -1.03 t(30)=3.16 0.003 Y Q2 vs Q9 -1.54 t(30)=5.36 0.000 Y Q3 vs Q10 1.09 t(30)=3.51 0.001 Y Table 3. Questionnaire analysis.
responses were recorded and statistically analyzed to determine significance of the difference between the average rankings given to visual feedback and haptic feedback of three specific zones of the volumetric data. This analysis showed that our implementation of haptic feedback was beneficial in assisting users to more accurately identify key areas within the heteronanostructure and to better understand the shape of the nanorod. There are possible avenues for future work. The position of the proxy was difficult for some users to discern because of the represented depth. Different views of the structure might help to alleviate this issue. A more rigorous test of future implementations to obtain greater statistical significance will be done. In conclusion, datasets from the original simulation other than just the electric field will be used to permit the user, for example, to see the electric field while touching geometry and to interpret temperature as force or as being guided through electric field streamlines.
References 1. Avila, R.S., Sobierajski, L.M.: A haptic interaction method for volume visualization. In: Proceedings of the 7th conference on Visualization ’96. (1996) 197–204 2. Salisbury, K., Conti, F., Barbagli, F.: Haptic rendering: Introductory concepts (2004) 3. Colgate, J.E., Brown, J.M.: Factors affecting the z-width of a haptic display. In: IEEE Conference on Robotics and Automation. (1994) 3205–3210 4. Gregory, A., Mascarenhas, A., Ehmann, S., Lin, M., Manocha, D.: Six degree-offreedom haptic display of polygonal models. In: Proceedings of the conference on Visualization ’00. VIS ’00, Los Alamitos, CA, USA, IEEE Computer Society Press (2000) 139–146 5. Ogawa, Y., Fujishiro, I., Suzuki, Y., Takeshima, Y.: Designing 6dof haptic transfer functions for effective exploration of 3d diffusion tensor fields. In: Proceedings of the World Haptics 2009 - Third Joint EuroHaptics conference and Symposium on Haptic Interfaces for Virtual Environment and Teleoperator Systems, Washington, DC, USA, IEEE Computer Society (2009) 470–475 6. Mcneely, W.A., Puterbaugh, K.D., Troy, J.J.: Six degree-of-freedom haptic rendering using voxel sampling. In: Proc. of ACM SIGGRAPH. (1999) 401–408
7. Pacoret, C., Bowman, R., Gibson, G., Haliyo, S., Carberry, D., Bergander, A., Rgnier, S., Padgett, M.: Touching the microworld with force-feedback optical tweezers. Opt. Express 17 (2009) 10259–10264 8. Marliere, S., Urma, D., Florens, J.L., Marchi, F.: Multi-sensorial interaction with a nano-scale phenomenon : the force curve. Computing Research Repository (2010) 9. Sitti, M., Aruk, B., Shintani, H., Hashimoto, H.: Scaled teleoperation system for nano-scale interaction and manipulation. Advanced Robotics 17 (2003) 275–291 10. Sitti, M., Hashimoto, H.: Teleoperated touch feedback from the surfaces at the nanoscale: modeling and experiments. IEEE-ASME Transactions on Mechatronics 8 (2003) 287–298 11. Kim, L., Kyrikou, A., Desbrun, M., Sukhatme, G.: An implicit-based haptic rendering technique. In: In Proceeedings of the IEEE/RSJ International Conference on Intelligent Robots. (2002) 12. Durbeck, L.J.K., Macias, N.J., Weinstein, D.M., Johnson, C.R., Hollerbach, J.M.: Scirun haptic display for scientific visualization. In: Proc. Third Phantom Users Group Workshop, MIT RLE Report TR624, Massachusetts Institute of Technology, MIT (1998) 13. Ikits, M., Brederson, J.D., Hansen, C.D., Johnson, C.R.: A constraint-based technique for haptic volume exploration. In: Proceedings of IEEE Visualization ’03. (2003) 263–269 14. Liang, Z.: Simulation and Design of (In,Ga)N-Based Light Emitting Diodes. PhD thesis, Purdue University (2011) 15. Chai3D: http://www.chai3d.org/. WWW (last accessed May 2011)
Appendix