ICAS 2012 : The Eighth International Conference on Autonomic and Autonomous Systems
Augmenting Reinforcement Learning Feedback with Prediction for Autonomic Management Khandakar Rashed Ahmed
Raphael Bahati
Michael Bauer
Department of Computer Science The University of Western Ontario London Ontario, Canada, N6A5B7
[email protected]
Department of Computer Science The University of Western Ontario London Ontario, Canada, N6A5B7
[email protected]
Department of Computer Science The University of Western Ontario London Ontario, Canada, N6A5B7
[email protected]
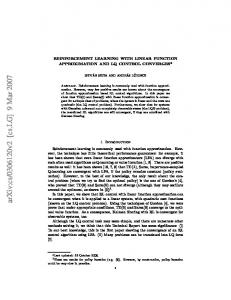
I. INTRODUCTION Autonomic systems are commonly conceived around the notion of a feedback loop, usually involving monitoring, analysis, planning and execution [1]. In some cases, this process may involve a learning component [2-6] which can enable an autonomic manager to adapt aspects of its behavior over time, e.g., to “learn” which actions are better than others in certain situations. Some of our previous work investigated the role of reinforcement learning [7, 8] as a key element in a policybased system for autonomic management. Policies are often used to specify the required or desired behavior of a system and its applications. In autonomic systems, policies have been used as the basis for the management system to adjust application or system tuning parameters in order to meet operational requirements [2, 7], i.e., the policies are used to drive the feedback needed to change the system’s behavior. When these policies are violated, the autonomic management system tries to identify the actions needed to take based on the policies or, in some cases, based on the past behavior of the system. That is, the management system may incorporate some sort of learning in order to enhance the decisions. The general model of the approach is illustrated in Figure 1. The autonomic management system makes adjustments to the system being managed. Actions taken by the management system and values of
Copyright (c) IARIA, 2012.
ISBN: 978-1-61208-187-8
Autonomic Management System
Adjustments to System
clients
Managed System
Possible Actions
Keywords-autonomic management, prediction, policies, reinforcement learning.
metrics are used by a learning component to determine the best actions in the future.
policies
Abstract—Autonomic management depends on a feedback loop between the managed system and the autonomic manager. Adding a learning component to the autonomic manager introduces a second feedback loop – between the manager and the learning agent. In this paper, we describe a policy-based autonomic manager that makes use of a reinforcement learning agent. The reinforcement learning model is based on a state-transition model formed from an active set of policies and the actions of the manager. Based upon this model, this paper describes approaches for prediction of potential policy violations and examines the accuracy of the prediction approaches. Experimental results show that a prediction approach based on the likelihood of a violation performs better than a non-prediction approach and has a positive impact on avoiding policy violations.
Learning Agent
Figure 1. Feedback Loops for Autonomic Manager with Learning Agent
In this paper, we consider how prediction might be considered in the context of such feedback control. Our approach to reinforcement learning entails the construction of a “state model” based on an active set of policies. In this case, the “state model” does not directly correspond to the states of the managed system, but rather captures the states representing the “health” of the system as dictated by the active set of policies. In the simplest form, such a state may indicate that the system is “OK” or “not OK”, i.e., has or has not violated a policy. Using this “state model” we look at approaches to prediction – one based on predicting a future state and one predicting whether the system will be “unhealthy”, i.e., in any “unhealthy state”. We describe the approach and report on results of experiments for a system incorporating prediction. II. RELATED WORK A variety of different approaches to prediction in network and system management have been explored. Most of the techniques have dealt with prediction of faults or prediction of resource usage. A fuzzy logic controller prediction method was in [9] to predict computational demand in a utility computing environment. The probabilistic framework of a Bayesian network has been used to do prediction in several research studies
74
ICAS 2012 : The Eighth International Conference on Autonomic and Autonomous Systems
[10-12]. The work in [10], for example, tries to predict network anomalies that typically precede a fault. Specifically, the authors propose an approach to predict node failure. The intelligent agent learns the normal behavior of each measurement variable and combines the information into a Bayesian network. Work in [12] also used a Bayesian based algorithm to predict disk failures, while in [13], a specific analytical method is developed for fast detection of faults in I/O systems. Some approaches have looked at data mining and learning approaches learn and classify failure patterns as rules from historical data rather than generating probabilistic models ahead of time [14-16]. Sahoo, et al. applied association rules to predict failure events in a 350-node IBM cluster [17]. Meta-learning [14, 16] methods have been investigated to explore the merits of combining various data mining techniques. The use of reinforcement learning in autonomic management [3-5, 7] has also attracted significant interest. Our work is similar to work that makes use of probabilistic approaches. The key difference in our work from other work in the autonomic area is that we incorporate prediction based on the learned model. Our work also differs in that our reinforcement learning model uses “policy” states rather than “system” states. III. MODEL OF REINFORCEMENT LEARNING A policy-based management system has been developed by Bahati [7] where reinforcement learning is used to determine the best use of a set of active (enabled) policies to meet different performance goals. The learning approach is based on the analysis of past experience of the system and the learning model is used to train the system to dynamically adapt the choice of actions for adjusting application and system tuning parameters in response to policy violations. Reinforcement learning is a learning paradigm [19-20] where an agent learns how to best map situations to actions through trial and error interaction with its environment. It uses a “reward and punishment” approach, where, for each action, a numeric reward is generated by the agent which indicates the desirability of the agent being in a particular state. The only way to maximize this reward is to discover which action generates the most reward in a given state by trying them. The learning agent must also consider a trade off between whether it should use its current knowledge to select the best action to take (exploit) or to try new, untried, actions (explore) in order to improve its performance. We assume that policies are used to specify desired behavior and are of the form of event-triggered, condition-action rules [7]. An event triggers the evaluation of a rule of the form “if [conditions] then [actions]”. An event is generated when some condition about the state of a system becomes true. The appropriate action is chosen from the policy specification for that
Copyright (c) IARIA, 2012.
ISBN: 978-1-61208-187-8
event. A policy consists of one or more conditions and an ordered list of actions which can be used by the management system to make adjustments to system tuning parameters. Table 1 illustrates examples of polices; these form the basis for the discussion in this paper. In Table 1, p1 illustrates a policy where different actions can be taken when the Apache response time (ART) is greater than 2000 ms and the trend of the response time (ARTT) is increasing. Action a1, for example, indicates that the limit on the maximum number of active Apache clients should be increased by 25. TABLE 1. EXAMPLES OF POLICIES
p1: If Apache’s response time (ART) > 2000ms and the trend of the Apache response time (ARTT) ) > 0, then a1: Increase MaxClients by 25, or a2: Decrease MaxKeepAliveRequests by 30, or a3: Decrease MaxBandwidth by 128 p2: If Apache’s response time < 250 ms, then a4: Decrease MaxClients by 25, or a5: Increase MaxKeepAliveRequests by 30, or a6: Increase MaxBandwidth by 64
The following introduces a number of key terms and concepts related to how we model learning; a more detailed and formal description can be found in [7]. A policy p is a pair , where C is a finite set of conditions, C = c1, . . . , cm, and A = a1, . . . ak is an ordered set of actions. Each condition, ci ε C, is defined by a tuple ci = , where metricName is the name of a metric measured/monitored by the management system, operator is a relational operator, and , is a constant threshold value. The set of active policies at any time within the management system is then P = {p1, . . . , pn}. To model the dynamics of the environment from an active set of policies, we define a set of states whose structure is derived from the metrics associated with the active policies. The set of metrics that must be monitored to support an active set of policies P = {p1, . . . , pn} is then M = {m1, . . . , mt}, such that: pj = ε P, M = ci ε Cj {ci. metricName}. The set M is the set of all metrics occurring in any of the active policies. For each metric in this set, there are a finite number of threshold values to which the metric is compared; these can be ordered to form “regions”. For each metric mi ε M, let the set σmi = {1, 2, . . ., k} be the set of thresholds from the conditions associated with metric mi, such that, i, < j, if i < j. Then, σmi induces a set of metric regions associated with metric mi: Rmi = {R1mi , R2mi , . . . , Rk+1mi}, where R1mi= (-∞, 1), R2mi = (1,2 ), etc., and Rk+1mi = (k, ∞).
75
ICAS 2012 : The Eighth International Conference on Autonomic and Autonomous Systems
In essence, for any metric, a measured value of the metric can be mapped uniquely onto one of the regions (i.e., intervals) as defined by the thresholds of the policy conditions. For example, if σmi = {1, 2}, then there would be three regions: R1mi = (-∞, 1), R2mi = (1, 2 ), and R3mi = (2, ∞). We also define a weighting function f over metrics and their regions where f(Rjmi ) → R, which assigns a numeric value to the jth region, Rjmi , such that, f(Rjmi ) > f(Rkmi), if k < j. An example of such a mapping, which we make use of in our current implementation, is defined by: f(Rjmi ) = 100 - (100/(n - 1)) x (j - 1), where n is the total number of regions in Rmi. This function assigns a numeric value between 100 and 0 for each metric's region in Rmi , starting from 100 for the most desirable region and decrementing at equal intervals towards the opposite end of the spectrum, whose region is assigned a value of 0. Here we assume that the smaller the values of f(Rjmi ) are more desirable, though in general this is not a necessary requirement. The idea is that regions of greater “desirability”, i.e., preferred quality of service, are assigned higher values. Table 2 illustrates the metrics and their regions from the example policies of Table 1. TABLE 2. METRIC AND REGION FROM SAMPLE POLICIES
Metric
Condition
Region
m1: ART
ART < 250.0 ART > 2000.0
R1m = (-∞, 250.0) 1
R2m = (250.0, 2000.0) 1
R3m = (2000.0, 250.0)
f(Rjm ) i
100 50 0
Rrjmj = (1, 2 ), where 1 < valuej < 2 , i.e., the region of mi in which the measured value valuej falls. Essentially, each state has a unique region from each metric of M along with a measured value of that metric, i.e., for a set of policies with n metrics, each state would have n metrics { m1, m2, . . . , mn} and for each of those metrics there would be a single metric region. μ defines the “health” of the state, that is, is either “violation” or “acceptable” depending, respectively, on whether or not there are any policies violated when visiting this particular state.
Transitions are determined by the actions taken by the management system and labeled by a value determined by the learning algorithm. A state transition, ti(sp, ap, sc), is a directed edge corresponding to a transition originating in state sp and ending at state sc as a result of taking action ap while in state sp and is labeled by , where
is the frequency (i.e., the number of times) the transition has occurred and Qti(sp, ap) is the action-value estimate from the reinforcement learning algorithm associated with taking action ap in state sp. In our current implementation, this value is computed using a one-step Q-Learning [20] algorithm which has been described elsewhere [7]. For a set of active policies, P, the state-transition model can be defined by the graph GP = , where S is a set of states and T is a set of state transitions. The construction of states and transitions is naturally done at run-time (i.e., on-line) and not a priori given an active set of policies (though, this could be done). In practice, many of the states may never occur, thus keeping the size of the model manageable. [a3, 53, 89.70]
1
m2: ARTT
ARTT > 0.0
R1m = (-∞, 0.0) 2
R1m = (0.0, ∞)
100 0
2
The key role of these regions is that they partition the space of values that a metric can take on with respect to the thresholds in conditions involving that metric. We use these to define a state within our model. A set of active policies, P, with metrics M, derives a set of states S = {si}, where si = , where: P(si) is the set of policies that were violated when the system was in state si. A(si) is the set of actions associated with the policies in P(si), plus the γ-action, representing the “null” or “no-op” action. M(si) is the set {(value1, Rr1m1 , f(R r1m1)), . . . , (valuen, Rrnmn, f(Rrnmn))), where valuej is the observed measurement of metric mj or its average value when state si is visited multiple times and
Copyright (c) IARIA, 2012.
ISBN: 978-1-61208-187-8
S1
S3
[a1, 21, 23.34] [a0, 10, 10.05]
S0
[a3, 11, 13.78] [a0, 20, 33.45] [a0, 22, 39.71]
[a2, 30, 44.45]
S2
S4 [a0, 40, 53.45]
Figure 2. State Graph
Figure 2 shows several states, and for each transition the action taken, the number of times that action was taken, and a reward value as determined from the learning algorithm. Action a0 represents the “null” action, that is, no action was taken, but the system moved from one state to another (e.g., S0 to itself). State S4 (colored) is a
76
ICAS 2012 : The Eighth International Conference on Autonomic and Autonomous Systems
“violation” state. After each management cycle, the system updates the state graph information either by adding a new state or by updating the previous state information which includes an update of the transition frequency and reward value of actions. IV. PREDICTION In this section, we outline our approaches for prediction based on the state-transition model introduced in the previous section. We consider two different strategies for prediction - prediction of the next “state” within the state-transition graph and prediction of whether there might be some policy violation, i.e., move to an “unhealthy” state. The first strategy is a straightforward approach given that our model is comprised of states and transitions with frequencies of occurrences included. The latter, though, similar, originates from our specific interest in policy-based autonomic management and that the primary concern is to avoid policy violations. As a result, this strategy tries to predict the likelihood of any policy violation or not. For our current work, we decided to predict two management cycles ahead – a single cycle ahead was “too close” while two cycles ahead seemed to be a good starting point, though more might be of more interest. This means that if we are currently at management cycle t, then we will try to predict whether there will be any policy violation at management cycle t+2 by predicting which state is most likely or by predicting the likelihood of some policy being violated. As indicated, states in the reinforcement learning model contain frequency information as well as reward values generated from the learning algorithm. We further consider prediction using the frequency values (probability approach) and one based on just using reward values (reward approach). A. Probability Approach The probability is calculated from the action frequency values (from the labels of each edge in the state-transition graph). The action frequency value indicates the number of times that an action has been taken from a particular state. From the frequency values, we can compute the probability of transitioning from a state to an adjacent state and then states two transitions away. Considering Figure 2 and assuming that the system is in state S0, the probability of states two transitions away is presented in Table 3. Multiple values in a single cell of Table 3 indicate multiple paths, e.g., from S0 to S1 there are two paths and so there are two separate probability values. B. Reward Approach The reward approach only considers the action reward value (generated from the reinforcement learning algorithm) for prediction analysis. The action reward values are summed for all states on paths two transitions
Copyright (c) IARIA, 2012.
ISBN: 978-1-61208-187-8
away from the current state. These are shown in Table 3, again, assuming that state S0 is the current state. C. Predicting State When we want to predict the state, we compute the probabilities of reaching each state two transitions away. The state with the highest probability is the chosen state and depending on whether that state is a “violation” state or not determines whether the prediction indicates a violation or not. Similarly, in using reward, the sum of the reward values is used and the state reached with transitions that have the highest reward total is the state selected. In the previous example, state S4 is selected based on using probabilities and state S3 is selected based on reward values. TABLE 3. PROBABILITIES AND REWARDS FOR STATES
State (2 transitions from S0) S0 S1 S2 S3 S4
Probability
Reward
0.03 0.06 0.14 0.08 0.24 0.07 0.10 0.28
20.10 33.39 77.90 54.50 113.04 58.23 63.05 97.90
D. Predicting Likelihood of a Violation In contrast, predicting the “likelihood” of a violation involves computing a score for all “violated” states reachable in two steps from the given state. In this case, we compute a score for “not violated” and one for “violation” states. We do this by summing the probabilities or summing the rewards for states that are “not violated” and those that are “violated”. Using the probabilities and rewards from Table 3, the likelihood scores are shown in Table 4. Here, we see that using approaches based on the probabilities and on the reward suggest that there is no expected violation. This is consistent with the state graph of Figure 2. TABLE 4. PREDICTION OF FUTURE CONDITIONS
Future Condition No Violation Violation
Likelihood (Probability) 0.72 0.28
Likelihood (Reward) 420.21 97.90
V. EXPERIMENTAL RESULTS But, how accurate are these predictions? In the following, we outline experiments to evaluate the prediction approaches. A. Experimental Environment The experimental environment consists of networked workstations. A Linux workstation with a 2.0 GHz
77
ICAS 2012 : The Eighth International Conference on Autonomic and Autonomous Systems
processor and 2.0 Gigabytes of memory is used to host an Apache Web Server, the Knowledge Base and the MySQL database server. Three network workstations are used to run the traffic load tool for generating server requests. The three workstations represent load for gold, silver and bronze users and their service classes. Linux Traffic Controller (TC) Tool is used to control the bandwidth associated with the gold, silver, and bronze service classes. Thus, given a ratio of bandwidth for each of the service classes, the bandwidth is shared accordingly; for our experiments this ratio was 85:10:5. A tuning parameter MaxBandwidth determines bandwidth which needs to be assigned to each service class. Apache Jmeter is used as a traffic load generator. The Jmeter application runs in each of the workstations where each has a dynamic load testing plan. All workstations generate traffic load using the same plan. The load plan contains dynamic requests which create situations where the system resource usage is increased at significant rate. B. Prediction Accuracy Experiments were run with the above experimental environment for 1 and 4 hours. The accuracy of prediction results is present in Table 5. TABLE 5. PREDICTION ACCURACY
Approach
State (1 hour)
State (4 hours)
Violation (1 hour)
Violation (4 hours)
Probability Reward
20.00% 26.19%
3.90% 7.69%
29.62% 45.76%
29.66% 37.03%
Predicting a single state is clearly less successful that predicting the likelihood of a violation which could include multiple states. In predicting a single state, the accuracy dramatically decreases during the four hour run. This is because the size of the state graph has grown and so predicting a single state is much harder. There is a much smaller reduction in accuracy for the four hour experimental run when predicting the likelihood of a violation. It is also interesting to note that the use of the reward values for prediction proved to be more accurate in both cases than the uses of probabilities. B. Experiments with Prediction Given the evaluation of the accuracy of the prediction approaches, we decided to evaluate the likelihood approach to prediction in the context of our prototype web environment and autonomic manager. Our objective for looking at prediction was to be able to avoid policy violations, that is, if our predictive mechanism did predict that a violation was likely, then the autonomic manager could take action prior to the violation. Our approach is outlined as follows. If the prediction mechanism (probability based or reward based) predicts that a violation was likely to occur, then our prediction component would look for possible safe states and the transitions that would take the system to a safe state two
Copyright (c) IARIA, 2012.
ISBN: 978-1-61208-187-8
steps away (our consideration of what happens at management cycle t+2). The state selected is the safe state with the highest value as per the prediction computation. The algorithm determines the two actions on the transitions to that safe state from the current state. These are then passed to the autonomic manager for execution. If no safe state is available, then there are two possibilities – do nothing, i.e., let the autonomic manager rely strictly on its reinforcement learning algorithm to select an action, or have another mechanism for choosing an action. We have explored the latter [21], but details of how this works is beyond the scope of this paper. We compared the use of prediction to that of no prediction. The “no prediction” method relied on the autonomic manager and the reinforcement learning component, which performed very well in adapting the system in previous experiments [7]. Experiments were done for each of the 1hr and 4hr testing periods with traffic load varying during the test periods. Since our aim is to reduce policy violations, we counted the number of policy violations that occurred during the testing period; each experiment was run three times and the average used. The results are presented in Table 6. The existing management system encountered 77 and 280 policy violations in the 1hr and 4hr time periods, respectively. When we add prediction, the number of policy violations is reduced to 60 and 226 in the 1hr and 4hr time periods. TABLE 6: POLICY VIOLATIONS: WITH AND WITHOUT PREDICTION
Approach Reinforcement Learning (Existing) Prediction: Likelihood of Violation (Probability) Prediction: Likelihood of Violation (Reward)
Policy Violations (1 hour) 77
Policy Violations (4 hours) 280
62
220
61
226
Using prediction resulted in approximately a 20% reduction in the number of policy violations encountered in both the one hour and four hour test periods. VI. CONCLUSIONS AND FUTURE WORK Given the results, it is clear that our prediction technique should only predict whether a policy violation is likely to occur or not, rather than trying to predict a state. The results of prediction with the reinforcement learning resulted in useful feedback to the autonomic manager with experimental results showing roughly a 20% improvement in the number of violations encountered. This result is a little surprising in that the accuracy of the likelihood prediction approach was only around 38% for the reward approach and 30% for the
78
ICAS 2012 : The Eighth International Conference on Autonomic and Autonomous Systems
probability approach (4 hour test period). Would this continue for a longer test period? If the prediction accuracy was increased, would the improvement in the number of violations continue? These are future areas of study. There are, of course, a number of other areas for exploration, the obvious being to consider this approach in a different scenario and with more policies. More immediate work could include looking at some combination of probability and reward or some combination of predicting a state and predicting the likelihood of a violation to see if there might be a useful alternative evaluation mechanism that could result in increased prediction accuracy. Other work could look at prediction more than two cycles ahead to see how accuracy changes. Finally, it would be useful to develop a more formal basis for understanding how prediction and reinforcement learning are dependent on each other and their use in autonomic management. REFERENCES [1] R. Murch, Autonomic Computing. IBM Press., 2004. [2] J. O. Kephart and W. E. Walsh, “An Artificial Intelligence Perspective on Autonomic Computing Policies”, IEEE International Workshop on Policies for Distributed Systems and Networks (POLICY’04), 2004, pp. 3–12. [3] G. Tesauro, “Online Resource Allocation Using Decompositional Reinforcement Learning”, Association for the Advancement of Artificial Intelligence (AAAI’05), 2005. [4] G. Tesauro, N. K. Jong, R. Das, and M. N. Bennani, “A Hybrid Reinforcement Learning Approach to Autonomic Resource Allocation”, International Conference on Autonomic Computing (ICAC’06), Dublin, Ireland, June 2006, pp. 65–73. [5] D. Vengerov and N. Iakovlev, “A Reinforcement Learning Framework for Dynamic Resource Allocation: First Results”, International Conference on Autonomic Computing (ICAC’05), Seattle, WA, USA, January 2005, pp. 339–340. [6] P. Vienne and J. Sourrouille, “A Middleware for Autonomic QoS Management based on Learning”, International Conference on Sofware Engineering and Middleware, Lisbon, Portugal, September 2005, pp. 1–8. [7] R. M. Bahati and M. A. Bauer, “Modelling Reinforcement Learning in Policy-driven Autonomic Management”, International Journal On Advances in Intelligent Systems, 2008, vol. 1, no. 1, pp. 54-79.
Environments”, International Conference on Autonomic and Autonomous Systems (ICAS), 2006, pp. 6-6. [10] C. Hood and C. Ji. “Intelligent Agents for Proactive Network Fault Detection”, IEEE Internet Computing, 1998, Vol.2, 65-72. [11] J. Ding and X. Li and N, Jiang and Kramer, B.J. and Davoli, “Prediction Strategies for Proactive Management in Dynamic Distributed Systems”, International Conference on Digital Telecommunications. 2006, pp. 74-79. [12] G. Hamerly and C. Elkan, “Bayesian Approaches to Failure Prediction for Disk Drives”, Proceedings of International Conference on Machine Learning (ICML), 2001, pp. 202209. [13] K. Shen, M. Zhong, C. Li., “I/O System Performance Debugging Using Model-driven Anomaly Characterization”, 4th USENIX Conference on File and Storage Technologies, 2005, pp. 309-322. [14] P. Gujrati and Y. Li and Z. Lan and R. Thakur and J. White, “A Meta-learning Failure Predictor for Bluegene/L Systems”, Proceedings of International Conference on Parallel Processing (ICPP), 2007, pp. 40-40. [15] Y. Liang and Y. Zhang and A. Sivasubramanium and R. Sahoo, “BlueGene/L Failure Analysis and Prediction Models”, Proceedings of Dependable Systems and Networks (DSN), 2006, pp. 425-434. [16] J. Gu and Z. Zheng and Z. Lan and J. White and E. Hocks and B. Park, “Dynamic Meta-Learning for Failure Prediction in Large-Scale Systems: A Case Study”, Proceedings of International Conference Parallel Processing (ICPP), 2008, pp. 157-164. [17] R.K. Sahoo and A.J. Oliner et al., “Critical event prediction for proactive management in large-scale computer clusters”, Proceedings of Knowledge Discovery and Data Mining (KDD), 2003, pp. 426-435. [18] G. A. Hoffmann, F. Salfner and M. Malek. Advanced Failure Prediction in Complex Software Systems, Research Report, No. 172, Department of Computer Science, Humboldt University Berlin, 2004. [19] R. S. Sutton and A. G. Barto, Reinforcement Learning: an Introduction. MIT Press, 1998. [20] L. P. Kaelbing, M. L. Littman, and A. W. Moore, “Reinforcement Learning: A Survey”, Journal of Artificial Intelligence Research, April 1996, pp. 237–285. [21] R. A. Khandekar. Policy-Based Proactive System Management: Predicting Faults in Advance. MSc. Thesis, Department of Computer Science, The University of Western Ontario, 2010.
[8] R. M. Bahati, M. A. Bauer, and E. M. Vieira, “Adaptation Stratergies in Policy-Driven Autonomic Management”, International Conference on Autonomic and Autonomous Systems (ICAS’07), Athens, Greece, July 2007, pp. 16-21. [9] A. Andrzejak S. Graupner and S. Plantikow. “Predicting Resource Demand in Dynamic Utility Computing
Copyright (c) IARIA, 2012.
ISBN: 978-1-61208-187-8
79


![(BuuT=]] Download 'Reinforcement Learning with ... - WordPress.com](https://m.moam.info/img/260x300/buut-download-reinforcement-learning-with-wordpres_6479a7ba097c476a028b57d7.jpg)


