J Neurol 2012 DOI 10.1007/s00415-012-6768-z http://link.springer.com/article/10.1007%2Fs00415-012-6768-z
Author-created version Multivariate classification of patients with Alzheimer’s and dementia with Lewy bodies using high-dimensional cortical thickness measurements: an MRI surfacebased morphometric study. Lebedev AV MD1, Westman E PhD2, Beyer MK MD, PhD1,3, Kramberger MG MD4, Aguilar C MSc2, Pirtosek Z MD PhD4, Aarsland D MD PhD1,2,5
Affiliations: 1
Centre for Age-Related Medicine, Stavanger University, Stavanger, Norway; Department of Neurobiology, Care Sciences and Society, Karolinska Institute, Sweden; 3 Oslo University Hospital, Department of Radiology and Nuclear medicine, Rikshospitalet, Oslo, Norway; 4 Department of Neurology, University Medical Centre Ljubljana, Slovenia; 5 University of Oslo, AHUS campus. 2
Corresponding Author: Alexander V. Lebedev (e-mail:
[email protected]) Disclaimer: This is an author-created PDF-document based on an unedited version of the manuscript that has been accepted for publication. The manuscript undergoes copyediting, typesetting, and review of the resulting proof before it is published. The final publication is available at www.springerlink.com.
ABSTRACT Context: Alzheimer's disease (AD) and dementia with Lewy bodies (DLB) are the most common neurodegenerative dementia types. It is important to differentiate between them because of the differences in prognosis and treatment approaches. Objective: Investigate if Sparse Partial Least Squares (SPLS) classification of cortical thickness measurements could differentiate between AD and DLB. Methods: Two independent cohorts without MR-protocol alignment in Norway and Slovenia with 97 AD and DLB subjects were enrolled. Cortical thickness measurements acquired with Freesurfer were used in subsequent SPLS classification runs. The cohorts were analyzed separately and afterwards combined. The models were trained with leave-one-out cross validation and test datasets were used when available. To study the impact of MR-protocol alignment the classifiers were additionally tested on sets drawn exclusively from the independent cohorts. Results: The obtained sensitivity/specificity/AUC values were 94.4/88.89/0.978 and 88.2/94.1/0.969 in the Norwegian and in the Slovenian cohorts respectively. Both cohorts showed AD-associated pattern of thinning in mid-anterior temporal, occipital and subgenual cingulate cortex, whereas the pattern supportive for DLB included thinning in dorsal cingulate, posterior temporal and lateral orbitofrontal regions. When combining the cohorts, sensitivity/specificity/AUC were 82.1/85.7/0.948 for the training and 77.8/75/0.731 for the testing datasets with the same pattern-of-difference. The models tested on datasets drawn exclusively from the independent cohorts did not produce adequate accuracy. Conclusion: SPLS classification of cortical thickness is a good method for differentiating between AD and DLB, relatively stable even for mixed data, but not when tested on completely independent data drawn from different cohorts (without MR-protocol alignment). Keywords: Alzheimer's Disease, Dementia with Lewy Bodies, surface-based morphometry, multivariate classification, computer-assisted diagnosis
1
INTRODUCTION Alzheimer's disease (AD) and dementia with Lewy bodies (DLB) are the most common neurodegenerative dementia types and their prevalence increases because of the aging population. It is important to differentiate between AD and DLB in order to improve safety and efficacy of treatment, as well as to have reliable information about disease prognosis. People with DLB have high risks of severe reactions to antipsychotics [1, 43], have more severe functional impairment [48], reduced quality of life [9], and higher mortality rate than people with AD [68]. Therefore, it is not surprising that the annual care costs are higher for patients with DLB than for those with AD [10]. Most studies based on the 1996 consensus criteria for clinical diagnosis of DLB have reported a high specificity (80–100%) but a low sensitivity (20–60%) [47]. Sensitivity and specificity of the most recent criteria [46] are not clarified yet. Neuroimaging such as magnetic resonance imaging (MRI) can provide relevant support in the diagnosis of AD [53]. Whether MRI can assist in the differentiation between AD and DLB is not yet clarified, since most studies do not report sensitivity and specificity, providing only group differences. Nevertheless, these findings are highly important for uncovering brain mechanisms and for understanding the pathomorphological and pathophysiological differences in these conditions. One of the most robust observations is a relative preservation of the medial temporal lobe in patients with DLB compared to AD observed in a number of MRI studies [4, 5, 12]. Less consistent findings have been reported regarding the involvement of the frontal regions in DLB [4]. Burton et al [12] found bilateral grey matter volume loss in several specific frontal lobe areas: supplementary motor, lateral orbitofrontal and insular areas in DLB. Another voxel-based morphometric (VBM) study confirmed bilateral grey matter loss in insular, premotor and prefrontal cortical areas in DLB [11]. However, it is still not completely clear whether these changes differ in AD and DLB and whether they reflect comorbid AD pathology [31, 67]. Meanwhile, a recent VBM study found that the whole cortex is preserved in DLB compared to AD [67]. To our knowledge, there is only one study on multivariate imaging data analysis in DLB patients [64]. The authors used a mixed model to classify histopathologically confirmed dementia cases and achieved high sensitivity and specificity for AD and Lewy body cases. Since multivariate approaches have been shown to be both more sensitive and more specific than univariate approaches in predicting outcome measures from independent datasets when dealing with high dimensional neuroimaging data [33], we implemented them into our study. Different multivariate and machine learning approaches are available for neuroimaging data analysis [33]. A detailed review assessing the performance for some of them in neuroimaging studies contains also analysis of image postprocessing approaches [20]. Partial least squares (PLS) is a well-known dimensionality reduction method [70]. First being implemented in chemometrics, it has gained a lot of attention in high dimensional classification problems of computational biology. In addition, PLS has been demonstrated to be successful when dealing with large numbers of predictors, small sample size, and high collinearity among predictors [16], which is highly relevant for neuroimaging data. One of the main issues in such data is the so-called “curse of dimensionality”, which refers to the number of events that happens when dealing with highdimensional feature spaces and which can significantly influence the results hampering the effective modeling [7]. Although PLS by itself as a feature extraction algorithm has been shown to be effective in overcoming this problem, different approaches for feature selection [15] have also been developed in order to improve the modeling efficacy. In our work we used relatively novel Sparse Partial Least Squares (SPLS) technique, which provides the sparsity-based variable selection within the course of PLS dimensionality reduction. More detailed description can be found in [16]. Since the recent work revealed some advantages for the surface-based preprocessing approaches, such as significantly lower standard deviation of the intra-scanner difference as compared to Laplacian- or Registration-based methods [18], we implemented this into our study. Notably, the majority of studies utilizing pattern recognition techniques for neuroimaging data, were performed on either a single cohort or on several cohorts with harmonized imaging protocols. However, a comparison of behavior of pattern recognition techniques on MRI data with and without protocol alignment has not previously been undertaken. This is a key issue, as the necessity for protocol
2
alignment is a significant barrier that hampers the implementation of pattern recognition techniques into clinical practice. The aim of this study was to investigate whether a multivariate classification of cortical thickness measurements has a potential to facilitate differentiation between clinically diagnosed AD and DLB patients. In addition, we wanted to study the dependence of sparse PLS structural MRI data classification on the protocol alignment. We hypothesized that a classifier would likely fail to produce appropriate accuracy on data from different cohort due to significant protocol-related differences in imaging data. However, we also hypothesized that after being trained on a mixed set, the pattern recognition algorithm would still be able to demonstrate acceptable performance on the independent sets from both cohorts. The hypotheses were tested using two separate cohorts. As far as we know, this is the first study to implement sparse PLS technique in neuroimaging.
METHODS Setting Patients with mild AD or mild DLB from two European cohorts were included: the DemWest cohort, in which the study was performed at geriatric medicine and psychiatry outpatient clinics at three hospitals in Western Norway (Stavanger University Hospital, Haugesund Hospital, and Haraldsplass Deaconess Hospital in Bergen); and the Slovenian (Slo) cohort that consisted of dementia patients attending the memory outpatient clinic at the Department of neurology (University Medical Centre in Ljubljana). The diagnosis of dementia was made according to DSM-IV criteria and the diagnosis for Alzheimer’s disease dementia was based on The National Institute of Neurological and Communicative Disorders and Stroke-Alzheimer’s Disease and Related Disorders Association [49]. DLB was diagnosed according to the revised consensus criteria [46] in the DemWest cohort and the 1996-criteria for the Slo cohort [47]. For the Slo cohort we merged DLB and Parkinson disease dementia (PDD) patients [23], since these syndromes share clinical and pathological features [41]. Standardized clinical screening assessment instruments were administered in both cohorts to assess cognitive, psychiatric, and motor functions. Details for the DemWest study have been reported elsewhere [2]. In the Slo cohort, clinical assessment was performed using Mini Mental State Examination (MMSE), Unified Parkinson Disease Rating Scale, Clinical Dementia Rating scale, Neuropsychiatric Inventory and Beck Depression Inventory, detailed neuropsychological test battery (Delis-Kaplan Executive Function System, California Verbal Learning Test II, verbal fluency test, Boston Naming Test, The Rey-Osterrieth Complex Figure Test, Benton Line Orientation Test, Benton face recognition test, Stroop test), tests of autonomic functions and assessment of daily activities. In addition to routine blood tests, laboratory assessment of thyroid function, vitamin B12 and folate (the patients with vitamin deficiency were excluded) was administered. In both cohorts, visual assessment of MRI scans (both T1 and T2-FLAIR) were performed to exclude structural pathologies other than AD or DLB that could account for the symptoms. In the DemWest cohort, we actively selected AD patients for each of the 18 DLB cases and matched for gender, age and MMSE score.The remaining AD subjects were used as an independent testing dataset. The detailed demographics are provided in Table 1. Table 1. Demographics and Clinical data. DemWest cohort
Value N MMSE Gender, n (%) of males
Slo Cohort
AD
DLB
ADind
AD
DLB
18 23.72 [±0.75]
18 23.44 [±2.16]
27 24.19 [±2.15]
17 23.47 [±2.6]
12 prob DLB/5 PDD 21.94 [±2.73]
9(50)
11 (61)
2 (7.4)
6 (35.5)
10 (58.8)
Age*
77.67 [±5.64]
77.37 [±8.09]
72.36 [±7.52]
74.59 [±4.12]
71.59 [±3.12]
Education, years* Duration of disease, years**
9.58 [± 3.14]
9.03 [±2.42]
9.16 [± 1.82]
10.94 [± 2.5]
9 [±4.5]
2 (1-10)
2 (0-7)
2 (0-6)
4 (2-8)
3.5 (1-6)
* - Mean [±SD]; ** - Median (range); N – number of subjects; ind – independent dataset.
3
Age-related effects were regressed out before the classification in both cohorts. Number of subjects from different centers was equivalent in each sample in the DemWest cohort (Ratio for Centers C1/C2/C3 was: 14/2/2 – AD; 13/3/2 – DLB; and 20/4/3 in the independent dataset of 27 AD patients). 123
I-FP-CIT SPECT scanning procedure (DaTSCAN) Additionally, for all DLB subjects from Slo cohort and for 16 patients from DemWest cohort, single photon emission computed tomography procedures with 123I-FP-CIT compound (DaTSCAN) were acquired. In the DemWest cohort, the images were acquired at three institutions on Siemens Symbia and E-Cam dual-head Gamma cameras with similar protocols. Transversal images through the basal ganglia were visually analyzed by one nuclear medicine specialist blinded to all patient information. In the Slo cohort, DaTSCAN images acquired on Siemens Symbia T2 dual-head Gamma camera were evaluated by two independent raters (the first one is a specialist in nuclear medicine and the second one is a neurologist with additional knowledge in functional brain imaging). They were blinded for the clinical information. Normal/abnormal tracer uptake patterns were analyzed. The results were similar in the DLB and PDD patients. Postmortem Findings To date, 7 subjects (5 AD and 2 DLB) from the total DemWest cohort came to autopsy and had their diagnoses confirmed. Exclusion criteria The exclusion criteria were normal cognition, mild cognitive impairment or moderately severe or severe dementia (defined as MMSE < 15), acute delirium or confusion, terminal illness, recent diagnosis of a major somatic illness, history of bipolar or psychotic disorders. Ethical issues The studies were approved by the local Regional Committees for Medical Research Ethics. All patients provided written consent to participate in the study after the study procedures had been explained in detail to the patient and a caregiver. MRI Images were collected from 1.5 T MRI scanners using 3D T1-weighted MRI acquisition protocols, which were optimized and validated to produce reliable measurements of intracranial volume (ICV) and mean cortical thickness (MT). We had three centres and MRI scanners for the DemWest cohort in Norway: Stavanger, Haugesund (Philips Intera) and Bergen (GE Signa Excite); and one centre for the cohort from Slovenia: the University Medical Centre Ljubljana (GE Signa Excite). Visual Ad-hoc quality control was carried out for all MR scans. 3 images in the DemWest and 2 images in the Slo cohorts were excluded from the data analysis due to the bad image quality and motion artifacts. For the DemWest cohort the MRI protocols were aligned across the centers. The data collection from Slovenia was not harmonized with the DemWest cohort (for protocol details see Table 2). Table 2. MRI Protocols.
Cohort Place
Stavanger
DemWest Haugesund
Scanner Protocol HP-val performed Slice Orientation TR, ms TE, ms FA, ° ST Matrix In-plane resolution
Philips Intera FFE + coronal 10 4.6 30 1 256x256 1x1
Philips Intera FFE + coronal 20 4.6 30 1 256x256 1x1
Bergen
Slo Ljubljana
GE Signa Excite FSPGR + coronal 20 3.1 7 1 256x256 1x1
GE Signa Excite SPGR – sagittal 30 7 45 1.4 256x192 1x0.8
4
FFE – Fast Field Echo sequence; FSPGR – Fast Spoiled Gradient Recalled sequence; TR – repetition time; TE – echo time; FA – flip angle; ST – slice thickness; NEX – number of excitations; HP-val – Human Phantom validation
In order to check intra- and inter-scanner reliability in the Dem West cohort, we performed a validation study using human phantom scanning. For this purpose, MRI was performed in three healthy subjects with repeat scanning including FLAIR and 3DT1 two times at each centre on the same day. The MRI procedures included two scanning sessions with a pause in-between when the subject left the MRI room. Human phantom scanning was completed within 3 months for all participating centres. The analysis included estimation of intra- and inter-scanner reliability coefficients (Cronbach's alpha) for ICV and MT measurements. Reliability assessment was performed using “ltm” (Latent Trait Models) package [57] in R programming language [56], which is well established and freely available for download (http://www.Rproject.org/). Estimation of the reliability coefficient (Cronbach's alpha) showed appropriate results: the intra-/interscanner reliability coefficients for ICV and MT were 0.996/0.995 (excellent) and 0.945/0.752 (excellent/acceptable) respectively. Taking into account previously shown good test-retest cross-scanner reliability of the Freesurfer’s performance [34], these results allowed us to use the images from all three participating centers. Image Post-Processing Cortical reconstruction was performed using the Freesurfer image analysis suite (v 5.1) installed on CentOS 5.6 x86_64 workstation. The software is documented and available for download online (http://surfer.nmr.mgh.harvard.edu/). The technical details of this procedure are described elsewhere [21, 22, 27, 28, 30]. They include removal of non-brain tissues using a watershed/surface deformation procedure [60], Talairach space transformation, intensity normalization [63], tessellation of the gray/white matter boundary, topology correction [61], and surface deformation [21, 27]. After the cortical reconstruction, a number of deformable procedures can be performed for in further data processing and analysis including surface inflation [29], registration to a spherical atlas, which utilizes individual cortical folding patterns to match cortical geometry across subjects [30]. The described method uses both intensity and continuity information from the entire three-dimensional MR volume in segmentation and deformation procedures to produce representations of cortical thickness, calculated as the closest distance from the gray/white boundary to the gray/CSF boundary at each vertex on the tessellated surface [27]. The maps are created using intensity gradients across tissue classes and are therefore not simply reliant on absolute signal intensity. The maps produced are not restricted to the voxel size of the original data and thus are capable of detecting submillimeter differences between groups. Procedures for the measurement of cortical thickness have been validated against histological analysis [58] and manual measurements [40, 59]. Freesurfer morphometric procedures have been demonstrated to show good test-retest reliability across scanner manufacturers and across field strengths [34]. The Freesurfer output for all subjects underwent visual quality control and misclassified areas (mainly, regions near cerebellar sinuses and orbitofrontal cortex) were corrected manually by the trained brain image analyst and medical doctor blinded to the clinical diagnosis. Afterwards all vertices for both hemispheres from all the subjects were extracted and concatenated into n-by-327684 matrix (where n is the number of subjects and 327684 is the number of vertices for both hemispheres), which was used for the subsequent multivariate data analysis. Statistical Analysis Demographic and clinical features were compared using parametric and non-parametric tests as appropriate. In addition to Post-hoc visual quality control, we used principal component analysis (PCA) of the cortical thickness measurements for outlier detection, since this method has been shown to be effective in solving this issue [24]. We applied PCA implemented into the “stats” package in R programming language [56]. No outliers were detected. A multivariate analysis of surface-based cortical thickness measurements was performed using “spls” (Sparse Partial Least Squares) R-package (spls-package version: 2.1; R version 2.15); its methodology
5
has been described elsewhere [16, 17], and the documentation is available via the following link: http://cran.r-project.org/web/packages/spls/spls.pdf. The general principle of this methodology is to impose a mixed-‐norm (L1+L2) penalty on PLS loadings vectors [17]. We define PLS formulation as follows: Y = TQT + F; X = TPT + E; Where X ∈ Rn×p and Y ∈ Rn×q are predictor and response matrices, T ∈ Rn×K is a is a matrix that produces K linear combinations (scores), P ∈ Rp×K and Q ∈ Rq×K are matrices of coefficients (loadings) and E ∈ Rn×p and F ∈ Rn×q are matrices of random errors. In order to specify the latent component matrix T such that T = XW, PLS requires finding the columns of W = (w1,w2, . . . ,wK) from successive optimization problems. As a result, our model is determined by a linear combination of a subset of potential covariates. Constraining the loadings, we end up with two adjusting parameters: ‘eta’ – the measure of sparsity (varying between 0 and 1; when ‘eta’ is 0, regular PLS is used) and ‘K’ – the number of latent variables. For the details see [17]. We chose these parameters within a preliminary specified range (1–5 for ‘K’ and 0–0.5 with the increment of 0.1 for ‘eta’). We limited our search by 5 latent variables (K), since after this point we did not observe significant increase of the explained variance percentage, and upper ‘eta’ value limit was set to 0.5, because, according to our previous observations, higher values produce oversmoothed models. We applied the described approach for several smoothing kernels of 0, 5, 10, 15, 20 and 25 FWHM (Full Width at Half Maximum) after removing age-related effects. For each FWHM the best model had been selected based on its mean squared error of prediction (MSPE), whereupon the models’ leave-one–out (LOO) cross-validated sensitivity and specificity as well as their performance on the independent datasets (for the DemWest and the mixed cohort) were compared. Of note, Slo cohort was analyzed only using LOO strategy and did not have an independent dataset. Since MRI protocols were not harmonized between Norway and Slovenia, the data from the two countries were first analyzed separately. However, after observing similar patterns of atrophy in both cohorts (see results), we decided to investigate if we can combine the data even though the protocols are not harmonized. To do this, we selected a randomly-equivalent training dataset of 26/26 AD/DLB subjects and, after performing the described data analysis steps, tested the resulted model on the independent dataset of the remaining 36 AD and 9 DLB patients. Finally, to see a pure impact of protocol differences, we tested the DemWest and Slo models on data from opposite cohorts (DemWest model was tested on Slo data, and vise versa). After choosing the best model for each case, we calculated and plotted its sensitivity, specificity and overall accuracy and calculated area under the ROC curve (AUC). When reporting sensitivity and specificity, we used 0.5 as a cut-off value in all cases, which was the middle point between the minimum (0) and maximum (1) likelihoods for Lewy Body Pathology across all models. Finally, we mapped the variable coefficients from the best model into the brain space in order to define the regions, which were the most relevant for the AD/DLB classification. (The workflow steps and principle of the model selection are illustrated in Appendix: Figures A1 and A2).
RESULTS Demographics In total, 97 patients were included (DemWest: 63, Slo: 34). As expected after the matching procedure, the DemWest AD and DLB groups did not differ regarding demographic or clinical features (See Table 1). In Slo cohort, the AD subjects were slightly older than the DLBs (p-value: 0.023). SPLS modeling During the search for the optimal model we got optimal performance for FWHM of 20 mm in both cohorts. ‘K’/‘eta’ parameters were set as 2/0.3 for the first (DemWest) cohort and 2/0.4 for the second (Slo) cohort respectively. Sensitivity/Specificity/AUC were 94.4 %/88.89 %/0.978 for the DemWest
6
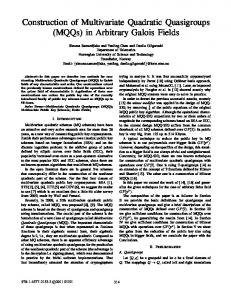
cohort and 88.2 %/94.1 %/0.969 for the Slo cohort (see Figure 1). Overall accuracies were 91.64 and 91.15 in the training DemWest and Slo datasets, respectively. Additionally, 21 out of 27 probable AD subjects from the independent dataset of the DemWest cohort were correctly classified by the corresponding model (accuracy = 77.78 %), suggesting appropriate generalization. In the mixed cohort, ‘K’/‘eta’ parameters were set as 2/0.4. Sensitivity/Specificity/AUC were 82.1 %/85.7 %/0.948 for the training and 77.8 %/75 %/0.731 for testing datasets (Overall accuracies were 83.9 and 76.4 respectively).
Figure 1. SPLS model performance. The graphs are the ROC curves for the classifiers in two cohorts (DemWest, Slo) and in the mixed sample, consisted of the equivalently combined training dataset (26/26 AD and DLB patients) and of the independent dataset (remaining 36/9 AD/DLB cases). Leave-one-out cross validation performance is plotted for each model. For the mixed sample, classifier performance on the independent dataset is also provided. FWHM – Full Width at Half Maximum (smoothing kernel); VN – number of the selected features (vertices); opt.K/opt.eta – optimal ‘K’ (number of latent components) and ‘eta’ (sparsity) parameters; MSPE – mean squared prediction error; AUC – area under the ROC curve.
As expected, being tested on opposite data (from different cohorts) the models failed to produce appropriate accuracy. Thus, the DemWest model showed 0.59/0.59/0.67 for Sensitivity/Specificity/AUC on the Slo data, and the Slo model demonstrated 0.61/56/0.56 on the DemWest data, respectively. Regions of relevance for AD/DLB classification Mapping the coefficients into the brain space revealed several regions, which appeared to be the most relevant for the classification. The pattern of difference was similar in all cohorts (Figure 2). Cortical thinning, which increased the chances for the subject to be classified as an AD patient, was observed bilaterally in anterior parahippocampal region and temporal pole (the most relevant areas), subcallosal (subgenual cingulate) and occipital regions. Cortical thinning relevant for DLB was observed bilaterally in cingulate region (affecting middle and posterior parts on the right side and middle on the left), superior temporo-occipital areas, and lateral orbitofrontal cortex. In the DemWest and in the mixed sample, AD-associated pattern also included changes in parietal region, whereas DLB-suppotive thinning was additionally found in insular area. This was not observed in Slo cohort. Figure 2. Regions of relevance. The figure shows regions of relevance for AD/DLB classification from three models obtained in DemWest, Slo and mixed cohorts. The last sample consisted of the equivalently combined training dataset (26 AD and 26 DLB patients) and of the independent dataset (remaining 36/9 AD/DLB cases). Red spectrum reflects pattern of cortical thinning that increased chances for the subject to be classified as an AD patient. Green spectrum is the regions of importance for DLB.
7
DISCUSSION The present study is one of the first to compare differences in the MRI morphological profiles of AD and DLB patients in a multivariate perspective. We applied multivariate analysis for high-dimensional surface-based measurements without the ROI predefinition and the sparse PLS algorithm for neuroimaging data analysis. Our work revealed an opportunity for robust AD/DLB classification based on structural MRI data. The performance of our model is comparable to the results from previous neuroimaging studies that used different models for the diagnostic classification of AD, DLB, Frontotemporal Dementia and mild cognitive impairment [25, 38, 42, 54, 64, 66]. The main regional changes, which contributed to the diagnostic classification, were thinning of the parahippocampal, subgenual cingulate regions and temporal pole in AD, compared to thinning in mid and posterior cingulate, superior temporo-occipital, and lateral orbitofrontal regions in DLB. The described pattern is consistent with some of the previous studies. More extended temporal changes in patients with AD as compared to DLB have been found in a number of studies [4, 5, 12]. The neuropathological substrate of AD primarily affects entorhinal cortex and associated neocortical areas; this may explain more severely impaired memory function in AD as compared to DLB [6, 44, 47]. On the other hand, the neuropathological basis of DLB includes subcortical, frontal, temporal, and parietal lobes, which may explain the predominance of visuospatial, attentional, and executive function impairment in the patients [14, 52, 55, 62]. Therefore, the pattern of atrophy supportive for DLB obtained in our study is consistent with neuropathological and neuropsychological findings. However, atrophy can only partially explain cognitive and other symptoms in DLB, and other factors such as metabolic, brain perfusion and neurotransmitter changes most likely also play a role in specific patterns of cognitive decline. Disentangling the relative contributions of the various pathologies for the clinical phenotype in DLB is a research priority. Inconsistent findings have been reported regarding the involvement of cingulate and frontal cortex in DLB. Both post mortem [39], as well as studies using imaging techniques such as SPECT-perfusion [19], PIB-PET [32], DTI [26, 37], have reported cingulate involvement in Lewy Body dementia. There are several reports on frontal lobe atrophy in DLB [11-13]. However, recent studies found orbitofrontal [4] and, on the large sample, even the whole [67] cortex to be preserved in DLB compared to AD. In addition, although there are observations from functional studies showing metabolic [51] and perfusion [35] reductions in occipital lobes in DLB compared to AD, no significant volumetric differences in this region were found [36, 50]. Our results showing more occipital involvement in AD compared to DLB might therefore look surprising. But it is worth noting that multivariate pattern implies complex relationships between areas, where many interrelated features influence the response together. In contrast, in univariate or mass-univariate results (as in the referred structural studies), every single measurement (ROI volume, voxel or vertex) has its own variance, and is treated independently. Thus, the regional pattern of difference observed in our results must be interpreted with caution. It is also important to note that the mentioned structural studies analyzed volumes, whereas in our work, we looked at cortical thickness, which may have different quantitative and qualitative sensitivity to the atrophy-related brain changes. In particular, it has been shown to be less dependent on cortical surface area than volumetric measurements [69]. Therefore, the results obtained using different techniques may differ. Another key point pertains to the results from the mixed datasets. It is well-known that MRI protocol alignment is an important step in multicenter studies, the use of which can provide an opportunity to implement models trained on unified datasets such as ADNI for the new data derived from different cohorts without a significant drop of accuracy [65]. Our results showed that without this step the models fail to demonstrate appropriate performance on data acquired using different protocols. This is a significant limitation of these methods that complicates their clinical implementation. MRI protocol alignment can be simplified by using plastic phantom, instead of a human volunteer as phantom. This has also some benefits in terms of stability of referential structure sizes, and an opportunity for using such phantoms multiple times without very strict safety limitations. On the other hand, our results demonstrate that the models can still produce acceptable accuracy on different data even without protocol alignment (although not as good as with alignment). The use of the mixed sample resulted in the accuracy drop (from 91.64/91.15 to 83.9 for the LOO performance, and from 77.8 to 76.4 for the independent datasets), but accuracy was still at an acceptable level 8
(AUC>0.7). This, coupled with stability of pattern of selected features, supports the robustness of SPLS technique. However, they still need to be confirmed in larger datasets. There are some important limitations in our study. First, in the DemWest cohort, patients were scanned at three different centers. This may influence the results, although previous studies have shown crossscanner robustness of the Freesurfer’s performance and we found good reliability across the three centres. The Slo cohort was scanned at only one scanner. The second limitation is the relatively small sample sizes that may influence both feature selection process and fitting. This may particularly explain minor differences in atrophy patterns between cohorts. However, we observed similar findings when analyzing two cohorts separately, and also on the mixed sample additionally testing the classifier on the independent dataset. The first model (DemWest) was additionally tested on the independent dataset of 27 AD subjects from the same cohort. The accuracy of the model was lower for this testing dataset (77.78 %, compared to LOO accuracy of 91.64). We believe, that the preponderance of women in this dataset (7.4 % of males compared to more than a half in the training DemWest dataset) also contributes to the drop of accuracy, as gender-related differences in morphological profiles affecting cingulate cortex have also been found in patients with Alzheimer’s disease [4]. Another possible explanation of this drop is a coarse MRI protocol alignment for the Norwegian cohort. It is important to acknowledge that although we tried our best to optimize the MRI protocols across centers so that they would produce reliable measurements and showed their reliability on 3 human phantoms, this number may be not enough to estimate real variance of the measurements. It is also worth noting, that the reliability of ICV and MT does not necessarily imply the stability of regional measurements. The absence of DLB cases in the testing DemWest dataset also hampers a full assessment of generalization in this model. And finally, in the Slo cohort, there were age differences between the AD and DLB groups, and although we regressed them out before the classification, this may influence our findings too. It is also important to note, that whereas our main cohort contained only AD and DLB patients, 5 PDD subjects were included in the Slo DLB cohort. Although brain changes are shown to be similar in PDD and DLB [41], there are some differences with more structural pathology in DLB than in PDD [3, 8]. This may explain the slightly lower sensitivity in the Slo (88.2%) compared to 94.4% in DemWest. Finally, the diagnoses of AD and DLB were primarily based on clinical criteria, and thus some misdiagnosis cannot be excluded. However, in the DemWest study, patients are followed annually, and bi-annual meetings among the study clinicians are held. In addition, the first seven patients coming to autopsy had their clinical diagnosis confirmed. Finally, DAT-scans were acquired for the majority of DLB-subjects, and have been shown to be specific for the diagnosis of DLB [45]. Of note, there is a variation in the amount of AD-pathology in DLB patients [46], which might influence the ability to clearly distinguish between AD and DLB using MRI. To conclude, we found that SPLS classification of high-dimensional cortical thickness measurements is a robust and accurate method for differentiating between AD and DLB patients, relatively stable even for mixed data, but not when tested on completely independent data drawn from different cohorts without MR-protocol alignment.
ACKNOWLEDGEMENT The study received financial support from Western Norway regional health authority, the Norwegian Research Council and MedIm (Norwegian University of Science and Technology, Trondheim). In addition, MedViz (University of Bergen) supported us with computer power. The Slovenian study was financially supported by Slovenian Research Agency. Also thanks to the Strategic Research Programme in Neuroscience at Karolinska Institutet (StratNeuro) and Swedish Brain Power. We are very thankful to the FreeSurfer Development Team and personally to Douglas N Greve, who kindly suggested the solution for mapping the results into the brain space and, of course, to the R Development Team for their great project!
CONFLICT OF INTEREST The authors declare that they have no conflict of interest.
9
APPENDIX See Figures A1 and A2.
Figure A1. Workflow. Image postprocessing and data analysis were performed in Freesurfer (blue box) and R programming language (brown box). First, the raw MRI images underwent steps for surface-based cortex reconstruction. Next, cortical model for each individual was registered to a spherical atlas, providing matching across subjects, smoothed, and finally 327684 measurements of cortical thickness for N subjects were concatenated into N-by-327684 matrix, which was used in the subsequent analysis. Then PCA-based outlier detection and GLM-based removal of age-related effects were performed, preparing the data to the further SPLS classification that utilizes variable selection within the context of partial least squares. Finally, the variable coefficients from the best model were mapped into the brain space in order to define the regions, which were the most relevant for the AD/DLB classification. The figure is partly based on the tutorial materials available on the official Freesurfer webpage: (http://surfer.nmr.mgh.harvard.edu/fswiki/FsTutorial).
10
Figure A2. Model selection: two cohorts. The “hot-plot” illustrates the principle of the model selection, consisted of searching for optimal ‘K’ (latent components) and ‘eta’ (sparsity) parameters, based on model’s Mean Squared Error of Prediction (MSEP) validated using Leave-one-out (LOO) strategy. The search starts from PLS modeling without variable selection (bottom row). “Colder” colors reflect lower MSEP, and, therefore, better models. Red frames indicates optimal ‘K’/’eta’ parameters and contain corresponding MSEP.
REFERENCES 1.
2. 3. 4. 5. 6. 7. 8. 9. 10. 11. 12. 13. 14. 15. 16. 17. 18. 19. 20. 21.
Aarsland D, Perry R, Larsen JP, McKeith IG, O'Brien JT, Perry EK, Burn D, Ballard CG (2005) Neuroleptic sensitivity in Parkinson's disease and parkinsonian dementias. J Clin Psychiatry 66:633-637 Aarsland D, Rongve A, Nore SP, Skogseth R, Skulstad S, Ehrt U, Hoprekstad D, Ballard C (2008) Frequency and case identification of dementia with Lewy bodies using the revised consensus criteria. Dement Geriatr Cogn Disord 26:445-452 Ballard C, Ziabreva I, Perry R, Larsen JP, O'Brien J, McKeith I, Perry E, Aarsland D (2006) Differences in neuropathologic characteristics across the Lewy body dementia spectrum. Neurology 67:1931-1934 Ballmaier M, O'Brien JT, Burton EJ, Thompson PM, Rex DE, Narr KL, McKeith IG, DeLuca H, Toga AW (2004) Comparing gray matter loss profiles between dementia with Lewy bodies and Alzheimer's disease using cortical pattern matching: diagnosis and gender effects. Neuroimage 23:325-335 Barber R, Ballard C, McKeith IG, Gholkar A, O'Brien JT (2000) MRI volumetric study of dementia with Lewy bodies: a comparison with AD and vascular dementia. Neurology 54:1304-1309 Barber R, McKeith IG, Ballard C, Gholkar A, O'Brien JT (2001) A comparison of medial and lateral temporal lobe atrophy in dementia with Lewy bodies and Alzheimer's disease: magnetic resonance imaging volumetric study. Dement Geriatr Cogn Disord 12:198-205 Bellman RE (1961) Adaptive control processes: a guided tour. Princeton University Press Beyer MK, Larsen JP, Aarsland D (2007) Gray matter atrophy in Parkinson disease with dementia and dementia with Lewy bodies. Neurology 69:747-754 Bostrom F, Jonsson L, Minthon L, Londos E (2007) Patients with dementia with lewy bodies have more impaired quality of life than patients with Alzheimer disease. Alzheimer Dis Assoc Disord 21:150-154 Bostrom F, Jonsson L, Minthon L, Londos E (2007) Patients with Lewy body dementia use more resources than those with Alzheimer's disease. Int J Geriatr Psychiatry 22:713-719 Brenneis C, Wenning GK, Egger KE, Schocke M, Trieb T, Seppi K, Marksteiner J, Ransmayr G, Benke T, Poewe W (2004) Basal forebrain atrophy is a distinctive pattern in dementia with Lewy bodies. Neuroreport 15:1711-1714 Burton EJ, Karas G, Paling SM, Barber R, Williams ED, Ballard CG, McKeith IG, Scheltens P, Barkhof F, O'Brien JT (2002) Patterns of cerebral atrophy in dementia with Lewy bodies using voxel-based morphometry. Neuroimage 17:618-630 Burton EJ, McKeith IG, Burn DJ, Williams ED, O'Brien JT (2004) Cerebral atrophy in Parkinson's disease with and without dementia: a comparison with Alzheimer's disease, dementia with Lewy bodies and controls. Brain 127:791-800 Calderon J, Perry RJ, Erzinclioglu SW, Berrios GE, Dening TR, Hodges JR (2001) Perception, attention, and working memory are disproportionately impaired in dementia with Lewy bodies compared with Alzheimer's disease. J Neurol Neurosurg Psychiatry 70:157-164 Chong G, Jung C-H (2005) Performance of some variable selection methods when multicollinearity is present. Chemometrics and Intelligent Laboratory Systems 78:103-112 Hyonho Chun and Sündüz Keleş. J R Stat Soc Series B Stat Methodol. 2010 January; 72(1): 3–25. Chung D, Chun H (2010) An Introduction to the ‘spls ’ Package, Version 1.0 [http://cran.rproject.org/web/packages/spls/vignettes/spls-example.pdf]. In:CiteSeerX Clarkson MJ, Cardoso MJ, Ridgway GR, Modat M, Leung KK, Rohrer JD, Fox NC, Ourselin S (2011) A comparison of voxel and surface based cortical thickness estimation methods. Neuroimage 57:856-865 Colloby SJ, Fenwick JD, Williams ED, Paling SM, Lobotesis K, Ballard C, McKeith I, O'Brien JT (2002) A comparison of (99m)Tc-HMPAO SPET changes in dementia with Lewy bodies and Alzheimer's disease using statistical parametric mapping. Eur J Nucl Med Mol Imaging 29:615-622 Cuingnet R, Gerardin E, Tessieras J, Auzias G, Lehericy S, Habert MO, Chupin M, Benali H, Colliot O (2011) Automatic classification of patients with Alzheimer's disease from structural MRI: a comparison of ten methods using the ADNI database. Neuroimage 56:766-781 Dale AM, Fischl B, Sereno MI (1999) Cortical surface-based analysis. I. Segmentation and surface reconstruction. Neuroimage 9:179-194 11
22. Desikan RS, Segonne F, Fischl B, Quinn BT, Dickerson BC, Blacker D, Buckner RL, Dale AM, Maguire RP, Hyman BT, Albert MS, Killiany RJ (2006) An automated labeling system for subdividing the human cerebral cortex on MRI scans into gyral based regions of interest. Neuroimage 31:968-980 23. Emre M, Aarsland D, Brown R, Burn DJ, Duyckaerts C, Mizuno Y, Broe GA, Cummings J, Dickson DW, Gauthier S, Goldman J, Goetz C, Korczyn A, Lees A, Levy R, Litvan I, McKeith I, Olanow W, Poewe W, Quinn N, Sampaio C, Tolosa E, Dubois B (2007) Clinical diagnostic criteria for dementia associated with Parkinson's disease. Mov Disord 22:1689-1707; quiz 1837 24. Esbensen KH, Guyot D, Westad F, Houmøller LP (2002) Multivariate data analysis in practice: an introduction to multivariate data analysis and experimental design, 5th Edition. Aalborg University, Esbjerg 25. Fan Y, Batmanghelich N, Clark CM, Davatzikos C (2008) Spatial patterns of brain atrophy in MCI patients, identified via high-dimensional pattern classification, predict subsequent cognitive decline. Neuroimage 39:1731-1743 26. Firbank MJ, Blamire AM, Krishnan MS, Teodorczuk A, English P, Gholkar A, Harrison R, O'Brien JT (2007) Atrophy is associated with posterior cingulate white matter disruption in dementia with Lewy bodies and Alzheimer's disease. Neuroimage 36:1-7 27. Fischl B, Dale AM (2000) Measuring the thickness of the human cerebral cortex from magnetic resonance images. Proc Natl Acad Sci U S A 97:11050-11055 28. Fischl B, Salat DH, Busa E, Albert M, Dieterich M, Haselgrove C, van der Kouwe A, Killiany R, Kennedy D, Klaveness S, Montillo A, Makris N, Rosen B, Dale AM (2002) Whole brain segmentation: automated labeling of neuroanatomical structures in the human brain. Neuron 33:341-355 29. Fischl B, Sereno MI, Dale AM (1999) Cortical surface-based analysis. II: Inflation, flattening, and a surfacebased coordinate system. Neuroimage 9:195-207 30. Fischl B, Sereno MI, Tootell RB, Dale AM (1999) High-resolution intersubject averaging and a coordinate system for the cortical surface. Hum Brain Mapp 8:272-284 31. Giannakopoulos P, Hof PR (2009) Frontiers of neurology and neuroscience. Dementia in clinical practice. Preface. Front Neurol Neurosci 24:IX-X 32. Gomperts SN, Rentz DM, Moran E, Becker JA, Locascio JJ, Klunk WE, Mathis CA, Elmaleh DR, Shoup T, Fischman AJ, Hyman BT, Growdon JH, Johnson KA (2008) Imaging amyloid deposition in Lewy body diseases. Neurology 71:903-910 33. Habeck C, Stern Y (2010) Multivariate data analysis for neuroimaging data: overview and application to Alzheimer's disease. Cell Biochem Biophys 58:53-67 34. Han X, Jovicich J, Salat D, van der Kouwe A, Quinn B, Czanner S, Busa E, Pacheco J, Albert M, Killiany R, Maguire P, Rosas D, Makris N, Dale A, Dickerson B, Fischl B (2006) Reliability of MRI-derived measurements of human cerebral cortical thickness: the effects of field strength, scanner upgrade and manufacturer. Neuroimage 32:180-194 35. Hanyu H, Shimizu S, Hirao K, Kanetaka H, Sakurai H, Iwamoto T, Koizumi K, Abe K (2006) Differentiation of dementia with Lewy bodies from Alzheimer's disease using Mini-Mental State Examination and brain perfusion SPECT. J Neurol Sci 250:97-102 36. Ishii K, Soma T, Kono AK, Sofue K, Miyamoto N, Yoshikawa T, Mori E, Murase K (2007) Comparison of regional brain volume and glucose metabolism between patients with mild dementia with lewy bodies and those with mild Alzheimer's disease. J Nucl Med 48:704-711 37. Kamagata K, Motoi Y, Abe O, Shimoji K, Hori M, Nakanishi A, Sano T, Kuwatsuru R, Aoki S, Hattori N (2012) White matter alteration of the cingulum in Parkinson disease with and without dementia: evaluation by diffusion tensor tract-specific analysis. AJNR Am J Neuroradiol 33:890-895 38. Kloppel S, Stonnington CM, Chu C, Draganski B, Scahill RI, Rohrer JD, Fox NC, Jack CR, Jr., Ashburner J, Frackowiak RS (2008) Automatic classification of MR scans in Alzheimer's disease. Brain 131:681-689 39. Kovari E, Gold G, Herrmann FR, Canuto A, Hof PR, Bouras C, Giannakopoulos P (2003) Lewy body densities in the entorhinal and anterior cingulate cortex predict cognitive deficits in Parkinson's disease. Acta Neuropathol 106:83-88 40. Kuperberg GR, Broome MR, McGuire PK, David AS, Eddy M, Ozawa F, Goff D, West WC, Williams SC, van der Kouwe AJ, Salat DH, Dale AM, Fischl B (2003) Regionally localized thinning of the cerebral cortex in schizophrenia. Arch Gen Psychiatry 60:878-888 41. Lippa CF, Duda JE, Grossman M, Hurtig HI, Aarsland D, Boeve BF, Brooks DJ, Dickson DW, Dubois B, Emre M, Fahn S, Farmer JM, Galasko D, Galvin JE, Goetz CG, Growdon JH, Gwinn-Hardy KA, Hardy J, Heutink P, Iwatsubo T, Kosaka K, Lee VM, Leverenz JB, Masliah E, McKeith IG, Nussbaum RL, Olanow CW, Ravina BM, Singleton AB, Tanner CM, Trojanowski JQ, Wszolek ZK (2007) DLB and PDD boundary issues: diagnosis, treatment, molecular pathology, and biomarkers. Neurology 68:812-819 42. Magnin B, Mesrob L, Kinkingnehun S, Pelegrini-Issac M, Colliot O, Sarazin M, Dubois B, Lehericy S, Benali H (2009) Support vector machine-based classification of Alzheimer's disease from whole-brain anatomical MRI. Neuroradiology 51:73-83
12
43. McKeith I, Fairbairn A, Perry R, Thompson P, Perry E (1992) Neuroleptic sensitivity in patients with senile dementia of Lewy body type. BMJ 305:673-678 44. McKeith I, Mintzer J, Aarsland D, Burn D, Chiu H, Cohen-Mansfield J, Dickson D, Dubois B, Duda JE, Feldman H, Gauthier S, Halliday G, Lawlor B, Lippa C, Lopez OL, Carlos Machado J, O'Brien J, Playfer J, Reid W (2004) Dementia with Lewy bodies. Lancet Neurol 3:19-28 45. McKeith I, O'Brien J, Walker Z, Tatsch K, Booij J, Darcourt J, Padovani A, Giubbini R, Bonuccelli U, Volterrani D, Holmes C, Kemp P, Tabet N, Meyer I, Reininger C (2007) Sensitivity and specificity of dopamine transporter imaging with 123I-FP-CIT SPECT in dementia with Lewy bodies: a phase III, multicentre study. Lancet Neurol 6:305-313 46. McKeith IG, Dickson DW, Lowe J, Emre M, O'Brien JT, Feldman H, Cummings J, Duda JE, Lippa C, Perry EK, Aarsland D, Arai H, Ballard CG, Boeve B, Burn DJ, Costa D, Del Ser T, Dubois B, Galasko D, Gauthier S, Goetz CG, Gomez-Tortosa E, Halliday G, Hansen LA, Hardy J, Iwatsubo T, Kalaria RN, Kaufer D, Kenny RA, Korczyn A, Kosaka K, Lee VM, Lees A, Litvan I, Londos E, Lopez OL, Minoshima S, Mizuno Y, Molina JA, Mukaetova-Ladinska EB, Pasquier F, Perry RH, Schulz JB, Trojanowski JQ, Yamada M (2005) Diagnosis and management of dementia with Lewy bodies: third report of the DLB Consortium. Neurology 65:1863-1872 47. McKeith IG, Galasko D, Kosaka K, Perry EK, Dickson DW, Hansen LA, Salmon DP, Lowe J, Mirra SS, Byrne EJ, Lennox G, Quinn NP, Edwardson JA, Ince PG, Bergeron C, Burns A, Miller BL, Lovestone S, Collerton D, Jansen EN, Ballard C, de Vos RA, Wilcock GK, Jellinger KA, Perry RH (1996) Consensus guidelines for the clinical and pathologic diagnosis of dementia with Lewy bodies (DLB): report of the consortium on DLB international workshop. Neurology 47:1113-1124 48. McKeith IG, Rowan E, Askew K, Naidu A, Allan L, Barnett N, Lett D, Mosimann UP, Burn D, O'Brien JT (2006) More severe functional impairment in dementia with lewy bodies than Alzheimer disease is related to extrapyramidal motor dysfunction. Am J Geriatr Psychiatry 14:582-588 49. McKhann G, Drachman D, Folstein M, Katzman R, Price D, Stadlan EM (1984) Clinical diagnosis of Alzheimer's disease: report of the NINCDS-ADRDA Work Group under the auspices of Department of Health and Human Services Task Force on Alzheimer's Disease. Neurology 34:939-944 50. Middelkoop HA, van der Flier WM, Burton EJ, Lloyd AJ, Paling S, Barber R, Ballard C, McKeith IG, O'Brien JT (2001) Dementia with Lewy bodies and AD are not associated with occipital lobe atrophy on MRI. Neurology 57:2117-2120 51. Minoshima S, Foster NL, Sima AA, Frey KA, Albin RL, Kuhl DE (2001) Alzheimer's disease versus dementia with Lewy bodies: cerebral metabolic distinction with autopsy confirmation. Ann Neurol 50:358365 52. Noe E, Marder K, Bell KL, Jacobs DM, Manly JJ, Stern Y (2004) Comparison of dementia with Lewy bodies to Alzheimer's disease and Parkinson's disease with dementia. Mov Disord 19:60-67 53. O'Brien JT (2007) Role of imaging techniques in the diagnosis of dementia. Br J Radiol 80 Spec No 2:S7177 54. Oliveira P, Nitrini R, Busatto G, Buchpiguel C, Sato J, Amaro E (2010) Use of SVM methods with surfacebased cortical and volumetric subcortical measurements to detect Alzheimer's disease. J Alzheimers Dis 19(4):1263-1272 55. Park KW, Kim HS, Cheon SM, Cha JK, Kim SH, Kim JW (2011) Dementia with Lewy Bodies versus Alzheimer's Disease and Parkinson's Disease Dementia: A Comparison of Cognitive Profiles. J Clin Neurol 7:19-24 56. R Core Team (2012). R: A language and environment for statistical computing. R Foundation for Statistical Computing, Vienna, Austria. ISBN 3-900051-07-0, URL http://www.Rproject.org/. 57. Rizopoulos D (2006) ltm: An R package for Latent Variable Modelling and Item Response Theory Analyses. Journal of Statistical Software 17 (5):1-25 58. Rosas HD, Liu AK, Hersch S, Glessner M, Ferrante RJ, Salat DH, van der Kouwe A, Jenkins BG, Dale AM, Fischl B (2002) Regional and progressive thinning of the cortical ribbon in Huntington's disease. Neurology 58:695-701 59. Salat DH, Buckner RL, Snyder AZ, Greve DN, Desikan RS, Busa E, Morris JC, Dale AM, Fischl B (2004) Thinning of the cerebral cortex in aging. Cereb Cortex 14:721-730 60. Segonne F, Dale AM, Busa E, Glessner M, Salat D, Hahn HK, Fischl B (2004) A hybrid approach to the skull stripping problem in MRI. Neuroimage 22:1060-1075 61. Segonne F, Pacheco J, Fischl B (2007) Geometrically accurate topology-correction of cortical surfaces using nonseparating loops. IEEE Trans Med Imaging 26:518-529 62. Simard M, van Reekum R, Myran D (2003) Visuospatial impairment in dementia with Lewy bodies and Alzheimer's disease: a process analysis approach. Int J Geriatr Psychiatry 18:387-391 63. Sled JG, Zijdenbos AP, Evans AC (1998) A nonparametric method for automatic correction of intensity nonuniformity in MRI data. IEEE Trans Med Imaging 17:87-97
13
64. Vemuri P, Simon G, Kantarci K, Whitwell JL, Senjem ML, Przybelski SA, Gunter JL, Josephs KA, Knopman DS, Boeve BF, Ferman TJ, Dickson DW, Parisi JE, Petersen RC, Jack CR, Jr. (2011) Antemortem differential diagnosis of dementia pathology using structural MRI: Differential-STAND. Neuroimage 55:522-531 65. Westman E, Simmons A, Muehlboeck JS, Mecocci P, Vellas B, Tsolaki M, Kloszewska I, Soininen H, Weiner MW, Lovestone S, Spenger C, Wahlund LO (2011) AddNeuroMed and ADNI: similar patterns of Alzheimer's atrophy and automated MRI classification accuracy in Europe and North America. Neuroimage 58:818-828 66. Westman E, Simmons A, Zhang Y, Muehlboeck JS, Tunnard C, Liu Y, Collins L, Evans A, Mecocci P, Vellas B, Tsolaki M, Kloszewska I, Soininen H, Lovestone S, Spenger C, Wahlund LO (2011) Multivariate analysis of MRI data for Alzheimer's disease, mild cognitive impairment and healthy controls. Neuroimage 54:1178-1187 67. Whitwell JL, Weigand SD, Shiung MM, Boeve BF, Ferman TJ, Smith GE, Knopman DS, Petersen RC, Benarroch EE, Josephs KA, Jack CR, Jr. (2007) Focal atrophy in dementia with Lewy bodies on MRI: a distinct pattern from Alzheimer's disease. Brain 130:708-719 68. Williams MM, Xiong C, Morris JC, Galvin JE (2006) Survival and mortality differences between dementia with Lewy bodies vs Alzheimer disease. Neurology 67:1935-1941 69. Winkler AM, Kochunov P, Blangero J, Almasy L, Zilles K, Fox PT, Duggirala R, Glahn DC (2010) Cortical thickness or grey matter volume? The importance of selecting the phenotype for imaging genetics studies. Neuroimage 53:1135-1146 70. Wold S, Ruhe A, Wold H, Dunn WJ, Iii (1984) The Collinearity Problem in Linear Regression. The Partial Least Squares (PLS) Approach to Generalized Inverses. SIAM Journal on Scientific and Statistical Computing 5:735-743
14