IEEE TRANSACTIONS ON MEDICAL IMAGING, VOL. 32, NO. 9, SEPTEMBER 2013
1723
Automated Abdominal Multi-Organ Segmentation With Subject-Specific Atlas Generation Robin Wolz*, Chengwen Chu, Kazunari Misawa, Michitaka Fujiwara, Kensaku Mori, and Daniel Rueckert
Abstract—A robust automated segmentation of abdominal organs can be crucial for computer aided diagnosis and laparoscopic surgery assistance. Many existing methods are specialized to the segmentation of individual organs and struggle to deal with the variability of the shape and position of abdominal organs. We present a general, fully-automated method for multi-organ segmentation of abdominal computed tomography (CT) scans. The method is based on a hierarchical atlas registration and weighting scheme that generates target specific priors from an atlas database by combining aspects from multi-atlas registration and patch-based segmentation, two widely used methods in brain segmentation. The final segmentation is obtained by applying an automatically learned intensity model in a graph-cuts optimization step, incorporating high-level spatial knowledge. The proposed approach allows to deal with high inter-subject variation while being flexible enough to be applied to different organs. We have evaluated the segmentation on a database of 150 manually segmented CT images. The achieved results compare well to state-of-the-art methods, that are usually tailored to more specific questions, with Dice overlap values of 94%, 93%, 70%, and 92% for liver, kidneys, pancreas, and spleen, respectively. Index Terms—Abdominal computed tomography (CT), graph cuts, hierarchical model, multi-atlas segmentation, patch-based segmentation.
I. INTRODUCTION
T
HE SEGMENTATION of organs like the liver, pancreas, and kidneys on abdominal computed tomography (CT) scans can form an input to computer aided diagnosis (CAD) systems and laparoscopic surgery assistance [1]. Further applications include radiotherapy planning [2] as well as cancer detection and staging [3]. Most previous work on automated abdominal segmentation is based on statistical shape models or
Manuscript received March 21, 2013; revised May 14, 2013; accepted May 24, 2013. Date of publication June 03, 2013; date of current version August 28, 2013. This research was supported by the RS-JSPS Research Cooperative Program and the MEXT/JSPS KAKENHI programme. Asterisk indicates corresponding author. *R. Wolz is with the Department of Computing, Imperial College London, SW7 2AZ London, U.K. (e-mail:
[email protected]). C. Chu and K. Mori are with the Department of Media Science and the Information and Communications Headquarters, Nagoya University, Nagoya 4668550, Japan K. Misawa is with the Aichi Cancer Center, Nagoya 466-8550, Japan. M. Fujiwara is with the Nagoya University Hospital, Nagoya 466-8550, Japan. D. Rueckert is with the Department of Computing, Imperial College London, SW7 2AZ London, U.K. Color versions of one or more of the figures in this paper are available online at http://ieeexplore.ieee.org. Digital Object Identifier 10.1109/TMI.2013.2265805
probabilistic atlases. Usually, statistical models are learned on a training set and applied in combination with postprocessing steps that are often specialized to a particular organ. Early work on statistical shape models for organ segmentation was presented by Gao et al. [4]. In the following, enhanced shape model approaches were described for the segmentation of individual organs, e.g., [3], [5]–[7]. Recently, approaches were proposed to combine multi-organ shape- or appearance models with a hierarchical object recognition step followed by a segmentation that incorporates a global graph-cuts model [8], [9]. Using probabilistic atlases to model organ appearances was first proposed by Park et al. [10], where a statistical atlas of the liver, the kidneys and the spinal cord was shown to be able to help improve segmentation accuracy over an unsupervised approach. More recently, different approaches have been proposed that incorporate spatial a priori knowledge in the form of atlases into segmentation approaches for different abdominal organs, e.g., [11]–[15]. Work by Okada et al. [16] combines inter-organ spatial relations with different a priori models in the form of probabilistic atlases and a shape model to perform multi-organ segmentation. Wang et al. [17] propose a model that combines a probabilistic atlas with a statistical shape model for organ segmentation in mice. Population-based models in the form of statistical shape models or probabilistic atlases represent the variation in a given population. However, the generality of such models may hamper the segmentation of a specific subject in the case of high inter-subject variability. In brain segmentation, a similar observation led to move away from single atlases [18] to multi-atlas approaches [19]. Such techniques have been shown to outperform methods using only single (probabilistic) atlases by generating a target-specific model. By definition, such methods are particularly powerful in cases where registered atlases are similar to the target image [20]–[22]. Applying multi-atlas registration methods to structures that show a higher variability in global appearance than the brain, shows some inherent challenges: identifying suitable atlases plays an increasingly important role in order to avoid the atlas-target registration process to be trapped in potential local minima for an unsuitable atlas-target combination. To overcome such challenges, Isgum et al. [23] incorporate a measure of registration success into the weight for a given atlas in their multi-atlas segmentation framework for cardiac and aortic segmentation. Other approaches for multi-atlas segmentation outside of brain segmentation include different head and neck segmentation strategies [24]–[26] and the adaptive local multi-atlas segmentation approach proposed by [27] which has been applied to the heart and the caudate nucleus.
0278-0062 © 2013 IEEE
1724
IEEE TRANSACTIONS ON MEDICAL IMAGING, VOL. 32, NO. 9, SEPTEMBER 2013
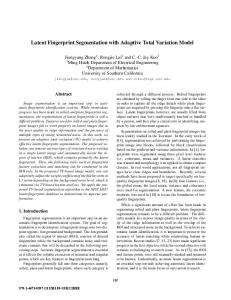
Fig. 1. Atlases are weighted on the global, organ, and voxel level. Expert knowledge is thereby used in a coarse to fine approach, allowing an improved correspondence estimation. On the global level, a binary weighting is applied while a continuous weighting is used in organ- and voxel levels (indicated in red tone). Weights at all three levels are combined to obtain spatially weighted probabilistic atlases from the set of atlas labels (right column). The final target segmentation is obtained by combining the defined spatial priors with a subject-specific intensity model in a graph-cuts based optimization step.
We present a multi-atlas registration framework that is specifically designed to address the challenges found in abdominal scans. To address the high variability in subject-specific appearance as well as the variability in field-of-view, a hierarchical model for atlas generation is described. This approach is general to the organ and is able to capture the anatomical variabilities in the available atlas database. Based on a database with manual labels, a target-specific probabilistic atlas is generated for a new subject. To capture inter-subject variability, atlases are refined on three levels: on the global level, on the organ level and on the voxel level. Based on the defined probabilistic atlas, the final segmentation is obtained by applying a model based on graph-cuts, incorporating high-level information in the form of smoothness constraints. Generating a subject-specific atlas model has several advantages over approaches that use a general, population-wide statistical model: the model can be expected to be more general both towards global subject appearance as well as organ-location and -appearance. These advantages follow from only using the prior knowledge in the model that is considered helpful at the different atlas-generation levels and for the specific target subject. A preliminary version of the presented atlas learning method has been published in conference proceedings [28]. Here, a more advanced method to estimate the final segmentation from the defined probabilistic atlases is presented together with a more detailed evaluation on a larger cohort. II. METHOD The proposed method consists of a hierarchical atlas generation step and a segmentation refinement step. Atlas labels are weighted on three scales: on the global level, the organ level and the voxel level. In the first step, the set of most suitable atlases from a database is selected for a new subject by measuring global image appearance. After aligning all preselected atlases with the target image, a local atlas weighting is carried
out on an organ-by-organ basis. Finally, a patch-based segmentation refinement is applied to weight atlas labels at the voxel level. To incorporate neighborhood smoothness constraints and high-level topological information, the final segmentation of a given structure is obtained by applying a graph-cuts based refinement step with the hierarchical probabilistic atlas as a spatial prior. A. Hierarchical Atlas Learning Given a target image , the segmentation problem is formulated by assigning each voxel , a label with anatomical labels and a background label }. The database of atlases is accompanied by binary label maps . A probabilistic atlas for structure at voxel is defined as a weighted vote of atlas labels (1) The weight is composed of the atlas weights at the three defined levels of locality (2) Note that, as defined by the weights at the three levels, is larger than zero only in a local neighborhood around . Weights are defined on the global atlas level and local weights and are assigned on organ- and voxel-level, respectively. The described hierarchical atlas weighting scheme is illustrated in the left part of Fig. 1: at the global stage, a set of atlases is selected based on overall appearance. After pairwise affine alignment, an individual atlas’ weighting is defined for every organ. Finally, the labelling at the most localized level is inferred after nonlinearly aligning atlases on an organ level and
WOLZ et al.: AUTOMATED ABDOMINAL MULTI-ORGAN SEGMENTATION WITH SUBJECT-SPECIFIC ATLAS GENERATION
by evaluating image-atlas similarities for every voxel. A stepwise coarse-to-fine registration scheme is used to ensure that atlas and target are aligned at the appropriate level of locality for the different weighting levels. Weights on all levels are based on the sum of squared intensity differences between image and atlas , defined over a region of interest measuring image appearance on the relevant level of locality (3) where defines the mapping from atlas to image . The identity transformation (i.e., no alignment) is used for the global level, and an affine alignment or nonrigid alignment issued on the finer levels as described below. B. Global Atlas Weighting For a given target image , binary weights are assigned to all atlases. This weight defines a preselection of atlases based on global appearance in order to deal with significant differences in body size and field-of-view. No alignment between images is sought before computing global atlas weights. This is to avoid registration problems when aligning images that display significantly different content. When registering two images with very different anatomies or very different fields-ofview, the optimization strategy applied in the registration algorithm may produce local minima, making the correspondence estimate challenging. Assuming the object of interest is centered in the field-of-view, which holds for a normal CT scanning procedure where subjects lay down on the scanning table, the described global strategy provides a preselection of atlases for which a pair-wise registration can be obtained more reliably. The region of interest in (3) spans the whole CT scan and weights are defined as follows: if otherwise where
where defines the number of atlases supporting the segmentation of organs with label . measures the agreement between transformed label maps after applying a nonrigid atlas-target alignment
(7) where the Jaccard index with two label sets and . is based on a similar principle to the one in the STAPLE algorithm [29] where raters that show good agreement with others are weighted higher. The main difference being that in STAPLE the confidence vote is evaluated on the voxel-level while in our approach confidence is evaluated over the whole label of a given structure, allowing independent intensity-based corrections at the voxel level. D. Local Voxel Weighting Label weights on a voxel level are assigned based on the similarity of a patch surrounding a given voxel and patches in a local neighborhood of all aligned atlas images . This nonlocal means fusion strategy was recently adapted from image-denoising to the labelling of brain MR scans [30]. A 3-D patch of size is defined around every voxel . The image similarity between this patch and patches of the same size defined around the voxels in a local neighborhood of size is evaluated on all available atlases. This results in weights defined by the patch around and the patches around voxels in atlas in the defined search window . Weights between the target voxel and atlas voxels outside the search window are set to 0. Following [30], the weights are defined as (8)
(4)
is a user-set threshold on the global image distance.
C. Organ Level Atlas Weighting Following (4), atlases that show a high similarity with the target image at the global scale are weighted with . These atlases are then aligned with the target image to perform atlas selection on the localized organ, and voxel levels, before label maps for label from atlas are transformed to the target space. The organ-wide atlas weight is the product of a term that is defined by atlas-target similarities as well as a term that is defined by the agreement between individual atlas label maps (5) The similarity-based term is defined after affine alignment of to and measures similarities over the transformed organ label (6)
1725
aligns atlas voxel with image voxel and where defines the weighting in relation to the minimal patch distance in the patch database [30]. E. Structural Segmentation The weights obtained at the global, organ and voxel level are combined to obtain the probabilistic atlas for all structures of interest for every voxel independently. To incorporate high-level structural knowledge, the final segmentation is obtained by applying graph-cuts based optimization that combines this spatial prior with an automatically estimated intensity model for a structure of interest. In graph cuts [22], [31]–[33], the flow in a graph is maximized to solve an MRF-based energy function
(9) where is a neighborhood around voxel and is the labelling of the unseen image . The data term measures the dis-
1726
IEEE TRANSACTIONS ON MEDICAL IMAGING, VOL. 32, NO. 9, SEPTEMBER 2013
agreement between a prior probabilistic model and the observed data. is a smoothness term penalizing discontinuities in . The parameter weights the influence of the data term and the smoothness term. In image segmentation, vertices in graph are defined for all voxels in image . Edges are defined between vertices as well as between each node and two additional terminal nodes , representing foreground and background. The data term exhibits a combination of a probabilistic- and an intensity-based prior [31]. Here, the data term combines the spatial prior model, i.e., the subject-specific probabilistic atlas, as well as a part that models the intensity distribution of the structure of interest [22]. The pairwise term incorporates spatial knowledge by penalizing discontinuities in grey value appearance and is based on the image intensity as well as the intervening contour probabilistic map [32]. III. DATA AND RESULTS A. Imaging Data 150 3-D abdominal CT scans acquired from 36 female and 114 male subjects were used for evaluation. All scans were acquired between 2004 and 2009 in Nagoya University hospital by a TOSHIBA Aquilion 64 scanner and obtained under typical clinical protocols for the purpose of laparoscopic resection of stomach and gallbladder glands or colon. There are three kinds of subjects in all of the 150 CT scans: 141 subjects of early or advanced gastric cancer, one subject of cholecystitis cancer and eight subjects of colorectal cancer. Subjects were aged between 26 and 84 years with a mean age of 62.8 12.0. Scans have a resolution of 512 512 voxels in plane and contain between 238 and 1061 slices depending on the field-of-view and the slice thickness. Voxel sizes range from 0.55 to 0.82 mm and the slice spacing varies from 0.4 to 0.8 mm. Reconstruction parameter is 0.5/0.4 mm. X-ray tube voltage is 120 kV and X-ray tube current is 350-400 mAs. All of the images were acquired in portal venous phase (20–30 s delayed from starting point). The starting point of scanning was decided according to the following rules: for patients who were younger than 60 years, the starting point was set as 25 s delayed from the injection point; for other patients, the scan started after 7 s when the intensity of the aorta is over 80 H.U. Scanning control is performed by utilizing Toshibas Real Prep System. Images were acquired under typical clinical conditions and therefore show typical contrast variations. Images start anterior at the lungs and are automatically cropped at 25 cm in z-direction. Reference segmentations are available for the liver, spleen, pancreas and the kidneys. B. Manual Reference Segmentation The atlases used are based on a manual annotation. All 150 subject were segmented by one out of three trained raters. Reference segmentations are based on region growing, where a spherical element is utilized to prevent excess segmentation of a target region, or graph-cut segmentation, where a set of foreground and background voxels are manually set as seed points. After the semi-automated segmentation, a manual correction process was performed on axial, coronal, or sagittal slices. Typical annotation time was 2 h per volume.
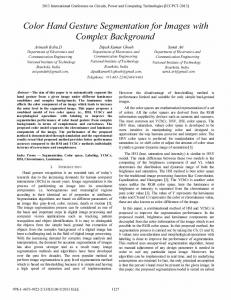
C. Experiments Results were assessed using a leave-one-out strategy in which each scan was segmented by using the remaining 149 subjects as atlas database. We have compared this strategy to a leave 20 fold cross validation (equivalent to leave 5% out). The threshold was defined in a way that 50 atlases were weighted with by the global similarity measure in (4). Correspondence is sought between atlases and target image before extracting organ- and voxel level similarities as described in (5) and (8). A rigid and affine registration step was followed by a multi-level nonrigid registration step using free-form deformations with B-spline control-point spacings of 20, 10, and 5 mm [34]. The registration is driven by the normalized mutual information (NMI) between target and source in the relevant region of interest. NMI has been shown to perform more robust than SSD for image registration, this is particularly useful when dealing with images that might show slightly varying contrast phases. NMI does not lead to any significant differences in computational burden in the used registration framework [35]. In patch-based segmentation for the voxel-level weighting (8), a patch-size of and a neighborhood size of were used and was set to the minimum patch distance as proposed in [30]. The final label at the voxel level is obtained with the graph-cuts based approach described in Section II-E. A further experiment was performed to evaluate how the proposed method deals with a smaller number of available atlases. In this experiment, the proposed scheme was applied to a restricted dataset of 50 scans randomly selected from the above described database. In a leave-one-out fashion, 17 atlases (around one third of available atlases) were weighted with by the global similarity measure before applying the segmentation strategy as described above. All parameters were set according to experience gathered in brain imaging on MRI [19], [20], [22], [30] and were not optimized for the current dataset in order to avoid a potential bias. Good results across different anatomies and modalities show the robustness of the approach. An optimization towards a particular application might improve results but would also potentially over-fit to the data at hand. In order to assess the performance on lower quality image data, an experiment was performed where the data was downsampled in dorsoventral direction. In-plane voxel spacings were kept, while slice-spacings were set to 5 mm, simulating a typical low-resolution clinical protocol. The segmentation pipeline was then run on this dataset. An example of a downsampled image together with its reference segmentation is presented in Fig. 2. Automated and manual segmentations were compared by widely used measures that all are defined by the true positive (TP) and false negative (FN) fraction and that range from 0% to 100%, namely the Jaccard index (JI), the Dice overlap (Similarity index, SI) as well as recall (REC) and precision (PRE). With being the ground truth label and the automated label, these measures are defined as , , , and . Since individual organs are segmented independently, a fusion step has to be applied to obtain the final segmentation. In
WOLZ et al.: AUTOMATED ABDOMINAL MULTI-ORGAN SEGMENTATION WITH SUBJECT-SPECIFIC ATLAS GENERATION
1727
TABLE I AVERAGE DICE OVERLAP (SIMILARITY INDEX, SI), JACCARD INDEX (JI), AND RECALL/PRECISION VALUES FOR 150 SUBJECTS AS MEAN STD [\%]. FURTHERMORE THE AVERAGE SURFACE DISTANCE IS PRESENTED AS MEAN STD [mm]
Fig. 2. Original high-dimensional data (left) and downsampled data (right).
Fig. 3. Segmentation accuracy at different stages of the hierarchical model with . an atlas database of
this step, equivocal voxels were assigned the label that exhibited the higher spatial prior. In order to assess binary segmentations at the different steps of the model, probabilistic atlases were thresholded at the 50% level, applying a majority-vote labelling [19], [21].
Fig. 4. Renderings for the liver (brown), kidneys (pink), pancreas (yellow), and spleen (red). Panel (a) shows the manual reference, panel (b) a segmentation based on thresholding the atlas obtained with the proposed method. Panel (c) shows the refined segmentation obtained with the presented graph-cuts approach. JI values for the liver, kidneys, pancreas, spleen are 93, 95, 64, 89 with no graph cuts and, respectively, 93, 95, 68, 91 with graph cuts.
the 50% level and one that is obtained after graph-cuts refinement. It can be seen how incorporating high-level spatial knowledge helps to obtain a smoother segmentation. Fig. 5 shows volume renderings for the produced probabilistic atlas at the global, organ, and voxel levels. Furthermore, the graph-cuts based segmentation is shown together with the ground truth labelling. The subject that achieved the median average label overlaps has been selected for illustration. Jaccard indexes are 88%, 83%, 34%, 79% for liver, kidneys, pancreas, and spleen, respectively. Fig. 6 shows exemplar segmentations for all organs evaluated. The best and worst segmentation results are presented together with the bottom 10% results (10% of segmentations had a lower label overlap with the reference than the presented case). For the four evaluated organs, the subject that resulted in the bottom 10% segmentation accuracy, was segmented with an accuracy of , , , and for the liver, kidneys, pancreas, and spleen, respectively.
D. Results on the Whole Dataset Average similarity measures on the whole dataset (150 subjects) between structural labels obtained with the proposed method and manual reference labels are presented in Table I. Fig. 3 gives for the four segmented structures the average Jaccard Index after the different steps of the proposed framework. Mean label overlaps and standard deviations are presented (a) between target image and all, nonaligned atlas images, (b) after global, affine atlas selection and registration (Section II-B), (c) organ-wide nonrigid registration (Section II-C), (d) voxelwise atlas selection (Section II-D) as well (d) after the graph-cuts based refinement incorporating high-level structural knowledge (Section II-E). The organ-wide result corresponds to traditional multi-atlas registration with atlas-selection and direct fusion as described above [19], [20]. Fig. 4 compares the ground truth segmentation with a segmentation obtained from thresholding the hierarchical atlas at
E. Results on the Restricted Dataset Table II presents the average Jaccard and Dice indexes between automated and reference segmentations for all structures on the restricted dataset of 50 CT scans. On a nonpaired, twotailed t-test, these results are significantly different from the ones for the whole dataset for the pancreas with 0.001 and the liver with . No significant difference is observed for the kidneys and the spleen with and , respectively. The same significance levels are observed when running a paired t-test between the 50 selected subjects and segmented in the two described settings. F. Downsampled Data Table III shows the average Jaccard index and Dice overlaps for all evaluated structures on the dataset downsampled to a
1728
IEEE TRANSACTIONS ON MEDICAL IMAGING, VOL. 32, NO. 9, SEPTEMBER 2013
Fig. 5. Panels (a)–(c): renderings of the hierarchical probabilistic atlas at the global, organ, and voxel level, respectively. Panel (d): segmentation based on graphcuts. Panel (e): ground truth segmentation.
Fig. 6. Worst, bottom 10%, and best segmentation for the four evaluated structures. On a coronal slice, the automated segmentation is outlined in yellow together with the manual segmentation in red.
TABLE II AVERAGE LABEL OVERLAPS IN % FOR 50 SUBJECTS BETWEEN REFERENCE SEGMENTATIONS AND AUTOMATED SEGMENTATIONS
G. Cross-Validation To test the influence the setup of the evaluation experiment may have on the results, we repeated the experiment on the whole, high-resolution dataset by replacing the leave-one-out sampling with a leave-5%-out crossvalidation. Results are not significantly different from the results presented in Table I. IV. DISCUSSION
TABLE III AVERAGE LABEL OVERLAPS IN % FOR THE DOWNSAMPLED DATASET BETWEEN REFERENCE SEGMENTATIONS AND AUTOMATED SEGMENTATIONS
5mm slice spacing. Results are not significantly different to the ones on the high-resolution dataset presented in Table I
Multi-atlas segmentation with selection was originally proposed for brain imaging [21]. Our method clearly outperforms this approach, when applied to the task at hand. Especially for highly variable structures like the pancreas, a substantial improvement is achieved. This is witnessed in Fig. 3 which compares results at the different levels of locality. The selection of suitable atlases is traditionally carried out on a local level [20] which corresponds to the organ-wide atlas-weighting in our method. While only a relatively small improvement is achieved on the voxel-level for organs that show a good contrast, these steps are highly relevant for the pancreas.
WOLZ et al.: AUTOMATED ABDOMINAL MULTI-ORGAN SEGMENTATION WITH SUBJECT-SPECIFIC ATLAS GENERATION
1729
TABLE IV COMPARISON OF PUBLISHED RESULTS BASED ON STATE OF THE ART SEGMENTATION METHODS
The proposed method performs comparable to state-ofthe-art organ segmentation strategies [8], [9], [15], [33], [36], see Table IV. All methods, however, are evaluated on less structures and substantially smaller, and sometimes less diverse [8] datasets. The evaluation of the models in [15] [36], are restricted to the liver and the works in [8], [9], [14] do not provide results for the pancreas which is the most challenging structure. Shimizu et al. [3] recently describe a method based on shape models that addresses this challenge, achieving an accuracy of for pancreas segmentation on a database of 20 subjects. Our model is not specialized to the segmentation of a particular organ but achieves comparable results for the segmentation of the pancreas, one potential benefit of the much more subject-specific generation of the prior model compared to previous work. The other previously proposed approach that addresses the pancreas together with other organs performs comparable on the other organs to our approach, but substantially worse for pancreas segmentation [16]. The recent, related work by Bagci et al. [8] uses a statistical shape model together with a hierarchical object recognition step to perform multi-organ segmentation. Impressive results are presented for the segmentation of the liver, the kidneys and the spleen on 20 datasets that were selected to be “as close to normality as possible.” However, since this approach employs a general, not subject-specific shape model to cover the whole population, it might be challenged by more diverse datasets. Running the method on a database of 50 subjects, i.e., selecting atlases from 49 subjects, gives comparable results for most structures. An improvement of 12 JI points can be achieved for the pancreas when increasing the number of available atlases. This is related to the high variability of this structure and underlines the importance of a hierarchical model that optimizes atlases independently for individual structures, fully exploiting the diversity of available atlases. The run-time of our method is defined by that of the nonrigid registration step. In our implementation, one registration runs for around 1 h per abdominal scan, giving an overall runtime for all organs of around 3 h on a machine with eight Intel Xeon cores clocked at 3 GHz and 32 GB RAM. A recent implementation [35] of the used registration algorithm [34] allows speed ups of around 10 fold, making the method relevant for an application in a clinical environment. One potential restriction of the proposed method is the use of the global similarity measure without an alignment of the eval-
uated images. As discussed, this makes the approach more robust against potential misregistrations and can be expected to work with typical abdominal images that are centered in the 3-D image. However, future work could be done to investigate the use of a metric that is more invariant to translations like histogram-based measurements. Combining the proposed measurement with such a strategy might further increase the robustness and accuracy of the highly important global atlas selection step. Such an approach might improve outlier results like the ones presented in the top row of Fig. 6 which are caused by a selection of not suitable atlases on the global level. Furthermore, it would be interesting to evaluate strategies, where the segmentation for multiple labels is optimized simultaneously [37], [38] or in a hierarchical manner [39]
V. CONCLUSION We propose an atlas-based technique for multi-organ abdominal segmentation. The strength of the method is its general nature which allows it to be applied robustly to multiple organs without specialization and individual parameter settings. The method is based on multi-atlas registration, a technique widely used in brain imaging. Here, we describe a hierarchical coarse-to-fine weighting strategy that is designed to deal with the challenges found in abdominal segmentation. Especially, a large inter-subject variation in abdominal appearance poses a significant challenge to image registration algorithms and therefore to correspondence estimation, the essence of atlas-based segmentation techniques. The obtained probabilistic atlases are used in a graph-cuts based model to obtain a final segmentation of a structure of interest that incorporates high-level spatial constraints. The implementation of the proposed hierarchical model leads to segmentation results that compare favorable to the state-ofthe-art on the segmentation of a large and relatively diverse image database. Reducing the number of available atlases to does not substantially decrease the performance of the algorithm for organs that do not show highly significant variation between subjects. Especially for the pancreas, however, a larger atlas database can significantly improve results. The algorithm also shows robustness towards the used image resolution, reproducing the reported results on down-sampled data with a slice thickness of 5 mm.
1730
IEEE TRANSACTIONS ON MEDICAL IMAGING, VOL. 32, NO. 9, SEPTEMBER 2013
Future work will be to evaluate a more accurate atlas selection on the global scale and to investigate other approaches to obtain the final segmentation from the generated atlases.
REFERENCES [1] R. Howe and Y. Matsuoka, “Robotics for surgery,” Annu. Rev. Biomed. Eng., vol. 1, pp. 211–40, 1999. [2] V. Pekar, T. R. McNutt, and M. R. Kaus, “Automated model-based organ delineation for radiotherapy planning in prostatic region,” Int. J. Rad. Oncol., Biol., Phys., vol. 60, no. 3, pp. 973–980, 2004. [3] A. Shimizu, T. Kimoto, H. Kobatake, S. Nawano, and K. Shinozaki, “Automated pancreas segmentation from three-dimensional contrastenhanced computed tomography,” Int. J. Comput. Assist. Radiol. Surg., vol. 5, pp. 85–98, 2010. [4] L. Gao, D. G. Heath, and E. K. Fishman, “Abdominal image segmentation using three-dimensional deformable models,” Invest. Radiol., vol. 33, no. 6, pp. 348–355, 1998. [5] L. Soler, H. Delingette, G. Malandain, J. Montagnat, N. Ayache, C. Koehl, O. Dourthe, B. Malassagne, M. Smith, D. Mutter, and J. Marescaux, “Fully automatic anatomical, pathological, and functional segmentation from CT scans for hepatic surgery,” Comput. Aid. Surg., vol. 6, no. 3, pp. 131–42, 2001. [6] T. Heimann, I. Wolf, and H.-P. Meinzer, “Active shape models for a fully automated 3-D segmentation of the liver—An Evaluation on clinical data,” in . MICCAI 2006. Berlin, Germany: Springer, vol. 4191, pp. 41–48. [7] T. Okada, R. Shimada, Y. Sato, M. Hori, K. Yokota, M. Nakamoto, Y.-W. Chen, H. Nakamura, and S. Tamura, Automated Segmentation of the Liver from 3-D CT Images Using Probabilistic Atlas and Multi-Level Statistical Shape Model. Berlin, Germany: Springer-Verlag, 2007, pp. 86–93. [8] U. Bagci, X. Chen, and J. Udupa, “Hierarchical scale-based multiobject recognition of 3-D anatomical structures,” IEEE Trans. Med. Imag., vol. 31, no. 3, pp. 777–789, Mar. 2012. [9] X. Chen, J. Udupa, U. Bagci, Y. Zhuge, and J. Yao, “Medical image segmentation by combining graph cuts and oriented active appearance models,” IEEE Trans. Image Process., vol. 21, no. 4, pp. 2035–2046, Apr. 2012. [10] H. Park, P. Bland, and C. Meyer, “Construction of an abdominal probabilistic atlas and its application in segmentation,” IEEE Trans. Med. Imag., vol. 22, no. 4, pp. 483–492, Apr. 2003. [11] X. Zhou, T. Kitagawa, K. Okuo, T. Hara, H. Fujita, R. Yokoyama, M. Kanematsu, and H. Hoshi, “Construction of a probabilistic atlas for automated liver segmentation in non-contrast torso CT images,” Int. Congress Ser., vol. 1281, pp. 1169–1174, 2005. [12] Y. Zhou and J. Bai, “Multiple abdominal organ segmentation: An atlasbased fuzzy connectedness approach,” IEEE Trans. Inf. Tech. Biomed.., vol. 11, no. 3, pp. 348–352, May 2007. [13] M. G. Linguraru, J. K. Sandberg, F. S. Zhixi Li, and R. M. Summers, “Automated segmentation and quantification of liver and spleen from CT images using normalized probabilistic atlases and enhancement estimation,” Med. Phys., vol. 37, no. 2, pp. 771–783, Feb. 2010. [14] M. G. Linguraru, J. A. Pura, V. Pamulapati, and R. M. Summers, “Statistical 4D graphs for multi-organ abdominal segmentation from multiphase CT,” Med. Image Anal., vol. 16, no. 4, pp. 904–914, 2012. [15] T. Okada, K. Yokota, M. Hori, M. Nakamoto, H. Nakamura, and Y. Sato, “Construction of hierarchical multi-organ statistical atlases and their application to multi-organ segmentation from CT images,” in Proc. MICCAI, 2008, pp. 502–509. [16] T. Okada, Y. Yoshida, M. Hori, R. M. Summers, Y.-W. Chen, N. Tomiyama, and Y. Sato, “Abdominal Multi-organ Segmentation of CT Images Based on Hierarchical Spatial Modeling of Organ Interrelations,” in Proceedings of the Third International Conference on Abdominal Imaging: Computational and Clinical Applications, ser. MICCAI’11. Berlin, Germany: Springer-Verlag, 2012, pp. 173–180. [17] H. Wang, D. Stout, and A. Chatziioannou, “Estimation of mouse organ locations through registration of a statistical mouse atlas with micro-ct images,” IEEE Trans. Med. Imag., vol. 31, no. 1, pp. 88–102, Jan. 2012. [18] D. L. Collins, C. J. Holmes, T. M. Peters, and A. C. Evans, “Automatic 3-D model-based neuroanatomical segmentation,” Human Brain Mapp., vol. 3, no. 3, pp. 190–208, 1995.
[19] R. A. Heckemann, J. V. Hajnal, P. Aljabar, D. Rueckert, and A. Hammers, “Automatic anatomical brain MRI segmentation combining label propagation and decision fusion,” NeuroImage, vol. 33, no. 1, pp. 115–126, 2006. [20] P. Aljabar, R. Heckemann, A. Hammers, J. Hajnal, and D. Rueckert, “Multi-atlas based segmentation of brain images: Atlas selection and its effect on accuracy,” NeuroImage, vol. 46, no. 3, pp. 726–738, 2009. [21] X. Artaechevarria, A. Munoz-Barrutia, and C. Ortiz-de Solorzano, “Combination strategies in multi-atlas image segmentation: Application to brain MR data,” IEEE Trans. Med. Imag., vol. 28, no. 8, pp. 1266–1277, Aug. 2009. [22] R. Wolz, P. Aljabar, J. V. Hajnal, A. Hammers, and D. Rueckert, “LEAP: Learning embeddings for atlas propagation,” NeuroImage, vol. 49, no. 2, pp. 1316–1325, 2010. [23] I. Isgum, M. Staring, A. Rutten, M. Prokop, M. Viergever, and B. van Ginneken, “Multi-atlas-based segmentation with local decision fusion—Application to cardiac and aortic segmentation in CT scans,” IEEE Trans. Med. Imag., vol. 28, no. 7, pp. 1000–1010, Jul. 2009. [24] O. Commowick and G. Malandain, “Efficient Selection of the Most Similar Image in a Database for Critical Structures Segmentation,” in MICCAI 2007. Berlin, Germany: Springer, 2007, vol. 4792, Lecture Notes in Computer Science, pp. 203–210. [25] X. Han, M. Hoogeman, P. Levendag, L. Hibbard, D. Teguh, P. Voet, A. Cowen, and T. Wolf, “Atlas-Based Auto-Segmentation of Head and Neck CT Images,” in MICCAI 2008. Berlin, Germany: Springer, 2008, vol. 5242, Lecture Notes in Computer Science, pp. 434–441. [26] L. Ramus, O. Commowick, and G. Malandain, Construction of Patient Specific Atlases from Locally Most Similar Anatomical Pieces, ser. MICCAI 2010. Berlin: Springer-Verlag, 2010, pp. 155–162. [27] E. M. van Rikxoort, I. Isgum, Y. Arzhaeva, M. Staring, S. Klein, M. A. Viergever, J. P. Pluim, and B. van Ginneken, “Adaptive local multiatlas segmentation: Application to the heart and the caudate nucleus,” Med. Image Anal., vol. 14, no. 1, pp. 39–49, 2010. [28] R. Wolz, C. Chu, K. Misawa, K. Mori, and D. Rueckert, Multi-organ Abdominal CT Segmentation Using Hierarchically Weighted Subject-Specific Atlases, ser. MICCAI 2012. Berlin, Germany: Springer, 2012, vol. 7510, pp. 10–17. [29] S. K. Warfield, K. H. Zou, and W. M. Wells III, “Simultaneous truth and performance level estimation (STAPLE): An algorithm for the validation of image segmentation,” IEEE Trans. Med. Imag., vol. 23, no. 7, pp. 903–921, Jul. 2004. [30] P. Coupe, J. V. Manjn, V. Fonov, J. Pruessner, M. Robles, and D. L. Collins, “Patch-based segmentation using expert priors: Application to hippocampus and ventricle segmentation,” NeuroImage, vol. 54, no. 2, pp. 940–954, 2011. [31] Y. Boykov, O. Veksler, and R. Zabih, “Fast approximate energy minimization via graph cuts,” IEEE Trans. Pattern Anal. Mach. Intell., vol. 23, no. 11, pp. 1222–1239, Nov. 2001. [32] Z. Song, N. J. Tustison, B. B. Avants, and J. C. Gee, “Integrated Graph Cuts for Brain MRI Segmentation,” in MICCAI 2006, ser. Lecture Notes in Computer Science. Berlin, Germany: Springer, 2006, vol. 4191, pp. 831–838. [33] M. Linguraru, J. Pura, A. Chowdhury, and R. Summers, “Multi-organ segmentation from multi-phase abdominal CT via 4D graphs using enhancement, shape and location optimization,” in Proc. MICCAI 2010, 2010, pp. 89–96. [34] D. Rueckert, L. I. Sonoda, C. Hayes, D. L. G. Hill, M. O. Leach, and D. J. Hawkes, “Nonrigid registration using free-form deformations: Application to breast MR images,” IEEE Trans. Med. Imag., vol. 18, no. 8, pp. 712–721, Aug. 1999. [35] M. Modat, G. R. Ridgway, Z. A. Taylor, M. Lehmann, J. Barnes, D. J. Hawkes, N. C. Fox, and S. Ourselin, “Fast free-form deformation using graphics processing units,” Comput. Methods Programs Biomed., vol. 98, no. 3, pp. 278–284, 2010. [36] T. Heimann, B. van Ginneken, M. Styner, Y. Arzhaeva, V. Aurich, and C. Bauer et al., “Comparison and evaluation of methods for liver segmentation from CT datasets,” IEEE Trans. Med. Imag., vol. 28, no. 8, pp. 1251–1265, Aug. 2009. [37] L. Grady, “Random walks for image segmentation,” IEEE Trans. Pattern Anal. Mach. Intell., vol. 28, no. 11, pp. 1768–1783, Nov. 2006. [38] K. Alahari, P. Kohli, and P. Torr, “Reduce, reuse, recycle: Efficiently solving multi-label MRFs,” in Proc. IEEE Conf. Comput. Vis. Pattern Recognit., Jun. 2008, pp. 1–8. [39] H. Lombaert, Y. Sun, L. Grady, and C. Xu, “A multilevel banded graph cuts method for fast image segmentation,” in Proc. 10th IEEE Int. Conf. Comput. Vis., Oct. 2005, vol. 1, pp. 259–265.