Automated characterisation system
for liquid
crystal displays M. A. Geday, X. Quintana, N. Bennis, B. Cerrolaza, D. Perez-Medialdea, J.M. Oton Depto. Tecnologia Fotonica, ETSI Telecomunicacion, Universidad Politecnica de Madrid, Ciudad Universitaria s/n, E-28040 Madrid, Spain
Phone: +34 91 549 5700 # 3414, Fax: +34 91 336 7319, Email:
[email protected]
Abstract- A complete program suite for the automated characterisation of liquid crystal displays (LCDs) has been developed in the LabView 7.1 environment. It includes routines for basic electro-optical characterisation, i.e. generation of transmission-voltage curves applying triangular waveforms while measuring the switching voltages. And it provides an easily accessible interface for design of arbitrary waveforms, both for active matrix addressing (often necessary in nematic LCDs) and for passive matrix addressing (applicable to ferro- and antiferroelectric LCDs as well as some nematic LCDs). The software includes automated methods for generation of dynamic greyscales, for measurement of grey-grey transition times and for analysis of image sticking. Index Terms-LCD characterisation, graphical user interface, automated data acquisition, arbitrary waveform generator
without loading or acquiring data. Its structure reflects the various steps in waveform design, and testing. The central user interface is the "characterisation sheet" (Fig. 1) which includes a digest of the data acquisition, or of the data loaded. This interface is the central from which the user decides what action to execute. This action may be design of waveform, capturing of response, saving or loading data, or exporting data in graphic or text format. A. Initial waveform design The waveform design interface, "the Waveform Generator" is the core of the program (Fig. 2). In this the fundamental pulses, "Master pulses" (a structure or "cluster", consisting of name and initial amplitude and duration), that are going to be employed in the waveform or waveforms if various are being
I. INTRODUCTION
DESIGNING and optimising waveforms and characterising
an electro-optical device is often a time consuming process including tedious programming of an arbitrary waveform generator and repetitive data capture using standard software provided by the oscilloscope or acquisition card manufacturer. With this in mind we have developed a programme suite that facilitates the design of an arbitrary waveform, with or without pulse constraints (such as DC compensation), the optimisation of the various pulse duration and amplitudes. The resulting waveform is subsequently used in the automated characterisation of the display or device. The interface has been developed to include to different types of waveform generators and one oscilloscope. II. PROGRAM STRUCTURE The interface has been developed to provide the most
typical elements of device characterisation, and hence apart from the more complex waveform design and optimisation the software also includes interface for simple triangular waveform generation and synchronous data capture. The program consists of 78 specifically developed subroutines or "SubVi's" of varying sizes plus standard hardware drivers and SubVi's inherent to LabView. The compiled code occupies almost 12MB on the hard disk and 70MB RAM 1-4244-0869-5/07/$25.00 (c)2007 IEEE
Fig. 1. Digest of the characterisation of an asymmetric Antiferroelectric
liquid crystal display addressed by row and column: a) the waveform (row) and the data line(column). b) the optical response when varying the data pulse amplitude. c) the dynamic grey scale, d) the pulse sequence. f) and g) quasistatic hysteresis loops (0. lHz and 1.OHz)
318
Authorized licensed use limited to: IEEE Xplore. Downloaded on March 10, 2009 at 10:46 from IEEE Xplore. Restrictions apply.
tig. 3. Greyscale generation. a) Tihe iviaster Pulses can be varied
automatically in a linear fashion or by manually editing the experiment list b). c) the labelling of the experiment for the generation of greyscale. d) The captured data of the current experiment, i.e. the optical response, the waveform and the secondary pulse. e) the captured optical responses of all the executed experiments f) graphical presentation of the various experiments g) The resulting greyscale generated at the end of all execution of all experiments.
e) Fig. 2. Waveform design. a) The Master Pulses b) Optional sequences c) Master Waveform (sequences not used in this case) d) Resulting Master Waveform pulse sequence e) Secondary waveforms and triggers f) Timeline (,us) with pulses g) Pulse sequence (pulse duration adapted to improve visibility)
The code underlying this interface is responsible for translating the sequence and scaling into pulse amplitudes and durations, that in turn are being passed on to the routines (SubVi's) specific to the waveform generators. B. Optimisation ofwaveform and greyscale generation Although the first steps of the optimisation will already be done during the design of the waveform, the major bit is done during the dynamic characterisation where relaxation and integrated intensities become clear. The interface (Fig. 3) allows for alterations in all master pulse durations and amplitudes, both static (common to all the experiments) and dynamic (changed between experiments). In a complex symmetric waveform (i.e. a waveform that is repeated with inversion of polarity), like the one depicted in Fig. 3, virtually all pulses, are subject to optimisation, with the aim of achieving a waveform that provides a small dynamic range (the voltage range between an OFF and an ON pixel), a bright ON state a dark OFF state, and little or no memory between frames, so that the intensity of any given pixel in one frame does not depend on the previous history of the same pixel. The dynamic characterisation interface generates the Master Pulse variations, which via the Waveform Generator are sent to the waveform generator. It generates the necessary data for preparing the acquisition device (typically an oscilloscope or a capture card), for the data capture, and finally it coordinates the generator and the acquisition device. Once the user has decided for a sequence of experiments to carry out the program executes each experiment in the order of a few seconds, and generates the greyscale accordingly. A total generation of a video rate greyscale is completed in less than 3 minutes. Using non-automated user interfaces greyscales were generated in 3-4 hours. C. Memory testing and grey-grey transition times Two interfaces have been developed in order to characterise
defined. In the successive optimisation and characterisation procedures, the Master Pulse amplitude and duration can be changed. The Master Pulses can subsequently be combined and scaled both in amplitude and in duration in order to generate short sequences. Both the sequences and the Master Pulses can then be used as building blocks in the final design of the "Master Waveform". The possibility of scaling the duration and amplitudes of the master pulses and sequences in the waveform design makes is trivial to design a waveform that is intrinsically DC-compensated, even if, during the optimisation of the waveform, the amplitude or duration of the original master pulse is changed. The master waveform determines the time slots for any secondary waveform, that the user whish to generate. The amplitudes of the pulses in the secondary waveform are being determined by the chosen master pulse with optional scaling. The possibility of designing secondary waveforms is intended to be used in characterisation of devices with more than one pixel. The secondary pulses may represent either neighbouring pixels in an active display where the pixels are being addressed independently or may be used to simulate a 2D multiplexed system where the pixels are being addressed in columns and rows. Already during the design of the waveform(s) it is often desirable to do a coarse optimisation of the various pulses, and/or change the sequence of pulses in the waveform. The interface caters for this by permitting sending data to the waveform generator without subsequent data capture. Only during the design of waveform it is possible to change the pulse sequence. However, in subsequent optimisation it is always possible to eliminate pulses by assigning them zero duration. 1-4244-0869-5/07/$25.00 (c)2007 IEEE
319
Authorized licensed use limited to: IEEE Xplore. Downloaded on March 10, 2009 at 10:46 from IEEE Xplore. Restrictions apply.
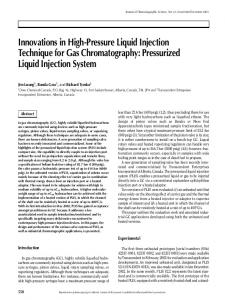
Fig. 5. Grey to grey transition interface. a) The light or voltage levels that the user want to examine. The programme then generates waveforms corresponding to all the binary combinations of chosen levels. b) The captured intensity response, and c) the calculated transition times. Note that the not all the transitions to and from the 0% intensity is reached within one frame (16.6ms).
rig. 4.lvlemory test a) ine user aeiinea sequence oI trames, iypicaiiy iU bright and 10 dark frames. The captured intensity response b) and waveform c). d) Schematic showing the proposed pulse variation and e) the waveform sent to the waveform generator. Note how the display takes several frames to return to the relaxed state. In a display this would correspond to image sticking
Systems, Inc, USA), have been incorporated into the program. As have the drivers for one oscilloscope (Tektronix TDS714L). In the near future more drivers will be incorporated in order to make the software more generally applicable to electro optics characterisation.
the dynamic behaviour of the device as if it was to be used as a live image display. Both interfaces make use of a subroutine that concatenates waveforms with modified Master Pulses. E.g. as typically used in the memory test interface (Fig 4), 10 frames with a data pulse corresponding to the dark state are followed by 10 frames corresponding to the bright state. The memory test interface has been developed with Antiferroelectric liquid crystal displays in mind. These displays are generally very fast (although the example presented is not), but show a poor contrast. The numeric output of the memory test shows how many frames are needed for complete relaxation of the display. The memory test illustrates if the display characteristics changes after longer periods of dark or bright frames. The Grey-Grey interface characterises the transition between grey levels, including the brightest and the darkest. The user select a number of levels, and the program combines them pair wise, and deduce the transition times based on the measured optical response.
IV. CONCLUSION We have presented a system capable of characterising the most important electro-optical aspects of a liquid crystal display. The system was initially designed for the
characterisation of antiferroelectric liquid crystal displays, but has been adapted to nematic crystals as well. The package has been designed in a modular fashion, which makes it easy to adapt the various sub-routines, to alternative hardware configurations or to other applications, such as organic led displays or optoelectronic devices (liquid crystal or not) used in optical communication, or to include new functionalities to the program hierarchy.
III. THE IMPLEMENTATION
The system is in daily use in the liquid crystal characterisation laboratory present at "Grupo de Fotonica Aplicada" at Universidad Politecnica De Madrid. The necessary drivers for two waveform generators (WFG500, FLC electronics, Sweden and the SRS345, Stanford Research 1-4244-0869-5/07/$25.00 (c)2007 IEEE
320
Authorized licensed use limited to: IEEE Xplore. Downloaded on March 10, 2009 at 10:46 from IEEE Xplore. Restrictions apply.