the volume of Earth Science remote sensing data has grown so large that it is ... machine learning techniques to assess quality in future intelligent archives.
A U T O M AT E D D ATA Q U A L I T Y ASSESSMENT IN THE INTELLIGENT ARCHIVE
David Isaac Business Performance Systems 7364 Clifton Road Clifton, VA 20124 Christopher Lynnes NASA Goddard Space Flight Center Code 902, Greenbelt, MD 20771
1
ABSTRACT The interpretation of science data is criticallydependent on the underlying qualityof the data. However, the volume of Earth Science remote sensing data has grown so large that it is becoming increasingly difficult to assess the quality of all of the data. The problem is compounded by the evolution of and need for increasinglyautomated knowledge extraction: in near-real-time applications there may be simplyno time to incorporate a human sanity check on the results. However, the same automated data understanding techniques that are contributing to the problem may help to solve it. We propose the incorporation of machine learning techniques to assess quality in future intelligent archives. Both supervised and unsupervised classifications are viable techniques. Supervised classifiers may be either direct, using a training set of known quality signatures, or indirect, in which geophysical classifications are used either to distinguish outliers more readily, or to simplify the search for temporal or spatial anomalies that indicate a qualityproblem. We explore in some detail the characteristics of a variety of specific machine learning methods relative to the requirements of automated data quality assessment. We also present a notional architecture of an autonomous qualityassessor within an intelligent archive. The architecture includes components to support the machine learning techniques. These include a data characterizer to prepare the data for the machine learning algorithm and a reference subsetter to extract and store reference data sets. The critical issue of distinguishing novel features from quality problems is addressed bya Corroborator component, which seeks corroborating data from other sources when such an ambiguity is identified. However, in order to realize such an architecture, more research and development is needed in the application of machine learning techniques to detecting quality problems in data.
2
CONTENTS ABSTRACT ......................................................................................................................................................... 2 CONTENTS ......................................................................................................................................................... 3 INTRODUCTION................................................................................................................................................ 4 TYPES OF QUALITY ASSESSMENT ........................................................................................................................ 4 Automatic Quality Assessment........................................................................................................................ 4 Operational Quality Assessment..................................................................................................................... 4 Science Quality Assessment............................................................................................................................ 5 POSSIBLE APPLICATIONS OF MACHINE LEARNING............................................................................... 6 REQUIRED CHARACTERISTICS ............................................................................................................................. 6 CANDIDATE APPROACHES ................................................................................................................................... 7 Supervised vs. Unsupervised Classifiers ......................................................................................................... 7 Classification Techniques .............................................................................................................................. 8 CANDIDATE APPLICATIONS ............................................................................................................................... 10 Systematic Errors vs. Random Errors........................................................................................................... 11 Violation of Logical Constraints vs. Deviation from Norms .......................................................................... 11 Specific Examples........................................................................................................................................ 12 NOTIONAL ARCHITECTURE & NEXT STEPS ........................................................................................................ 13 CONCLUSION .................................................................................................................................................. 15
3
INTRODUCTION One of the cornerstones of scientific research is the quality of the data collected. Without an adequate understanding of the data quality, it is difficult to interpret or trust the derived results. Qualityassessment of remote sensing has traditionallyrested on visualizations of the data, supported by statistical analysis. Data are then corrected if possible or flagged if not. However, the amount of data has been rising rapidly over the past decade, at a rate commensurate with Moore’s Law(i.e., a doubling every18 months). At the same time, the ability of humans to manuallyassess the data has not increased at the same rate. The inevitable result is that the portion of data that is manually assessed is steadily decreasing. Furthermore, the visualization techniques appropriate for a five-channel instrument like AVHRR are not effective or practical for hyperspectral instruments with hundreds or thousands of channels. At the same time, the requirements levied on qualityassessment are also on the increase. Automated knowledge extraction and reasoning applications by their nature have little or no human interaction in the results derivation process, making them susceptible to spurious conclusions from poor quality data. Furthermore, NASA’s vision of translating research results into near-real-time operational applications ensures that in some critical cases, no manual assessment of input data will be possible before the data are used. The increasing data volumes and quality requirements mandate an improvement in the techniques of automated quality assessment. However, it is also possible that many of the intelligent data understanding methods that are driving the increased requirements may at the same time provide part of the solution. Indeed, qualityassessment is the complement of feature detection and classification. An apparently novel feature maysometimes be a quality artifact; conversely, data may be flagged as suspect because it falls outside the norm, yet represent a novel feature. In fact, it is precisely these features which are the most important to detect, as they represent extreme conditions with significant implications. TYPES OF QUALITY ASSESSMENT
In order to understand the current state of qualityassessment in remote sensing, we examine the quality assessment concept of EOSDIS and related projects. EOSDIS is one of the larger systems processing remote sensing data, with a diversityof producers of scientific data products, and as a result, a variety of quality assessment methods. EOSDIS qualityassessment can be classified into automatic, operational, and science qualityassessment, depending on when in the production process the assessment is made. AUTOMATIC QUALITY ASSESSMENT Automatic quality assessment is applied within the production algorithm itself. The results are expressed as a variety of data-specific bitfields, flags, masks and numeric values. Normally, the qualityindicators are specified at the pixel level within the data file, with additional granule-level summaries supplied in the metadata. Because of the production environment, most of these methods are confined to operating within one data granule, employing bounds checking, neighbor comparison and curve fitting to assess quality. OPERATIONAL QUALITY ASSESSMENT Operational QA is applied by the data producer immediately after data production. The emphasis is on detecting gross production errors (e.g. unreadable files). The assessment is currently usually confined to an examination of file attributes or science metadata. However, this is the most logical point in the process to
4
insert an added level of “quick” qualityassessment, i.e., before data are inserted into the archive and distributed to users and downstream algorithms. SCIENCE QUALITY ASSESSMENT Science QA is typically performed by the instrument’s science team at a facility other than the production facility some time after the data are produced. A number of different techniques are employed, ranging from visualization to statistical analyses (trending and bias detection) to further data processing. Companion QA products or metadata updates may be sent in days or even months after the production date. While Science QA clearlyallows for the most thorough treatment of the data, it does have some limitations. For example, the EOSDIS distribution “budget” allocates system distribution capacity to send 10% of the data to the Science Computing Facilities (SCFs) performing QA. This allocation is not arbitrary, but rather indicative of the difficulty of shipping all of the data long distances to support qualityassessment. A second critical limitation is due to the time lag of science QA. Most data are distributed to users while they are “fresh” (newly minted); the request frequency of data falls off rapidlywith time. The time lag of science QA thus virtuallyassures that the data will be used before the quality can be adequately assessed. Clearly, the ideal would be if techniques of Science QA could be applied at the source of data production in near real time.
5
POSSIBLE APPLICATIONS OF MACH INE LEARNING While there are numerous tasks related to data quality assessment, not all of them are amenable to machine learning techniques. Similarly, there are numerous machine learning techniques, but not all are applicable to data qualityassessment. To identifypossible applications of machine learning, we consider the technical characteristics required for quality assessment, and reviewalternative approaches in light of those requirements. We then discuss specific data quality problems and how various machine learning techniques could be applied in each. REQUIRED CHARACTERISTICS
To be considered “intelligent”, the data archive of the future should operate effectively with minimal human guidance, anticipate important events, and adapt its behavior in response to changes in data content, user needs, or available resources. To do this, the intelligent archive will need to learn from its own experience and recognize hidden patterns in incoming data streams and data access requests. From the perspective of data qualityassessment, this notion of intelligence would be manifested primarilyin the ability of an archive to recognize data quality problems solelyfrom its experience with past data, rather than having to be told explicitly the rules for recognizing such problems. For example, the archive could flag suspect data byrecognizing departures from past norms. Even better, it could categorize data based on the type or severity of data quality problem. The archive could learn to recognize problems either from explicit examples or simply its own observation of different types of data. Another manifestation of intelligence would be the abilityof an archive to respond automatically to data quality problems. For example, significant increases in the amount of data flagged as bad or missing might indicate that the data are exceeding the bounds expected by science algorithms. (The importance of monitoring such shifts in reported data qualityis highlighted by the delayed discovery of the ozone hole1.) The intelligent archive could notify science or operations personnel so that the issue can be further examined and resolved. Taking this concept further, the archive could retrieve ancillary data to confirm a data quality problem, obtain data from an alternate source, or request that the data be recollected or reprocessed in response to confirmed data quality problems. This major step from automatic to autonomous data qualityassessment broaches the subject of intelligent operations, which is the subject of another paper in this series2. The end-goal is to provide data with an appropriate level of quality in a timelyand cost-effective manner. For Earth science data archives, this goal implies the following additional requirements: •
Ability to work with both spatial and temporal data. This is a significant challenge, but fortunately it can be met at a variety of levels and facilitated by simple data transformations. At the simplest level, the ability to deal with spatial or temporal variables as names or numbers—independent of any real notion of space or time—may be sufficient. Virtually all machine learning techniques can meet the requirement at this level. The more complex level of true spatial and temporal reasoning (e.g., understanding that geospatial data exhibits diurnal and annual periodicity) is much harder. For example, many machine learning techniques have difficulty with periodic patterns, such as the notion that months are ordered yet month 12 is “close” to month 1. While relatively simple data preparation (e.g., extracting the season explicitlyfrom a timestamp) can help machine learning algorithms reason over
6
cycles in the variables, this approach is only partially effective for temporal variables and even less effective for spatial variables. •
Ability to work with continuous and categorical variables. Earth science data includes a mix of continuous and categorical variables for both dependent and independent variables, so we will require algorithms that work with both. With regard to independent variables, we note that temporal variables can be effectively represented as either categorical or continuous data (e.g., December = 12), so the choice of machine learning algorithms is not limited in this regard (though algorithms that assume categorical variables are ordered should work particularlywell). However, effective spatial reasoning will require algorithms that work well with continuous independent variables (i.e., latitude and longitude), because too much information is lost if location is converted to a categorical variable. Fortunately, algorithms that work with continuous independent variables exist for all machine learning methods of interest. With regard to dependent variables, we will require algorithms that work well with both continuous and categorical data, depending on the application. While it is possible to convert continuous variables into categorical variables for symbolic reasoning (e.g., by binning), it is generallynot reasonable to perform this conversion on the science data itself for two reasons. First, there is a significant loss of information in this process, particularlyif the binning process is not tailored specifically to the domain of the data. And second, obtaining adequate resolution can drive up the number of bins, which in turn drives up the computational cost of rule induction and other machine learning tasks. Algorithms that work only on categorical variables will be relegated to performing QA on summary data or on science data that is inherently categorical (e.g., land cover classes).
•
Fast and efficient operation. Some current applications require data to be delivered within an hour, so a reasonable requirement might be to assess the data quality of a relativelylarge amount of data (say100GB) within a few minutes. Although machine learning algorithms are notoriously compute intensive, this requirement is easily met in a number of ways. First, it is important to note that the computational effort associated with most machine learning algorithms is related to deriving rules or “training” the system; the rules themselves are generallysimple (in computational terms) to apply in an operational mode. If QA is a function of applyingthe rules, rather than derivingthe rules, then the computational complexity associated with deriving the rules is not an issue, because this can be done on a subset of the data in an “off-line” process. Second, it is sometimes possible (and desirable) to extract key characteristics or summaries of the data (e.g., an average value for an entire data granule) and perform QA on this much-reduced data. CANDIDATE APPROACHES
There are numerous machine learning methods, techniques, and algorithms that can be applied to data qualityassessment. In this section we discuss various approaches, and the applicability of each in light of the required characteristics identified in the prior section. The qualityassessment problem is primarilyone of classification, as indicated bythe prevalence of “flag” types rather than numerical quality indicators. As a result, we focus on classifiers, though numerical predictors may be useful in intermediate steps in the qualityassessment process. SUPERVISED VS. UNSUPERVISED CLASSIFIERS Supervised classifiers require a training set of data that has already been classified through another means, such as human interpretation or direct observation. Algorithms of this type include k-nearest neighbors3, back-propagation neural networks4, certain genetic algorithms5, and soft independent modeling of class analogy6. They might actuallybe used in a number of different
7
ways. The most direct application is to train the classifier on data with known quality signatures. This approach has a keyadvantage relative to unsupervised classifiers: they can incorporate information not available in the data to be classified (e.g., determination that a set of data is “good” or “bad” based on derived data products or human judgment). This provides additional flexibilityin the use of these algorithms, plus the opportunity to refine the quality assessment process over time in a directed manner by adding newexamples to the training data set. On the other hand, accumulating a sufficient training set presents a challenge, as the high data rates in remote sensing discourage human evaluation on a per pixel basis. In some cases, an alternative exists: further processing downstream may produce results that are more clearly recognizable as non-physical or beyond acceptable thresholds. An example of this principle is MODIS Oceans processing, which uses Level 3 data (globallygridded parameters) to derive implied quality at level 2 (swath-based geophysical parameters) and level 1 (calibrated radiance)7. Supervised classifiers might also be used in an indirect manner. For example, one might classify all of the data according to a set of positive geophysical categories (e.g., land cover classifications); pixels that cannot be easilyclassified into a category maythen be signs of quality problems such as random events or mixed contributions. However, it is important not to confuse quality problems with trulynovel features. Another indirect approach based on geophysical categorization is to look for anomalous variations in time and space of pixel classifications, such as sudden changes from agricultural to boreal in a given location, or an isolated agricultural pixel amongst snow pixels. Unsupervised classifiers generate classes directly from the observed data, a process commonly called “clustering”. Algorithms of this type include K-means clustering8, Kohonen neural networks9, probabilistic categorization trees (e.g., COBWEB10), unsupervised Bayesian classifiers (e.g., AutoClass11), and principal components analysis12. An advantage of unsupervised classifiers in general is that they can identify newclasses that may not have been defined a priori. Potentially, this technique could identify anomalous data sets without explicit training, either by directlyidentifying separate clusters for “typical” and “unusual” data, or byidentifying normal clusters that can be used as references to identifyoutliers in a data stream13,14. The implied benefit is less human effort (that is, no need to identify different classes of data quality problems and good training examples of each) plus the potential to identify data qualityproblems not previously considered. CLASSIFICATION TECHNIQUES NAÏVE BAYES CLASSIFICATION
Naïve Bayes classification is a supervised technique for ranking alternative hypotheses based on Bayes Theorem, which states that the evidence confirms the likelihood of a hypothesis only to the degree that the evidence would be more probable with the assumption than without it. Bayes’ formula is: prob(X|Y,I) = prob(Y|X,I) × prob(X|I) / prob(Y|I), that is, the posterior probability is proportional to the product of the likelihood function and the prior probability. In supervised Bayes classification, we begin with a training set where each evidence (data) vector E has been assigned to a class C. Training consists of computing the probability density function for each combination E i and C, i.e., Pr(E i |C), and the overall probability for each class. The forward application of the classifier computes the probability for each possible class C as: Pr(C|E) = P Pr(E i |C) × Pr(C) / Pr(E)
8
(In practical applications, the denominator is often bypassed by normalizing over all the classes.) Technically, this comparative approach introduces a number of constraints related to the variables that maybe violated in data quality assessment applications, including conditional independence, non-zero probabilities, and a prior probability distribution (or, equivalently, a large/representative training set). In practice, however, Bayesian classifiers often perform well compared to more sophisticated methods, even when these conditions are violated somewhat.15 A particularly difficult condition to meet for remote sensing data is conditional independence; for example, adjacent spectral bands in spectroradiometers are often highly correlated. One approach that addresses this issue is Selective Naïve Bayes classification, which incorporates forward selection, that is, adding attributes or channels one at a time, discarding those which do not add to the solution16. PROBABILISTIC NETWORKS
Probabilistic networks (e.g., Bayesian networks17) are directed acyclic graphs where the nodes represent assertions and the arcs represent causal belief (i.e., the probability that a value of one node causes a given value in another node). As such, they would appear to have good applicabilityto data quality assessment in cases where there are a number of known factors that determine the resulting quality of a set of data. A special case of this is when corroboration is needed to confirm a data quality problem: the nodes could represent features, events, or quality-related factors extracted from several data sources, and the arcs could represent judgments about data qualityin light of the additional evidence. NEURAL NETWORKS
Neural networks perform classification using nodes that perform a simple transfer function connected either in a non-recurrent structure (i.e., without feedback, such as feed-forward/backpropagation networks) or a recurrent structure (e.g., Kohonen self-organizing maps). Back propagation networks are supervised classifiers while Kohonen self-organizing maps are unsupervised classifiers, and thus each inherits the advantages and disadvantages discussed above. Hopfield networks use a recurrent structure to implement associative memories and have also been used for unsupervised classification, but their applicability to data quality assurance is probably limited. Neural networks work well with continuous data, which can be an advantage for data quality assessment in Earth science archives. Neural networks can also handle categorical data, albeit awkwardly, by mapping each category value to a separate node and representing the value itself as 0 (not present) or 1 (present). Neural networks can be used on temporal data through the use of “sliding window” techniques or recurrent network structures.18 RULE INDUCTION
Rule induction is a supervised classification technique that involves learning general rules to describe specific examples. There are a wide variety of methods. Some take a top-down approach (i.e., building from the least restrictive clause to more restrictive clauses) while others take a bottomup approach. Some build decision trees, while others build more general sets of if-then rules. Example algorithms include FOIL and RDT (top-down induction of Horn clauses); C4.5, ID3, and CART (top-down induction of decision/regression trees); GOLEM and PROGOL (bottom-up induction of Horn clauses); and CHAID (bottom-up induction of decision trees). Many rule induction algorithms work well with either categorical or continuous independent variables, an important capabilityas noted in the prior section. We note that regression tree algorithms (which
9
work with continuous dependent variables) will be suited for different quality assessment problems than algorithms that work onlywith categorical dependent variables. We also note that generalized rule induction algorithms are perhaps more flexible than those based on decision trees because the resulting rules are not constrained to a tree representation…although the importance of this flexibilityin the context of data quality assessment is not clear. Finally, we note that through flattening techniques, most rule induction algorithms can be used to identify temporal relationships.19 SUPPORT VECTOR MACHINES
Support Vector Machines use a structural risk minimization principle and kernel functions to perform regression, classification, and density estimation. This method finds a hyperplane with maximal margin between the training examples (where the examples closest to the hyperplane are called “support vectors”). It is general in that a variety of kernel functions (i.e., any function that can be reduced through transformations to an inner product of vectors) can be used to perform complex mappings of data into a feature space where a hyperplane can be used to separate the classes. This enables support vector machines to learn polynomial classifiers, radial basis function classifiers, twolayer sigmoidal neural nets, etc. In terms of handling categorical and continuous data, they are similar to neural nets, and thus would likely have similar applicability to various data qualityassessment problems. GENETIC ALGORITHMS
Genetic algorithms use a process analogous to evolution (including recombination, mutation, and suitability tests) to select values or combinations of items that best meet some set of criteria, such as accuratelyclassifying data. The technique is veryflexible, so the items manipulated can be more than simply attribute values: combining and selecting whole functions is also possible. In the simplest case, we can envision a small set of simple statistical functions that can be automatically “evolved” to identify data anomalies (e.g., an average value differing significantly from the norm). An advantage of genetic algorithms is that they readilyaccommodate functions involving inequalities and discontinuities (e.g., for range checking or threshold detection), which can be particularlyuseful in data qualityassessment. Another advantage is that the basic functions used in the algorithm can be selected to correspond to known phenomena in science data, which can enhance interpretability of the results. Finally, genetic algorithms can be used to find predictive patterns in categorical timeseries data without the need to reformulate the problem (via data transformations) into a concept learning problem.20 Genetic algorithms can also be considered a meta-learning strategy that can be applied to other techniques (e.g., to train a neural network). LAZY LEARNING TECHNIQUES
Lazylearning techniques (such as k-nearest neighbors) defer classification until an item to be classified is processed (e.g., by identifying the class label of the K most similar items in the classification set. These techniques are probably not applicable to quality assurance in large archives because too much computation is deferred until the actual time of classification. CANDIDATE APPLICATIONS
In this section we attempt to identify where machine learning can be effectively applied to data quality assessment. To do this, we consider the strengths and weaknesses of machine learning in general, plus the characteristics of specific methods against the challenges posed by different types of data quality problems. The goal is not to be comprehensive, but to generate ideas for future research
10
in this area. We consider different types of errors in terms of when they occur (random vs. systematic) and how they are manifested (violations of logical constraints vs. deviation from norms). In general, we will want to focus on detecting errors that are unlikelyto be found in a timely fashion through normal usage of the data and where the cost of latent errors is high. Good candidates include 1) systematic errors that occur under complex conditions, are evident onlyfrom an unusual perspective, or need to be found early; and 2) random errors that can be made more apparent when deterministic fluctuations in the data are factored out. The following sections explore these issues in more detail. SYSTEMATIC ERRORS VS. RANDOM ERRORS Systematic errors are those that appear regularlyin the data under a given set of conditions. An example systematic error is incorrectly classified pixels at land/water boundaries, perhaps due to detector response characteristics or errors in the science algorithm.21 Such errors can be very hard to detect (in a general sense) using machine learning approaches because identifying a problem may require relativelydeep scientific knowledge about what can be induced from the data. At the same time, such errors are often easilydetected by the users because if the governing conditions occur frequently, the problem will manifest itself frequently. Thus, detecting systematic errors does not initiallylook like a good application for machine learning. There are three mitigating factors. First, some systematic errors can be subtle in the context of normal uses of the data but easilyidentified from a fresh perspective. For example, data that appears normal when viewed as a spatial image at a given point in time can easilybe seen to have severe clipping or discontinuities when viewed as a time series at a given location. We speculate that machine learning algorithms, particularlyregression tress and unsupervised classifiers, can provide this fresh perspective. Second, the conditions under which a systematic error occurs can be so complex that the error appears to users to be random: identifying such complex patterns is the forte of machine learning. Finally, a substantial amount of time can elapse before users examine the data and discover an error, at which point opportunities to re-acquire the data mayhave passed or the erroneous data may have alreadybeen incorporated into numerous other data products or decisions. Thus, in cases where there is a significant cost to latent errors in the data, there may be an argument for automated qualityassessment even when the error would certainly be found later by users. Random errors are those that appear irregularlyin the data under a given set of conditions. An example is a sudden variation in a data value caused by data corruption.22 Such errors are relatively easy to detect using statistical approaches because one only need detect sudden changes from normal values. At the same time, these errors can easily hide from users in the large volumes of data in the archive if they occur infrequently. In the Earth science domain, detecting random errors is significantlycomplicated by the natural fluctuations present in the data, which can have many of the same attributes as anomalies. We speculate that machine learning techniques can be applied in several ways to assist with this problem. For example, they could be applied to adaptivelydetermine what values are “normal” at a given time or location, and thus provide a baseline for exposing anomalies. VIOLATION OF LOGICAL CONSTRAINTS VS. DEVIATION FROM NORMS Violations of logical constraints covers a broad set of errors, some of which are good candidates for data quality assessment based on machine learning, and some of which are not. Simple constraints (e.g., a set of percentages should not total more than 100%) are probably best checked by simple rules based on the domain of a variable; there is no clear value for machine learning here. At the other end of the spectrum are logical constraints that require relativelydeep knowledge about
11
physical processes that cannot be derived from the data stream itself (e.g., ocean temperatures should not be above boiling); rules developed by human experts may be best here. In the middle, however, are a large number of moderately complex constraints that could be learned from the data because they represent deviations from the norm (e.g., forest in the Sahara or snow in subtropical India are unlikely). While such rules will often be intuitive to a person with even modest knowledge of the domain, machine learning techniques (particularlyunsupervised classifiers) could relieve the data quality analyst of the burden of identifying a comprehensive set of rules, and could automatically adapt to observed changes in the data as well. A related approach would be to store normative examples (rather than derived rules) and use statistical or lazylearning techniques to identify deviations from the norm or similarities to known bad datasets. SPECIFIC EXAMPLES Following are four examples based on real data quality problems that serve to illustrate the general classes of data quality problems discussed above, drawn from the MODIS Land qualityissues database.23 Candidate approaches are discussed within the context of the unique challenges associated with each problem. The point of this discussion is to provide a concrete basis for judging the applicability of machine learning to data qualityassessment and to stimulate further exploration of this topic. •
Detection of unusual data values. An example scenario is detecting an unusuallysmall data file resulting from premature termination of processing due to corrupted data. In this case, the data may be correlated with other item attributes (e.g., file size by file type), but they are not part of a time series. In general, it seems likely that unsupervised classifiers would be appropriate because they eliminate the need to have explicit examples of bad data, which relieves us of finding or synthesizing errors for the potentially large number of items to be monitored. The classifier could learn the fundamental statistical properties of the data stream (min, max, etc.). Genetic algorithms, k-means clustering, and support vector machines are good candidates. The trick is to assume that the majority of data is “normal” and to find a general distance metric that segregates outliers.
•
Detection of geophysically illogical values in spatial data. An example scenario is detecting values that indicate substantial vegetation in areas of ice, snow or desert caused by algorithm errors under certain data conditions.24 This is a specific case of a systematic violation of a logical constraint, and thus (as indicated above) it is generally not a good candidate for quality assessment based on machine learning. Nonetheless, we can envision two approaches to detecting such problems using machine learning. First, rule induction could be used to identify relationships between data values at the same geo-location in two different data sets (e.g., snow/ice and vegetative index). Exceptions to these rules (e.g., vegetation on permanent ice) could be flagged as possible data quality problems. Second, in the case where the breakdown in the algorithm is caused by a transient phenomenon (e.g., cloud cover), rule induction could be used to learn typical relationships between categorical values at the same location in the same data product but taken at different times (e.g., deforestation can happen quickly but reforestation does not). For categorical data, the consolidated representation of the rules could take the form of a Markov chain. Again, exceptions to these rules (e.g., instant reforestation) could be flagged as possible data quality problems.
12
•
Anomaly detection in time series data. An example scenario is detecting abnormallylowsurface reflectance values caused byimproper handling of missing or corrupt data following a disk crash25. This problem is similar to detecting unusual data values (above), with the additional opportunity (and complexity) of judging data values within the context of a time sequence. Other complicating factors include the fact that wide variations are expected to occur depending on location (esp. depending on the Earth surface characteristics) and time (including seasonal variations). Although statistical methods have been studied for quite some time26, we speculate that a machine learning approach will provide more robust models with lower false alarm rates. Machine learning has been successfully demonstrated for anomaly detection in noisytime series (e.g., for the purpose of network intrusion detection27), but many of the methods are designed to work on categorical data, which would require binning of the continuous data in the scenario considered here. In general, it seems likelythat unsupervised classifiers would be appropriate because they eliminate the need to have explicit examples of bad data, which is important given that we cannot say what anomalies might occur in a given data stream. In addition to learning the fundamental statistical properties of the data stream (min, max, etc.), the classifier could learn the typical value sequences or other time-dependent characteristics. Genetic algorithms, k-means clustering, and support vector machines are good candidates. Given the data volumes typical in remote sensing data archives added to the fact that data tends to be organized first bylocation and second by time, we will want a method that minimizes the number of samples that must be examined at a given time to detect an anomaly (ideally, only one). Because of all these factors, detecting complex patterns that are considered “surprising” within the context of a time series remains an area of active research with promise in the long term.28
•
Detection of raster artifacts in spatial data. An example scenario is detecting striping associated with instrument scan lines caused by improper handling of high aerosol levels by an instrument or algorithm29. This problem has been examined in the context of image analysis and visual quality inspection.30 By characterizing the image with appropriate visual descriptors (e.g., using a Hough Transform), one can use a variety of supervised or unsupervised classifiers to segregate normal and bad images. Any method that works well with continuous variables could be applied, including regression trees, neural networks, and support vector machines. Alternatively, a feed-forward/back-propagation neural network or support vector machine could be trained to directly recognize problems in the spatial data. NOTIONAL ARCHITECTURE & NEXT STEPS
The discussion above indicates a great deal of promise for the application of machine learning to data quality assessment. We conclude that the intelligent archive of the future will include a component that participates in the data qualityassessment process, perhaps automating a limited number of checks initiallyand evolving over time toward greater autonomy. Machine learning algorithms are a core component of an autonomous QA system; however, they must be incorporated in an architecture and operations concept that can make use of them. For instance, many such algorithms require some data preparation in the form of selection, subsetting and transformation. Likewise, several techniques relyon reference datasets to detect anomalies. The following
13
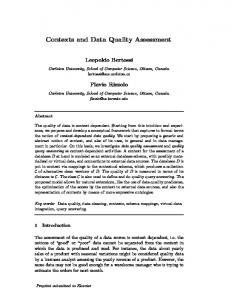
notional architecture diagram depicts a machine-learning based qualityassessment architecture, including such support components. This architecture in Figure 1 highlights the importance of three support components specifically needed for automated data qualityassessment. The first is a Data Characterizer that extracts from each data set those characteristics thought to be correlated with data quality. This information can be used either to augment or summarize the data to improve the performance of automated data quality assessment. The Data Characterizer also transforms variables when necessary to make them more amenable to machine learning. The second is a Reference Subsetter, which captures and stores reference data sets. These data sets can be used for lazylearning and search-based techniques, as well as a basis for detecting time-series anomalies. The third element, the Corroborator, is used to distinguish between unusual (but real) features and qualityartifacts. When such an ambiguityis recognized, the Corroborator seeks other sources of data to resolve the ambiguity. These maybe data collected from different kinds of instruments, assimilations or models, or even other elements from within a constellation of similar sensors. In some cases, the data request mayeven lead to the tasking of an instrument to collect additional data
Data Data Data Provider Provider Provider
Data request
Intelligent Archive Quality Assessment
Data
Temporal categories Spatial categories
Data Characterizer
Basic statistics Image/data characteristics Reference datasets Rules
Rules
Corroborator
LearningBased
Reference Subsetter Archive
Machine-
Possible artifact
Quality
Quality Assessment
Assessor
Stored Rules
Data Catalog
Product Metadata
Possible artifact
Quality Analyst to corroborate a finding. Figure 1. Notional data qualityassessment architecture including machine learning.
14
CONCLUSIO N A number of interesting challenges remain before the notional data quality assessment architecture can be realized in a working system. One of these is the understandable tendency of investigators to focus on the detection of interesting features with machine learning algorithms, rather than the search for quality problems. While there is clearly much work to be done in the former area, the latter is virtuallyunexplored. If NASA is to reach its goal of applying science research to real-time applications for transition to operational agencies, a robust, automated quality assessment capabilityis essential. In many cases, the research and development on applicable technologies is alreadyunderway; all that would be needed is a shift in focus. A number of potential areas bear investigation: •
the performance of specific algorithms on representative data quality problems using real data
•
the theoretical basis and algorithmic approaches to identifying anomalies and patterns in geo-temporal variables
•
identifying appropriate information-preserving transforms for spatial and temporal variables to facilitate pattern recognition
In addition, a number of architectural issues need to be addressed, such as the appropriate transformations for the “data characterizer” and how to connect general-purpose data quality assessment algorithms to a wide variety of complex data streams. Although optimal solutions are probably out of reach, workable solutions are not. A modest amount of effort could address the remaining challenges sufficiently to bring us substantiallycloser to realizing the vision of an intelligent archive.
15
REFERENCES
1 “Space Based Observations from Earth”, 2001. In the Encyclopedia of Astronomyand Astrophysics, Nature Publishing Group.
Morse, S., and D. Isaac, 2002. “Optimizing Performance in Intelligent Archives” (unpublished), Contract NAS599001.
2
3
K. Fukunaga, 1990. Introduction to Statistical Pattern Recognition, 2nd ed. Boston: Academic Press.
Liu, Z. K. and J. Y. Xiao, 1991. “Classification of Remotely-Sensed Image Data Using Artificial Neural Networks”, International Journal of Remote Sensing12, p. 2433-2438.
4
De Jong, K. A.. W. M. Spears, and D. F. Gordon, 1993. “Using Genetic Algorithms for Concept Learning”, Machine Learning, 13, p. 161-188.
5
6
139.
Wold, S, 1976. “Pattern Recognition byMeans of Disjoint Principal Components Model”, Pattern Recognition 8, p. 127-
Kilpatrick, K., 2000. The MODIS OCEANS Quality Assurance Plan, http://modisocean.gsfc.nasa.gov/qa/MODOCEANS_QA_PLAN_V2.html.
7
MacQueen, J., 1967. “Some Methods for Classification and Analysis of Multivariate Observations”, Proc. 5th Berkeley Symp. Math. Statist. Prob., 1, p. 281-297.
8
9
69.
Kohonen, T., 1982. “Self-organized Formation of Topologically Correct Feature Maps”, Biological Cybernetics, 43, p. 59-
10 Fisher, D., 1987. “Improving inference through conceptual clustering”, Proc. 1987 AAAI Conf., Seattle, WA, July 1987, p. 461-465.
P. Cheeseman, J. Kelly, M. Self, J. Stutz, W. Taylor, & D. Freeman, 1988. “AutoClass: A Bayesian Classification System”, Proc. of the Fifth International Conference on Machine Learning, Ann Arbor, MI. June 12-14 1988, San Francisco: Morgan Kaufmann, p. 54-64.
11
12
Cooley, W. W., and Lohnes, P. R., 1971. Multivariate data analysis. NewYork: Wiley.
Knorr, E. M., and R. T. Ng, 1998. “Algorithms for Mining Distance-Based Outliers in Large Datasets”, VLDB'98, Proc. of the 24th Int. Conference on Very Large Databases, Aug 24-27, 1998, New York City, NY, p. 392-403.
13
Ramaswarny, S., R. Rastogi, and K. Shim, 2000. “Efficient Algorithms for Mining Outliers from Large Data Sets”, Proc. of the ACM Sigmod 2000 Int. Conference on Management of Data, Dallas, TX.
14
15
Friedman N., D. Geiger, and M. Goldszmidt, 1997. “Bayesian Network Classifiers”, Machine Learning, 29, p. 131-163.
Langley, P., and S. Sage, 1994. “Induction of selective Bayesian classifiers”. In Swartout, W., ed., Proc. Tenth National Conference on Artificial Intelligence, San Jose, CA. Menlo Park, CA: AAAI Press, pp. 223-228.
16
Heckerman, D., D. Geiger, and D. Chickering, 1995. “Learning Bayesian Networks: the Combination of Knowledge and Statistical Data”, Machine Learning, 20, p. 197-243.
17
18
Biggus, J. P. 1996. Data Miningwith Neural Networks. McGraw Hill.
16
Karimi, Kamran, and Howard J. Hamilton, “Finding Temporal Relations: Causal Bayesian Networks vs. C4.5”, International Symposium on Methodologies for Intelligent Systems, 2000.
19
Weiss, GaryM., and Haym Hirsh, 1998. “Learning to Predict Rare Events in Categorical Time-Series Data”. Papers from the 1998 AAAI Workshop, Predicting the Future: AI Approaches to Time-Series Problems,Technical Report WS-9807, AAAI Press, 83-90. For a discussion of transformation methods, see Dietterich, T., and Michalski, R. 1985. “Discovering Patterns in Sequences of Events”, Artificial Intelligence, 25:187-232.
20
Case DR_MOD12_01122 “Systematic unclassified pixels found to the West of Eastern shores in Land_Cover_Type_1 of MOD12Q1” and Case SD_MOD10_01003 “Rivers labeled as snow”, in MODIS Land Data Quality Issues Database, http://landdb1.nascom.nasa.gov/QA_WWW/newPage.cgi?fileName=terra_issues. 21
22 Case JB_MOD09_01305 “Probable corrupt band 5 data for day2001146 in MOD09GHK” in MODIS Land Data Quality Issues Database, http://landdb1.nascom.nasa.gov/QA_WWW/newPage.cgi?fileName=terra_issues.. 23 MODIS Land data quality issues database, http://landdb1.nascom.nasa.gov/QA_WWW/newPage.cgi?fileName=terra_issues.
Case JB_MOD13_01138, “Snowand Cloud problem in EVI”, in MODIS Land Data Quality Issues Database, http://landdb1.nascom.nasa.gov/QA_WWW/newPage.cgi?fileName=terra_issues.
24
25 Case JB_MOD09_01305, “Probable corrupt band 5 data for day 2001146 in MOD09GHK”, in MODIS Land Data Quality Issues Database, http://landdb1.nascom.nasa.gov/QA_WWW/newPage.cgi?fileName=terra_issues. 26
Fox, A., 1972. “Outliers in time series”, Journal of the Royal Statistical Society, Series B 34, 350-363.
Eskin, E., A. Arnold, M. Prerau, L. Portnoy and S. Stolfo. “A Geometric Framework for Unsupervised Anomaly Detection: Detecting Intrusions in Unlabeled Data.” Data Miningfor SecurityApplications (DMSA-2002). Kluwer 2002. . See also various papers in Proceedings of ACMCSS Workshop on Data MiningApplied to Security(DMSA-2001). Philadelphia, PA: November 5-8, 2001.
27
Keogh, E., Lonardi, S., and Chiu, B., “Finding Surprising Patterns in a Time Series Database in Linear Time and Space”, 2002 (unpublished).
28
29 Case JB_MOD09_01277 “Striping in areas with high atmospheric aerosol content”, n MODIS Land Data Quality Issues Database, http://landdb1.nascom.nasa.gov/QA_WWW/newPage.cgi?fileName=terra_issues. 30 Bariani, M., Cucchiara, R., Mello, P., and Piccardi, M., “Data Mining for Automated Visual Inspection”, 1997 (unpublished).
17