Automated decision tree classification of keratoconus from videokeratography Michael D. Twa, OD, MS, Srinivasan Parthasarathy, PhD, Mark A. Bullimore, MCOptom, PhD, Cynthia Roberts, PhD, Ashraf M. Mahmoud, Tom Raasch, OD, PhD, and David J. Schanzlin, MD College of Optometry The Ohio State University:
[email protected]
1
INTRODUCTION
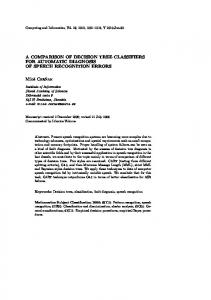
We excluded eyes that did not have videokeratography examination data or cases where the videokClassification and prediction are common tasks in the eratography examination data clearly contained arbiomedical sciences. Several machine learning classi- tifacts due to obstruction of the corneal surface by fication methods exist including Bayesian classifiers, the eyelids. All other eligible cases were included. decision trees, neural networks, statistical regression, Normal eyes were selected sequentially from healthy and others.1 Each approach has unique strengths patients that presented for surgical correction of rethat make it more or less appropriate for a particular fractive error during the same time interval. We inclassification problem. Decision trees have emerged cluded cases that were myopic with or without astigas one of the most versatile and robust classification matism, had videokeratography examination data, methods,2 and have been widely applied to medical and had no other documented ocular disease. No normal eyes were excluded because of missing or poor diagnosis problems. We have developed a quantitative method of quality videokeratography data. corneal shape classification to discriminate keratocons from normal videokeratograhy.3, 4 This decision 2.2 Data Preprocessing tree induction method can be applied to the raw data output from any videokeratography instrument plat- We exported videokeratography data from a single form, and could be used to analyze both group and image consisting of elevation, angle and radial posilongitudinal data. In this study we describe an alter- tion coordinates from the Keratron corneal topogranative method of corneal shape classification based pher (v3.49, Optikon 2000, Rome, Italy). The data upon Zernike polynomials and compare performance from each examination consisted of 6,900 individual of this classification method with existing classifiers points in a 3-dimensional polar coordinate gird. In for a sample of normal eyes and eyes diagnosed with addition to the elevation data we recorded the axkeratoconus. ial curvature valued associated with each individual point. To model the corneal surface we computed a 10th order expansion of Zernike polynomials over the cen2 METHODS tral 5 mm from the exported elevation data using methods described by Schweigerling et al.6 We lim2.1 Patient Selection ited our area of analysis to the central 5mm to insure All keratoconus patients selected for this study were complete data over the area of analysis for all eyes in examined between August 1998 and January 2000. this sample. We first identified potential patients from ICD-9 diagnosis codes and then confirmed their diagnostic clas- 2.3 Decision Tree Classification sifications by chart review, applying diagnostic criteria established by the Collaborative Longitudinal A decision tree is a collection of if-then conditional Evaluation of Keratoconus (CLEK) study.5 The oc- rules for assignment of class labels to instances of a ular findings that defined keratoconus were: (1) an data set. Decision trees consist of nodes that specify irregular cornea determined by distorted keratome- a particular attribute of the data, branches that reptry mires, distortion of the retinoscopic or ophalmo- resent a test of each attribute value, and leafs that scopic red reflex (or a combination of these); (2) at correspond to the terminal decision of class assignleast one of the following biomicroscopic signs: Vogt’s ment for an instance in the data set (Figure 1). striae, Fleischer’s ring of >2 mm arc, or corneal scarWe used C4.5, a decision tree induction algoring consistent with keratoconus. rithm, to construct a classifier for our data set. The
data were structured as rows of records for each eye (records) and columns of Zernike coefficients (attributes). We selected Zernike polynomial coefficients to represent corneal surface features and used the magnitude of these coefficients as a basis to discriminate between normal and keratoconus records in our record set. Each record of the data set was labeled with a known class assignment from chart review. The C4.5 algorithm is a supervised machine learning method where information about true class assignments are known during construction of the classifier. The algorithm begins with all records in a single pool, a heterogeneous collection of both normal and keratoconus records. The C4.5 algorithm then iteratively selects individual attributes and their values to determine a best separation of the records.The benefit of using the C4.5 decision tree induction algorithm is automated selection of the most relevant Zernike coefficients and discovery of the coefficient value necessary for optimal class separation. We have previously described our decision tree induction methods and results from optimization experiments.3, 4 In summary, we used WEKA (version 3.2.3) a Java based implementation of C4.5 release 8. The algorithm was set to overfit the data generating trees of maximal complexity with pruning criteria set to a minimum of two records per leaf. We used 10-fold cross validation to estimate the generalization error of our decision tree classifier.
2.4
3
RESULTS
Our sample consisted of 82 normal eyes from 46 patients and 99 eyes diagnosed with keratoconus from 54 patients.
3.1
Standard Classifier Performance
We compare the accuracy sensitivity and specificity of our decision tree classifier (Figure 1) to other Keratoconus classification methods in Table 1.
Other Videokeratography Classifiers
Using this same set of videokeratography records, we computed five additional keratoconus classification indices including: Modified Rabinowitz-McDonnell Index (RM ),7 KISA%,7 Keratoconus Prediction Index (KPI ),8 Z3,6 and Cone Location and Magnitude Index (CLMI ).9 These indices were calculated from published formulas and computed from the appropriate curvature or elevation videokeratography data.
2.5
(ROC) Plots. The ROC curve shows the tradeoff between sensitivity and specificity over the entire range of possible cut point criteria. The overall quality of a classifier can be judged by the area under the curve, and this area can be used for statistical comparisons between classifiers. We compared each classifier considered in this study under two different conditions. First, we computed each classification index as published and compared the area under the ROC curve, accuracy, sensitivity, and specificity using our decision tree method (C4.5 ) as the standard for comparison. Second, whenever possible, we normalized each classification index for the data in our sample and then compared the area under the ROC curve, accuracy, sensitivity and specificity as before, using C4.5 as the standard for comparison.
Table 1: Comparison of Standard Classifiers
Classifier
Cut point (≥)
Sensitivity (%)
Specificity (%)
Accuracy (%)
C4.5 CLMI RM (D) KISA% Z3 (µm) KPI
1 3 47.2 (1.4) 300 2.33 0.23
97.98 79.80 90.91 90.91 48.48 94.95
91.46 98.78 82.93 75.61 100 28.05
95.03 88.4 87.29 83.98 71.82 64.64
Statistical Methods
Sensitivity, specificity, and accuracy are the metrics most commonly used to evaluate the quality of a classifier. In the context of this study, sensitivity is defined as the number of correct identifications of keratoconus from all eyes with keratoconus. Specificity is the proportion of keratoconus eyes correctly identified by the classifier; accuracy is the proportion of total correct classifications of both classes out of all eyes in the sample. We represent the tradeoff between sensitivity and specificity by Receiver Operating Characteristic
We found the best sensitivity and accuracy for our decision tree classification method. Our CLMI classification method also had very good accuracy. Although it had greater specificity, the sensitivity was less than the decision tree classifier. The RM index and KISA% classification methods performed well on this data. The Z3 index had excellent specificity, but much worse sensitivity than other methods. The KPI index had excellent sensitivity but very poor specificity and was least accurate of any of the classifiers judged.
Figure 1: Decision Tree Classification of Keratoconus Classification attributes (circled numbers) are OSA single indez Zernike polynomial coefficients. Split criteria label each branch of the decision tree. Terminal nodes (boxes) are labeled with class assignments (Y = Keratoconus, N = Normal) and number of records assigned to this class (correct / incorrect).
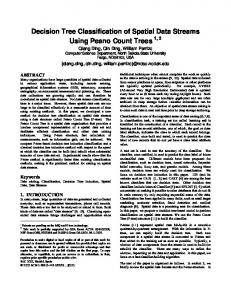
Figure 2: Figure 2-Keratoconus Classifier ROC Curve Comparisons. Area under the ROC curve for classifier is given in the legend
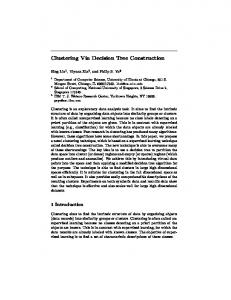
each ROC curve after a point optimization (all p < .006). Individual ROC curves (Figure 3) were very similar after optimization. As before, we compared area under each curve to our standard, the decision tree classifier. We found no statistically significant difference in areas underneath each ROC curve when In Figure 2, we plot the ROC curves for each of compared with our standard except that the KPI inthese classifiers. We make a statistical comparison dex was significantly less. of the differences between classification methods by comparing the area underneath each ROC curve to DISCUSSION our standard, the C4.5 decision tree classifier (Table 4 1). Our CLMI classifier was not statistically significantly different from our standard method. Each of In this study we described a new method of quanthe other classification methods, RM index, KPI in- titative videokeratography analysis. Using a Zernike dex, Z3 index, and KISA% had significantly less area polynomial representation of corneal surface features, we demonstrate that it is possible to automate clas(all P < .001) underneath the ROC curve. sification of corneal shape based on surface features modeled by Zernike polynomials. Attributes selected 3.2 Normalized Classifier Performance during classifier induction have empirical validity and We modified the threshold criteria for each kerato- corroborate familiar clinical findings associated with conus classification index selecting cut points that op- keratoconus, namely inferior-temporal steepening. timized classification accuracy. In Table 2, we show optimal cut points determined for our sample. After this optimization, we continued to find differences in sensitivity and specificity among the classifiers. However accuracy was more homogenous and was improved for all methods. Our C4.5 classifier continued to have the best sensitivity and accuracy. Our other index, CLMI had the best specificity. The only observed decrease after cut point optimization was a decrease in sensitivity of the KPI and KISA% indices. There was a significant increase in area underneath
Table 2: Comparison of Normalized Classifiers
Classifier
Cut point (≥)
Sensitivity (%)
Specificity (%)
Accuracy (%)
C4.5 nRM (D) nZ3 (µm) nKISA% CLMI nKPI
1 45.97 (1.77) 0.88 575 3 11.83
97.98 95.96 83.84 87.88 79.80 78.79
91.46 87.80 96.34 90.24 98.78 86.59
95.03 92.27 89.50 88.95 88.40 82.32
References [1] Hastie T, Tibshirani R, Friedman JH. The elements of statistical learning : Data mining, inference, and prediction. Springer series in statistics., New York, Springer, 2001; xvi, 533 [2] Mitchell TM. Machine learning. New York, McGraw-Hill, 1997; xvii, 414 [3] Twa MD. Spatial pattern recognition of videokeratography by decision tree classification of Zernike polynomials. Masters Thesis In Vision Science. Columbus, The Ohio State University. 2002; 96
Figure 3: Figure 2-Normalized Keratoconus Classifier ROC Curve Comparisons. Area under the ROC curve for classifier is given in the legend
This method has excellent sensitivity, specificity, and accuracy. Since this method is based on decision tree induction, it has additional advantages including faster computational speed, scalability for analysis of large data sets, and better interpretability than neural networks or other machine learning methods.2 Since our classifier is based upon Zernike polynomials calculated from videokeratography elevation data, this classification method is applicable to data from most clinical videokeratography instruments.
[4] Twa MD, Parthasarathy S, Raasch TW, Bullimore MA. Decision tree classification of spatial data patterns from videokeratography using zernike polynomials. In: SIAM International Conference on Data Mining. 2003. San Francisco, CA. [5] Zadnik K, Barr JT, Edrington TB, et al. Baseline findings in the collaborative longitudinal evaluation of keratoconus (CLEK) study. Invest Ophthalmol Vis Sci 1998; 39:2537-2546. [6] Schwiegerling J, Greivenkamp JE. Keratoconus detection based on videokeratoscopic height data. Optom Vis Sci 1996; 73:721-728. [7] Rabinowitz YS, Rasheed K. Kisa% index: A quantitative videokeratography algorithm embodying minimal topographic criteria for diagnosing keratoconus. J Cataract Refract Surg 1999; 25:1327-1335.
Neural network methods described by Smolek et al. have not been widely adopted.10 Advantages of greater classification accuracy by this approach are subordinate to several clinical concerns: simplic- [8] Maeda N, Klyce SD, Smolek MK, Thompson ity, interpretability, and portability. Success of any HW. Automated keratoconus screening with machine learning method will depend on providing corneal topography analysis. Invest Ophthalmol useful additional information to extend knowledge Vis Sci 1994; 35:2749-2757. and analytic power for users. In this increasingly complex analysis we were pleased to find the mod- [9] Mahmoud AM, Roberts C, Herderick EE, et al. ified Rabinowitz-McDonnell index performed very The cone location and magnitude index (CLMI) well even without normalization for our specific data [ARVO abstract]. Invest Ophthalmol Vis Sci set. 2001; 42:S898 Abstract nr 4825 Much of what we learn by classification of videok[10] Smolek MK, Klyce SD. Current keratoconus deeratography data is easily learned from other clinical tection methods compared with a neural nettests. Application of these methods to keratoconus work approach. Invest Ophthalmol Vis Sci 1997; classification is a test bed to demonstrate the value 38:2290-2299. of this approach. However, a more important implication of these results lies in their application to larger quantitative videokeratography data analysis problems. What we have shown with these results is successful application of a method that we will extend this larger and more varied clinical data sets.