a novel method of automated detection and localization of MI by using ECG ... 485753 beats of MI ECG) are segmented from the 12 lead ECG signals. Firstly,.
Automated Detection and Localization of Myocardial Infarction Using Electrocardiogram: A Comparative Study of Different Leads U. Rajendra Acharyaa,b,c, Hamido Fujita d, Vidya K Sudarshand, Shu Lih Oha, Muhammad Adama, Joel EW Koha, Jen Hong Tana, Dhanjoo N Ghistae, Roshan Joy Martisaf, Kuang Chua Chuaa, Kok Poo Chuaa, Ru San Tang
Abstract - Identification and timely interpretation of changes occurring in the twelve Electrocardiogram (ECG) leads is crucial to identify the types of Myocardial Infarction (MI). However, manual annotation of this complex nonlinear ECG signal is not only cumbersome and time consuming but also inaccurate. Hence, there is a need of computer aided techniques to be applied for the ECG signal analysis process. Going further, there is a need for incorporating this computerized software into the ECG equipment, so as to enable automated detection of MIs in clinics. Therefore, this paper proposes a novel method of automated detection and localization of MI by using ECG signal analysis. In our study, a total of 200 twelve lead ECG subjects (52 normal and 148 with MI) involving 611405 beats (125652 normal beats and 485753 beats of MI ECG) are segmented from the 12 lead ECG signals. Firstly, ECG signal obtained from twelve ECG leads are subjected to Discrete Wavelet Transform (DWT) up to four levels of decomposition. Then, twelve nonlinear
Department of Electronics and Computer Engineering, Ngee Ann Polytechnic, 599489 Singapore Department of Biomedical Engineering, School of Science and Technology, SIM University, 599491 Singapore c Department of Biomedical Engineering, Faculty of Engineering, University of Malaya, 50603 Malaysia d Iwate Prefectural University (IPU), Faculty of Software and Information Science, Iwate 020-0693 Japan e University 2020 Foundation, Massachusetts, USA f Department of Electronics and Communication Engineering, St. Joseph Engineering College, Mangalore, India g Department of Cardiology, National Heart Centre, Singapore a
b
2
features namely, Approximate Entropy (!"# ), Signal Energy ($ # ), Fuzzy Entropy # (!%# ), Kolmogorov-Sinai Entropy (!&' ), Permutation Entropy (!(# ), Renyi Entropy # # # (!)# ), Shannon Entropy (!'* ), Tsallis Entropy (!+' ), Wavelet Entropy (!, ),
Fractal Dimension (-.# ), Kolmogorov Complexity (/&# ), and Largest Lyapunov # Exponent (!001 ) are extracted from these DWT coefficients. The extracted
features are then ranked based on the t value. Then these features are fed into the k-Nearest Neighbour (KNN) classifier one by one to get the highest classification performance by using minimum number of features. Our proposed method has achieved the highest average accuracy of 98.80%, sensitivity of 99.45% and specificity of 96.27% in classifying normal and MI ECG (two class), by using 47 features obtained from lead 11 (V5). We have also obtained the highest average accuracy of 98.74%, sensitivity of 99.55% and specificity of 99.16% in differentiating the 10 types of MI and normal ECG beats (11 class), by using 25 features obtained from lead 9 (V3). In addition, our study results achieved an accuracy of 99.97% in locating inferior posterior infarction by using only lead 9 (V3) ECG signal. Our proposed method can be used as an automated diagnostic tool for (i) the detection of different (10 types of) MI by using 12 lead ECG signal, and also (ii) to locate the MI by analyzing only one lead without the need to analyze other leads. Thus, our proposed algorithm and computerized system software (incorporated into the ECG equipment) can aid the physicians and clinicians in accurate and faster location of MIs, and thereby providing adequate time available for the requisite treatment decision.
Keywords – electrocardiogram, discrete wavelet transform, myocardial infarction, classifier, entropy
1. Introduction 1.1 Myocardial infarction Myocardial Infarction (MI) is the silent, rapid and irreversible damage of cardiac muscles following coronary artery blockages. According to World Health Organization (WHO), Coronary Heart Disease (CHD) is the main cause of MI and remains responsible for about one-third or more of all deaths in individuals over age 35 [1,2]. In 2011, CHD alone caused about 1 of every 7 deaths in the USA and around 375,295 Americans died of CHD. Every year, approximated 635,000 Americans have a new coronary attack (first MI) and 300,000 have a recurrent episode (recurrent MI). It is approximated that, each year an additional 155,000 silent first MIs occur [3,4]. According to National Health and Nutrition Examination Survey (NHANES) 2009 to 2012 data, the prevalence of MI is 2.8% in US adults greater than 20 years of age [3,4]. The expansion of MI is very rapid and if not diagnosed and treated in time, it continues to damage further the myocardial structure and function of Left Ventricle (LV), because myocardial contractility promotes LV contraction to DOI: 10.1016/j.knosys.2016.01.040
3
maintain adequate cardiac output. Projections show that by 2030, the prevalence of CHD will increase approximately 18% from 2015 with estimation of 15.4 million [3,4]. Thus, earlier and faster the MI incidence is identified, the more contained can be the MI expansion and its effect on LV contractility and function, leading to better and more improved survival rate [5]. Therefore, growing prevalence of MI and mortality has gained importance worldwide to the research and development of techniques for mass screening to deliver prognostic healthcare.
1.2 ECG wave pattern in normal and infarcted heart Electrocardiogram (ECG) is a noninvasive procedure for obtaining the electrical activity of the heart over time using 12 surface electrodes (leads). The evaluation of alterations in the cardiac electrical activity using 12 lead ECG is normally used to diagnose and evaluate the risk of MI development. Together with patient history and clinical findings, the 12-lead ECG is still the most readily available and best method for the early diagnosis of MI [6-9]. In addition to the detection of MI, the 12 leads can be used to specify the region of myocardial damage. By their position, the 12 ECG leads can be used to distinguish MI occurring in different regions of the heart, such as inferior, lateral, anterior and posterior; combinations of these such as anterolateral and infero-posterior infarction. The 12 leads cluster around the heart and limbs in the horizontal plane and provide electrical activity views of the heart: (i) from anterior (front) using V1 to V4, (ii) from left (lateral) using V5 to V6, lead I and aVL, and (iii) from inferior using leads II, III, and aVF [10,11]. The electrical current flows from high potential (positive) to low potential (negative) in a normal healthy heart. If the electrical or contractile function of the heart is interrupted for some reason, the flow of electric signals throughout the myocardium will also be affected. For example, in MI condition the flow of electrical signal through infarcted zone gets affected due to the death of tissue in that part of the heart muscle. So when the electrical wave pattern is disrupted by an infarct, the ECG recording will indicate the abnormal flow of current. Within an infarcted heart, the electrical current flows opposite to the expected direction of flow, resulting in elevated or depressed ST segment. These signs of ST elevation or depression for anterior-septal infarction are seen in V1 to V4, for posterior infarction in V1 and V2, for inferior infarction in leads II, III and aVF, and for lateral in V5, V6, I, and aVL [12].
1.3 Detection of MIs by automated analysis of ECG signal pattern Although ST segment elevation or depression can be seen on the ECG signals, it is the combined 12 leads ECG signals precise measurement that can indicate exactly where the infarct is located [10,11]. Manual identification of DOI: 10.1016/j.knosys.2016.01.040
4
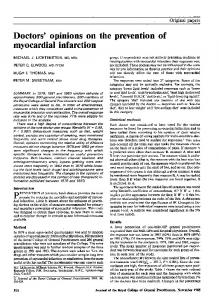
these changes occurring in the 12 leads and diagnosis of MI mainly for huge dataset can be difficult, time consuming and may even result to incorrect differentiation of the normal and abnormal ECG signals. This hurdle can be overcome by employing computer-aided automated diagnostic system. The computer-aided-based systems can enhance the diagnosis accuracy by determining minute variations in the ECG signal [13]. Various computational algorithms and systems have been developed for the 12 lead ECG signal analysis, and its automated processing to detect and locate MI. A summary of research work done using 12 lead ECG signal in the detection and localization of MI is provided in Table 7. In a study with ECG signal, QRS measurements obtained using the leads V2 to V4 combined with neural networks is shown to be able to localize anterior infarction with accuracy of 79% and specificity of 97% [14]. In addition, QRS complex characterization using Discrete Wavelet Transform (DWT) are able to differentiate normal, inferior MI, and anterior MI with Receiver Operating Characteristics (ROC) discrimination power of about 75% [15]. A set of timedomain features, such as QRS amplitude and duration, T amplitude and Q/R ratio extracted from each of the 12 leads are capable of localizing inferior MI and anterior MI with specificity of 92.73% and 93.33% by using Fuzzy MultiLayer Perception (FMLP) network [16]. It is evident that identification of the anatomic location of threatening MIs is important in order to estimate the amount of jeopardized myocardium and to determine the relative risk of morbidity and mortality. However, extraction and analysis of the timedomain features does not provide a good depiction of the nonlinear and nonstationary ECG signal data in the localization of MI. Hence, there is a requirement for the transformation of data from time domain to frequency domain, by using which concealed information can be extracted significantly [17]. The nonlinear features can help to decipher the hidden complexities in the ECG signals. Our present work focuses on the extraction of different nonlinear features extracted from 12 ECG leads, which are efficient in identifying the subtle changes within signal for the detection and localization of 10 types of MIs. The block diagram of the proposed method is shown in Figure 1. Each ECG signal is subjected to four levels of DWT decomposition. Later, twelve types of nonlinear features (Approximate Entropy (!"# ), Signal Energy ($ # ), Fuzzy # Entropy (!%# ), Kolmogorov-Sinai Entropy (!&' ), Permutation Entropy (!(# ), Renyi # # Entropy (!)# ), Shannon Entropy (!'* ), Tsallis Entropy (!+' ), Wavelet Entropy # (!, ), Fractal Dimension (-.# ), Kolmogorov Complexity (/&# ), and Largest # Lyapunov Exponent (!001 )) are extracted from DWT coefficients. Then, the
significant features obtained using t-test and ANOVA are ranked based on their t-values and F-values, and used for classification using k-Nearest Neighbours (KNN) classifier.
DOI: 10.1016/j.knosys.2016.01.040
5
Figure 1. Block diagram of the proposed method for automated detection of myocardial infarction.
2. Material used The 12 lead ECG signals required for the study are obtained from Physiobank (PTB Diagnostic ECG database) open access database [18]. We have downloaded a total of 52 normal subjects and 148 MI patients’ 12 lead ECG recorded signals. The 148 MI patients’ ECG signals are identified to have 10 types of different infarctions, such as Anterior, Anterior Lateral (anterolateral), Anterior Septal (anteroseptal), Inferior, Inferior Lateral (inferolateral), Inferior Posterior (inferoposterior), Inferior Posterior Lateral (inferoposterolateral), Lateral, Posterior, and Posterior Lateral (posterolateral).
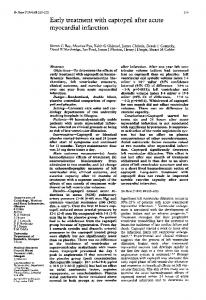
3. Methods 3.1 Pre-processing of ECG signal The ECG signals available in the database are sampled at different rates and to maintain the consistency (uniformity), a common sampling rate is selected in this work. Thus, each 12 lead ECG signal (of normal and MI) is digitized at 1000 samples per second. In addition, the ECG signals are pre-processed to eliminate noise and baseline wander by using Daubechies 6 (db6) wavelet basis function [19]. Figure 2 shows the normal ECG signal before and after removal of baseline wander.
2. Typeset equations a.
b.
Figure 2. ECG signal: (a) normal with baseline wander, (b) normal with baseline wander removed.
DOI: 10.1016/j.knosys.2016.01.040
6
3.2 Segmentation (beat selection) – R-point detection The pre-processed ECG signal is subjected to segmentation or selection of beats (cardiac cycle – P, QRS, and T waves) by R-point detection, using PanTompkin’s algorithm [19,20]. The R-wave is selected as a distinctive point as it has a high amplitude with a clearly visible peak. The Pan-Tompkins method is used to identify the R-point due to its computational simplicity and ease in implementation. Once the R-point is identified, 250 samples to the left and 400 samples to the right of R-point as a segment of 651 samples is selected for each ECG beat. Table 1 shows the number of beats extracted (segmented) from normal and MI 12 lead ECG signal.
Table 1 Number of beats extracted for normal and different types of MI.
Class
Number of Beats
Anterior
57754
Anterior Lateral
78105
Anterior Septal
98566
Inferior
129216
Inferior Lateral Inferior Posterior Inferior Posterior Lateral
70986 576 30181
Lateral
5520
Posterior
5523
Posterior lateral
9326
Normal
125652
Total
611405
3.2 Feature extraction In this paper, each ECG beat from the 12 lead ECG signals are subjected to 4 levels of DWT by using db6 wavelet basis function [19]. Later, twelve types of # # # # # nonlinear features (!"# , $ # , !%# , !&' , !(# , !)# , !'* , !+' , !, , -.# , /&# , !001 ) are
extracted from the eight DWT coefficients. Thus a total of 96 nonlinear features are extracted from each beat of ECG signal. A brief explanation of DWT and the features extracted is provided in the following sections.
3.2.1 Discrete wavelet transform (DWT) Each ECG beat is subjected to DWT decomposition up to fourth level [21,22]. Thus, a total of 8 sub-band coefficients are obtained. Then different features DOI: 10.1016/j.knosys.2016.01.040
7
are extracted from these eight sub-bands of the DWT. In this work, we have used db6 mother basis function [19].
3.2.1 Features extracted Approximate entropy (!"# ): This parameter determines the irregularity or instability [23] in the ECG signal. More irregularity will lead to high approximate entropy value. It is calculated as,
!"# = ln
56 7 5689 7 (1)
where 56 7 represents the mean length : of signal pattern and 5689 7 represents the mean length of signal pattern : + 1. Signal energy ($ # ): It is the square of the DWT coefficients of the ECG signal beat. $# =
=> ?, A
B
C,D
(2) where => represents the DWT coefficients at level n. Fuzzy entropy (!%# ): This parameter is used to determine the ECG signals unpredictability and is calculated as !%# =
K LK
E =F G ≥ I dI (3)
where G = M, N, O, P denotes the fuzzy variable parameters, M = length of the sequence, N, O = gradient and width of the boundary of the exponential function respectively, and P = length of the signal. In this work, we have used M = 3 , N = 2, O = 0.2 and P = 651 [24]. # Kolmogorov-Sinai entropy (!&' ): It is used to determine the ECG signal
uncertainty over time [22,25] and is calculated as 1 ][ ^, P[ F→Z [→K \ ][89 ^, P[89
# !&' = lim lim
(4) where, correlation function ][ ^, P[ indicates the probability that two points on the orbit are closer together than ^.
DOI: 10.1016/j.knosys.2016.01.040
8
Permutation entropy (!(# ): This parameter estimates the ECG signal complexity by calculating the couplings between the signals [22,26]. It is calculated as >
!(#
=
E_ log B E_ _b9
(5) where E_ denotes relative frequency. # Shannon entropy (!'* ): It is one of the spectral entropies and it is used to
quantify the spectral complexity of the ECG signal [27]. It is calculated as 6L9 # !'*
=
cC log B cC CbZ
(6) Renyi entropy (!)# ): This entropy is a generalized form of Shannon Entropy. It measures the spectral complexity [28,29]. It is calculated as !)# = −
c 1−c
log efCg (7)
where efC represents the total spectral power and in this work the order c = 2 have been chosen for !)# . # Tsallis entropy (!+' ): It is used to measure the abrupt changes and long-term
memory effects in the signal [30]. It is calculated as
# !+' =−
1 1− h−1
k j
iC Cb9
(8) where q represents the non-extensivity, iC denotes the probabilities [31]. # Wavelet entropy (!, ): It is the measure of relative energies in the different
frequency bands of the ECG signals [32] and is used to determine the degree of disorder. It is calculated as # !, =−
iC ln iC ClZ
(9) where iC represents the probability distribution of ECG signal and ? defines different resolution levels.
DOI: 10.1016/j.knosys.2016.01.040
9
Fractal dimension (-.# ): It is used to measure the dimensional complexity and presence of transients of ECG signals [33,34]. It is calculated as -.# = −
log : I log 1 I ( 10 )
where : I = length of t samples and for ^ = 1,2, … I, it is given as [35] 1 : I = × I
o
: ^, I Fb9
( 11 ) Where I = 1,2, … I[g# . In this study, a value of I[g# = 128 is used. Kolmogorov complexity (/&# ): It is used to describe the complexity and irregularity present in ECG signal [36,37]. # Largest Lyapunov Exponent (!001 ): This parameter is used to indicate the # chaos present in the ECG signal and !001 is positive, if chaos is present in the
signal [38,39].
3.3 Feature ranking and selection It is difficult to identify the particular features with significant information necessary for the detection and localization of MIs. Hence, the Feature ranking methods such as Student’s t-test and ANOVA are used to overcome this problem, in which all the features extracted are ranked according to their significance. In this paper, we have tested features of two classes (normal and MI) for normal distribution using Quantile-Quantile (q-q) Plots and hence used t-value for ranking the features of two classes; higher the tvalue, better is the ranking obtained. For ranking the more than two class’s features (normal and 10 types of MIs), we have used ANOVA test in this work.
3.4 Classification A classifier is used to automatically classify the ranked features and to find the minimum number of features necessary for obtaining the highest performance. In this work, we have used the KNN classifier to carry out the classification [40]. The KNN is an instance based classifier and one of the simplest of classification algorithms. By relating the unknown to a known sample, an unknown sample classification is performed. A majority vote by neighbors discriminates the test sample. The most common among its k nearest neighbors are used to assign the class to the test sample. In this work, we have used K = 5. DOI: 10.1016/j.knosys.2016.01.040
10
4. Results A total of 611405 beats are segmented from 200 subjects (52 normal and 148 with MIs). Each ECG beat is subjected to four levels of DWT to obtain the 8 coefficients. Twelve nonlinear features are extracted from these eight types DWT coefficients, thus extracting 96 features from each ECG beat.
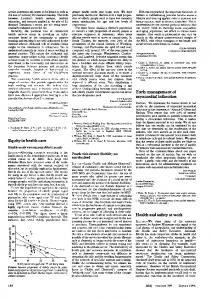
4.1 Detection of MI Figure 3 (a) and (b) presents the mean value of 47 nonlinear features extracted from normal and MI ECG signals of Lead 11. All features are statistically significant with p < 0.0001.
a.
b. Figure 3 (a) and (b). The results of 47 nonlinear features from normal and MI ECG signal obtained using lead 11
It can be seen from Table 2 and Figure 3 that the values of entropies are higher for MI ECG signal compared to normal signal, due to the ST segment DOI: 10.1016/j.knosys.2016.01.040
11
elevation or depression in MI patients’ ECG signal. Since the flow of electrical activity is going backwards around the damaged myocardium (MI region), we see an elevation on the ST readings, and thus the higher entropy values. This indicates the low degree of uniformity of ECG signal in MI patient.
Table 2 Results (mean and SD) of top 25 nonlinear features from normal and MI ECG signal obtained using lead 11. Features
Normal
MI
t-Value
Mean
SD
Mean
SD
!( q
p
2.07
0.27
2.48
0.21
163.32
p !( r
1.76
0.22
2.07
0.17
153.02
p !( s
2.23
0.24
2.61
0.25
141.38
p /& t . /& t . !" s . !" t p !) r p -. r p !) q p !% r
$p s p !+'s
$
pr
p !+'r
5.67
8.98 x 10
-13
5.67
2.87 x 10
-12
131.77
5.67
8.98 x 10⁻¹³
5.67
2.87 x 10⁻¹²
131.77
0.75
0.33
1.09
0.31
96.64
0.50
0.11
0.72
0.23
95.85
-20.38
0.80
-19.46
0.91
93.05
1.09
0.03
1.16
0.08
92.95
-20.37
0.80
-19.46
0.91
92.75
0.67
0.18
2.19 x 10
8
-2.20 x 10
8
2.17 x 10⁸ -2.20 x 10
8
0.94
0.28
90.26
2.38 x 10
8
8.77 x 10
7
8.70 x 10
7
89.75
2.38 x 10
8
-8.80 x 10
7
8.70 x 10
7
89.75
8.72 x 10⁷
8.58 x 10⁷
89.59
-8.70 x 10
8.58 x 10
7
89.58
2.37 x 10⁸ 2.37 x 10
8
7
pq
2.18 x 10⁸
2.37 x 10⁸
8.74 x 10⁷
8.64 x 10⁷
89.55
p !+'q
-2.20 x 10⁸
2.37 x 10⁸
-8.70 x 10⁷
8.64 x 10⁷
89.54
p !) s
-20.31
0.82
-19.42
0.92
89.45
pt
2.12 x 10⁸
2.28 x 10⁸
8.50 x 10⁷
8.67 x 10⁷
89.45
-8.50 x 10
8.67 x 10
7
89.45
$
$
p !+'t
-2.10 x 10
8
2.28 x 10
8
7
p !% q
1.03
0.27
1.41
0.41
89.39
. !&'t
0.45
0.08
0.31
0.15
87.77
p !,t
-3.10 x 10
p !,s
-3.20 x 10⁹
4.11 x 10⁹
p !,q
-3.00 x 10⁹
3.96 x 10⁹
9
3.93 x 10
9
9
-1.10 x 10
85.22
-1.20 x 10⁹
1.26 x 10⁹
84.45
-1.10 x 10⁹
1.21 x 10⁹
83.94
9
1.26 x 10
Later, we have fed the features extracted from the ECG signals of normal and MI to KNN classifier. We have observed that the lead 11 presented the best performance among all the 12 leads ECG signal. Using lead 11 ECG signal (V5), we have achieved an average accuracy of 98.80%, sensitivity of 99.45%, and specificity of 96.27% in the detection of normal and MI classes. Table 3 shows DOI: 10.1016/j.knosys.2016.01.040
12
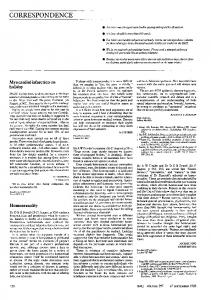
the KNN classifier results for normal and MI ECG signal obtained using all 12 leads. Figure 4 shows the plot of accuracies (%) versus the number of features for normal and MI ECG signal for lead 11 ECG.
Table 3 Classification results of normal and MI ECG signal obtained using ECG 12 leads.
Lead
No of Features
TP
TN
FP
FN
Accuracy (%)
Sensitivity (%)
Specificity (%)
1 (I)
52
39717
9686
912
518
97.19
98.71
91.39
2 (II)
48
39464
9449
1097
718
96.42
98.21
89.60
3 (III)
28
40254
8672
1902
1061
94.29
97.43
82.01
4 (aVR)
45
39711
9303
1191
501
96.66
98.75
88.65
5 (aVL)
55
39795
7529
3008
1254
91.74
96.95
71.45
6 (aVF)
35
40129
7684
2788
1219
92.27
97.05
73.38
7 (V1)
49
38783
8210
2272
1275
92.98
96.82
78.32
8 (V2)
57
39349
8428
2055
931
94.12
97.69
80.40
9 (V3)
61
39505
8741
1709
904
94.86
97.76
83.65
10 (V4)
51
39708
9397
974
626
96.84
98.45
90.61
11 (V5)
47
39973
9937
385
220
98.80
99.45
96.27
12 (V6)
37
39895
9908
415
243
98.70
99.39
95.98
Figure 4. Plot of accuracies (%) versus the number of features for the classification of normal and MI ECG signal using lead 11 ECG.
DOI: 10.1016/j.knosys.2016.01.040
13
4.2 Classification of normal and 10 MIs Then, we have evaluated the performance of KNN classifier with the features extracted from each beat ECG signals of normal and ten types of MIs (Table 1). Herein, we noted that by using the KNN classifier, the lead 9 presented the best performance among all the twelve leads in the classification of normal and ten types of MIs. By using the lead 9 (V3) ECG signal, we achieved an average accuracy of 98.74%, sensitivity of 99.55%, and specificity of 99.16%, with 25 nonlinear features for the classification of normal and 10 different types of MIs. Table 4 shows the KNN classifier results for normal and 10 different types of MI ECG signal obtained by using all 12 leads. Figure 5 shows the accuracies obtained using different number of features for normal and 10 MIs ECG signal of lead 9.
Table 4 Classification results of normal and 10 different types of MI ECG signal obtained from 12 ECG leads.
Lead
No of Features
TP
TN
FP
FN
Accuracy (%)
Sensitivity (%)
Specificity (%)
1 (I)
38
39944
10303
295
291
96.25
99.28
97.22
2 (II)
35
39769
10293
253
413
93.55
98.97
97.60
3 (III)
19
40378
9704
870
937
86.93
97.73
91.77
4 (aVR)
34
39926
10149
345
286
94.23
99.29
96.71
5 (aVL)
31
40581
9981
556
468
93.64
98.86
94.72
6 (aVF)
50
40436
9767
705
912
87.93
97.79
93.27
7 (V1)
23
39843
10378
104
215
97.75
99.46
99.01
8 (V2)
31
40031
10254
229
249
97.55
99.38
97.82
9 (V3)
25
40229
10362
88
180
98.74
99.55
99.16
10 (V4)
29
40028
10172
199
306
96.88
99.24
98.08
11 (V5)
34
40068
10175
147
125
96.27
99.69
98.58
12 (V6)
33
39823
10032
291
315
93.65
99.22
97.18
DOI: 10.1016/j.knosys.2016.01.040
14
Figure 5. Plot of accuracies (%) versus the number of features for the classification of normal and MI ECG signal using lead 9 ECG.
4.3 Localization of MI We have used 10-fold cross validation technique to train and test the KNN classifier. We have observed that using the KNN classifier, lead 9 presented the best performance among all the 12 leads ECG signal. Therefore, Table 5 shows the validation results obtained for classification or localization of 11 types classes (one normal and 10 types of MIs) ECG signals of lead 9. We found that the use of just one lead ECG signal (lead 9 – V3) resulted in the highest accuracy for locating the inferior posterior MI. It is evident from Table 5 that the proposed method is able to locate the inferior posterior MI with an accuracy of 99.97% by just using only lead 9 without the need of interpreting the other ECG leads. Thus this method provides an ample time for physicians to take decision or action on treatment options. Table 6 shows the confusion matrix of all the 11 classes for lead 9 ECG beats. It can be seen from the table that, in anterior MIs group (anterior, anterior lateral, anterior septal), few beats are wrongly classified (confused), but are falling within this group itself. Similarly, for inferior MIs group (inferior, inferior lateral, inferior posterior, and inferior posterior lateral), also few beats are wrongly classified within the same group. Overall classification
DOI: 10.1016/j.knosys.2016.01.040
15
accuracy for the 11 classes is about 99% for inferior group, and 97% for anterior group due to the confusion within the respective groups.
Table 5 Classification results of ten-fold cross validation for normal and MI localization using lead 9 ECG signal.
Classes
Accuracy (%)
Sensitivity (%)
Specificity (%)
Normal
96.67±0.10
97.60±0.14
93.05±0.41
Anterior
97.59±0.11
98.89±0.05
84.92±0.86
Anterior Lateral
97.65±0.10
98.61±0.09
91.14±0.44
Anterior Septal
97.24±0.17
98.48±0.12
90.83±0.76
Inferior
95.91±0.12
96.90±0.13
92.19±0.30
Inferior Lateral
97.62±0.13
98.87±0.07
88.14±0.98
Inferior Posterior
99.97±0.01
99.99±0.01
84.37±6.46
Inferior Posterior Lateral
98.87±0.11
99.57±0.04
85.53±1.72
Lateral
99.87±0.02
99.93±0.01
92.45±1.86
Posterior
99.90±0.02
99.94±0.02
95.34±1.38
Posterior lateral
99.81±0.03
99.91±0.02
93.34±1.76
DOI: 10.1016/j.knosys.2016.01.040
Table 5 Classification results of ten-fold cross validation for normal and MI localization using lead 9 ECG signal.
Normal
Anterior
Anterior Lateral
Anterior Septal
Inferior
Inferior Lateral
Inferior Posterior
Inferior Posterior Lateral
Lateral
Posterior
Posterior lateral
Accuracy (%)
Specificity (%)
10362
15
10
2
29
25
0
4
3
0
0
99.47
99.55
Anterior
43
4633
15
31
15
0
0
6
0
0
0
99.67
99.88
Anterior Lateral
7
5
6478
15
18
14
0
3
0
0
0
99.77
99.88
Anterior Septal
10
18
18
8161
17
5
0
6
0
2
1
99.71
99.83
Inferior
70
5
6
14
10579
27
0
10
0
0
0
99.43
99.60
Inferior Lateral
19
5
5
8
72
5800
0
5
0
0
0
99.62
99.83
Inferior Posterior
0
0
0
0
0
0
47
1
0
0
0
100.00
100.00
Inferior Posterior Lateral
24
9
1
2
9
7
0
2464
0
0
0
99.83
99.93
Lateral
0
0
0
0
0
0
0
0
459
0
0
99.99
99.99
Posterior
1
0
0
0
0
0
0
0
0
462
0
99.99
100.00
Posterior lateral
6
0
0
0
0
0
0
0
0
0
771
99.99
100.00
Original/ Predicted Normal
5. Discussion A novel methodology for the detection and localization of MI (or MI classification) by using nonlinear features from 12 lead ECG signal is # proposed in this paper. Twelve types of nonlinear features (of !"# , $ # , !%# , !&' , # # # # !(# , !)# , !'* , !+' , !, , -.# , /&# , !001 ) have been employed to detect MIs from non-
stationary ECG signal analysis. The essence of this nonlinear analysis method is that it empirically determines the intrinsic complexity present within the characteristic time series. This excellent capability of nonlinear methods makes it an optimum choice for the analysis of natural phenomenon like vibration signal analysis. Other techniques such as time-domain methods have been explored by various researchers for the extraction of features from ECG signal; and further for the classification of normal and MI classes [41-45]. A summary of these studies is provided in Table 7. Arif et al., (2012) [41] used 12 lead ECG signal and time domain features from each beat such as T wave amplitude, Q wave and ST level deviation for MI detection and localization. Their study used 20,160 ECG beats to investigate the time domain features using KNN classifier. Their method showed (i) sensitivity and specificity of 99.9% for the detection of MI, and (ii) overall accuracy of 98.8%, sensitivity and specificity of above 90% for the classification of 11 classes (normal and 10 types of MI) using ECG signal. Banerjee et al., (2012) [42] used Cross Wavelet Transform (XWT) and Wavelet Coherence (WCOH) techniques for analysis of ECG signal beats patterns. Their study showed distinguishing characteristics over two specific regions such as the QRS complex area and the T wave region during the classification of normal and abnormal data (inferior myocardial infarction). The same year, another group, Sun et al., (2012) [43] developed a new technique called Latent Topic Multiple Instance Learning (LTMIL) to automatically detect ECGs with MI without labeling any heartbeats. Their study results showed 92.3 ± 0.84 sensitivity and 88.1 ± 2.3 specificity in classification of normal and MI ECG signals by using Support Vector Machine (SVM) classifier. In 2014, Safdarian et al., (2014) [44] used two new features (T wave integral and total integral) extracted from one cycle (beat) of normal and abnormal ECG signals to detect and localization of MI in left ventricle of heart. Their method showed an accuracy of 94.74% in detection, 76.67% in localization of MI by using Naïve Bayes and Probabilistic Neural Network (PNN) classifiers. Then, Liu et al., (2014) [45] proposed a novel ECG feature by fitting a given ECG signal with 20th order polynomial function defined as PolyECG-S. Their proposed PolyECG-S feature showed an accuracy of 94.4% in detecting the MI using test dataset. The time domain features such as T wave amplitude, Q wave and ST level deviation are conventionally considered by cardiologists as indicators of MI.
18
Even though the cardiologists are able to interpret time domain features, few ECGs are difficult to calculate the time domain features due to noise. If time domain features are not extracted accurately, it will affect the classification accuracy. Thus, efficient signal processing techniques and some extra processing before feature extraction to remove the noise is necessary to extract the time domain features from ECG efficiently [46]. Despite of that, the time-domain features do not provide vital information about the nonlinear interrelationships in ECG signals due to its nonstationary characteristics. Therefore, in this work, we have used different nonlinear features extracted from 12 lead ECG signal instead of analyzing using the time-domain parameters. In this work, nonlinear methods are explored by extracting the twelve types # # # # # of nonlinear features (!"# , $ # , !%# , !&' , !(# , !)# , !'* , !+' , !, , -.# , /&# , !001 ) from the
12 lead ECG signal for detection of normal and classification of 10 types of MIs. A KNN classifier is then used for automated classification of these extracted nonlinear features. Approximate entropy and Sample entropy features measure the repeatability or predictability within the time series ECG signals. The regularity of the ECG signals are measured by the approximate entropy feature, which helps to quantify the complexity present within the signals [23]. Permutation entropy is a measure of chaotic and nonstationary time series signal in the presence of dynamical noise; this feature is robust, efficient and produces fast results irrespective of noisy data. It can hence be used for processing of huge data sets without pre-processing of data and fine-tuning of complexity parameters [26,47,48]. The fuzzy entropy feature is insensitive to noise; and is highly sensitive to changes in the information content in the ECG signal. The wavelet entropy feature can detect the fine changes in a non-stationary ECG signal [32], and requires less computational time. Therefore, in essence, the nonlinear method of feature extraction is suitable for ECG signal analysis, and can be effectively employed for the development of an efficient diagnostic system. Our nonlinear methods are able to efficiently detect normal and MI ECG signal with an average accuracy of 98.80%, sensitivity of 99.45%, and specificity of 96.27%, by using 47 features obtained from lead 11 (lead V5). In addition, our proposed method is able to differentiate normal and 10 different types of MIs according to their location of infarction, with an average accuracy of 98.74%, sensitivity of 99.55%, and specificity of 99.16% by using 25 features obtained from lead 9 (lead V3). Thus, by interpreting only one lead 9 (lead V3) signal, our proposed method can locate the inferior posterior infarction without the need of reading all other leads’ signals with an accuracy of 99.97%. The time consumed otherwise to analyze other leads signal is reduced. To the best of our knowledge, this study result is the first of its kind in the efficient detection and localization of MIs by using the 12 lead ECG signals.
DOI: 10.1016/j.knosys.2016.01.040
19 Table 7 Summary of research work on using 12 lead ECG signal in detection and localization of MI
Author (Year)
Database/Subjects
Methods and Features
Results
Lu et al., 2000 [49]
1. Lead: 12 lead
• Fuzzy logic and neural network theory
Training set: Sensitivity = 94.2% Specificity = 100%
2. Beats: not mentioned 3. Subjects: 20 normal 104 MI Lahiri et al, 2009 [50]
1. Lead: 12 lead 2. Beat(s): 64680 R-peaks from 1848 signals 3. Subjects: 177 MI 77 healthy control
• Extract ST deviation and T wave amplitude from 12 leads
• R-peak detection of an ECG signal
Testing set: Sensitivity = 84.6% Specificity = 90% Efficiency for test dataset was found 96%
• Extract phase space fractal dimension (PSFD) of ECG
Re-sampling signal of each lead to 1/10th of its original size using neighbour interpolation
Arif et al, 2012 [41]
1. Lead: 12 lead 2. Beat(s): 16960 MI beats, 3200 Normal beats 3. Subjects: Not mentioned (10 types of MI 1 healthy)
Banerjee et al, 2012 [42]
1. Lead: Lead 3 2. Beat(s): 1 beat 3. Subjects: 148 Myocardial infarction patients & 52 healthy controls
• From each beat – extracted time domain features
Sensitivity = 99.97%, Specificity = 99.9%
• Q-wave and T-wave amplitudes, and ST segment deviation
MI localization sensitivity & specificity > 99%
• Cross Wavelet Transform (XWT)
Features shows distinct separation over two specific regions R1 and R2,
• Wavelet Coherence (WCOH) techniques
R1 = QRS complex area and R2 = T wave region
Time normalized each segmented beat to 800 samples (FFT) Sun et al, 2012 [43]
1. Lead: 12 ECG leads (6 polynomial coefficients X 12 leads = 72 polynomial coefficients for each heartbeat) 2. Beat(s): 3. Subject(s): 209 males & 81 females. Age 17-87 years 369 MI ECG records 79 healthy ECG record
DOI: 10.1016/j.knosys.2016.01.040
Latent topic multiple instance learning (LTMIL): Pre-processing: Baseline wander removal, DCT based filter Feature extraction: ST segment, 5th order polynomial fitting
Sensitivity = 91% Specificity > 85%
20 Segmentation and analysis of ST segment Sample 200 points from ST segment of each one-lead heartbeat Safdarian et al, 2014 [44]
1. Lead: Lead 2
T-wave integral
Accuracy (localization): 76%
2. Beat(s): 1 beat
Total integral
Accuracy (detection): 94%
Propose development of a novel ECG feature by fitting the ECG signal with a 20th order polynomial function
Achieved 94.4% accuracy in detecting the Myocardial Infarction (MI) on the test dataset
• Segmentation and acquisition of ECG beats from R-peak detection
MI detection Accuracy = 98.80% Sensitivity = 99.45% Specificity = 96.27% using lead 11 – 47 features
3. Subjects: 290 subjects 549 records Liu et al, 2014 [45]
1. Lead: Lead I and lead v6 2. Beat(s): 1 beat 3. Subjects: 148 MI patients & 52 healthy subjects Normalized ECG cycle into [0,1] x [0,1], Unified ECG Cycle (UEC) Each UEC transformed into 44 features One ECG cycle may have 5001000 data points for 60-120 heart rates per minute
Current work
1. Lead: 12 lead 2. Beat(s): 125652 normal 485753 MI 3. Subjects: 148 MI of 10 types 52 healthy
• Perform DWT on all ECG beats • 12 features extracted from each wavelet coefficient: 1. 2. 3. 4.
Approximate Entropy Signal Energy Fuzzy Entropy Kolmogorov-Sinai Entropy 5. Permutation Entropy 6. Renyi entropy 7. Shannon Entropy 8. Tsallis Entropy 9. Wavelet Entropy 10. Fractal Dimension 11. Kolmogorov Complexity 12. Largest Lyapunov Exponent
DOI: 10.1016/j.knosys.2016.01.040
MI localization Accuracy = 98.74% Sensitivity = 99.55% Specificity = 99.16% using lead 9 – 25 features
21
6. Conclusion The development of an automated tool to identify MI with significant accuracy is challenging. In this paper, we have presented a novel algorithm for the detection and localization of MI (or different MI classification), by using nonlinear features extracted from 12 lead ECG signal. Our study results show 98.80% of accuracy, 99.45% of sensitivity, and 96.27% of specificity, by using 47 features extracted from lead 11 ECG signal in the detection of MI. In addition, the results of our method show accuracy of 98.74%, sensitivity of 99.55%, and specificity of 99.16% by using 25 features obtained from ECG lead 9 for the classification of 10 types of MIs according to their location of infarction; we have also achieved 99.97% of accuracy in locating inferior posterior MI by only using lead 9 signal. Hence, our proposed automated MI detection and localization method of using 12 ECG leads can valuably aid physicians and clinicians to identify the exact location of infarction, thereby reducing the time taken to screen and interpret all other ECG leads and providing adequate time for treatment decision. By incorporating our methodology into the ECG system, it can be used as an automated tool by physicians in clinics or polyclinics settings for faster location of MIs. Widespread employment of this novel ECG Monitoring and Software Equipment (ECG-MSE) by qualified nurses and paramedics educated to handle this instrument can significantly strengthen the screening and help in providing mass cardiac care with minimal resources. In future, authors will be exploring other nonlinear features extraction methods from the 12 lead ECG signal for localization of MI with better accuracy and by using less number of features. We then intend to develop an integrated index of MI for the classification of normal and MI by optimally combining selected features to obtain maximum accuracy in the detection of different types of MI by using ECG signal features, to identify the extent of myocardial damage due to MI. This can then be developed as a computeraided diagnostic ECG-monitoring system (tele-monitoring system) for detection and localization of MI faster and effectively saving precious lives.
DOI: 10.1016/j.knosys.2016.01.040
22
References 1.
WHO fact sheet 2011, http://www.who.int/mediacentre/factsheets/fs310/en/index.html.
2.
Roger VL. Epidemiology of myocardial infarction. Med Clin N Am, 2007; 91: 537-552.
3.
AHA 2013 Update. Heart disease and stroke statistics, A report from the American Heart Association (AHA). Circulation, 2013; 127: e6-e245.
4.
AHA 2015 Update. Heart disease and stroke statistics, A report from the American Heart Association. Circulation, 2015; 131: e29-e322.
5.
Zhang X, Cowan BR, Bluemke DA, Finn JP, Fonseca CG, Kadish AH, Lee DC, Lima JAC, Suinesiaputra A, Young AA, Medrano-Gracia P. Atlas-based quantification of cardiac remodeling due to myocardial infarction. PLOS one, 2014; 9: e110243
6.
Timmis AD. Early diagnosis of acute myocardial infarction. BMJ, 1990; 301: 941-942
7.
Timmis AD. Will serum enzymes and other proteins find a clinical application in the early diagnosis of myocardial infarction? Br Heart J, 1994; 71:309-310
8.
Lee HS, Cross SL, Garthwaite P, Dickie A, Ross I, Walton S, Jennings K. Comparison of the value of novel rapid measurement of myoglobin, creatine kinase, and creatine kinase-MB with the electrocardiogram for the diagnosis of acute myocardial infarction. Br Heart J, 1994; 71: 311-315.
9.
Mair J, Smidt J, Lechleitner P, Dienstl F, Puschendorf B. A decision tree for the early diagnosis of acute myocardial infarction in nontraumatic chest pain patients at hospital admission. Chest, 1995; 108: 1502-1509.
10.
Lewis KM, Handal K. Sensible analysis of the 12 lead ECG, 1st edition, 2000.
11.
Luna AB, Fiol-Sala M, Antman EM. The 12 lead ECG in ST elevation myocardial infarction: a practical approach for clinicians. Wiley-Blackwell, 2006.
12.
Tragardh E, Claesson M, Wagner GS, Zhou S, Pahlm O. Detection of acute myocardial infarction using 12-lead ECG plus inverted leads versus the 16-lead ECG (with additional posterior and right-sided chest electrodes). Clin Physiol Funct Imaging, 2007; 27: 368-74.
13.
Faust O, Acharya UR, Tamura T. Formal design methods for reliable computer-aided diagnosis: a review. IEEE rev. Biomed. Eng, 2012; 5: 15-28.
14.
Reddy MRSE, Svensson L, Haisty J, Pahlm WK. Neural network versus electrocardiographer and conventional computer criteria in diagnosing anterior infarct from the ECG. Proc of computers in cardiology, 1992: 667-670.
15.
McDarby G, Celler BG, Lovell NH. Characterizing the discrete wavelet transform of an ECG signal with simple parameters for use in automated diagnosis. 2nd international conference on bioelectromagnetism. 1998: 31-32.
16.
Bozzola P, Bortolan G, Combi C, Pinciroli F, Brohet C. A hybrid neuro-fuzzy system for ECG classification of myocardial infarction. Proc of computers in cardiology, 1996: 241-244.
17.
Martis RJ, Chakraborty C, Ray AK. An integrated ECG feature extraction scheme using PCA and wavelet transform. In: 2009 India annual IEEE conference (INDICON), IEEE, 2009: 1-4.
18.
Goldberger AL, Amaral LA, Glass L, Hausdorff JM, Ivanov PC. “PhysioBank, PhysioToolKit, and PhysioNet: components of a new research resource for complex physiologic signals”. Circulation, vol. 101, 2000, pp e215-220.
19.
Martis RJ, Acharya UR, Lim CM. ECG beat classification using PCA, LDA, ICA and Discrete Wavelet Transform. Knowledge Based-Systems. 2012; 8(5): 437-448.
20. Pan J, Tompkins WJ. A real time QRS detection algorithm. 11th edition. WB Saunders Co, Philadelphia, 2006.
DOI: 10.1016/j.knosys.2016.01.040
23 21.
Addison PS. Wavelet transforms and the ECG: a review. Physiological Measurement, 2005; 26 (5): R155–R199.
22.
Acharya UR, Fujita H, Sudarshan VK, Bhat S, Koh JEW. Application of entropies for automated diagnosis of epilepsy using EEG signals: A review. Knowledge Based System, 2015; 88: 85-96.
23.
Pincus SM. Appoximate entropy as a measure of system complexity. Proc Natl Acad Sci, 1991; 88: 2297-2301.
24. Kosko B. Fuzzy entropy and conditioning. Information Sciences, 1986; 40: 165-174. 25.
Farmer JD. Information dimension and the probabilistic structure of chaos. Naturforsch Z, 1982; 37: 1304-1325.
26. Bandt C, Pompe B. Permutation entropy: A natural complexity measure for time series. Rev. Lett. 2002; 88: 174102. 27.
Shannon C. A mathematical theory of communication. Bell system technical journal, 1948; 27: 379-423.
28. Renyi A. On measures of entropy and information. Proc. Fourth Berkeley symp. On Math. Sttis. And Prob. 1961; 1: 547-561. 29.
Grassberger P. Information and complexity measures in dynamical systems. In: Information dynamics, 1991; 256: 15-33.
30. Bezerianos A, Tong S, Thakor N. Time dependent entropy of EEG rhythm changes following brain ischemia. Ann Biomed Eng, 2003; 31: 221-232. 31.
Tong S, Bezerianos A, Malhotra A, Zhu Y, Thakor N. Parameterized entropy analysis of EEG following hypoxic ischemic brain injury. Phys Lett A, 2003; 314: 354-361.
32.
Rosso OA, Blanco S, Yordanova J, Kolev V, Figliola A, Schurmann M, Basar E. Wavelet entropy: A new tool for analysis of short duration electrical signals. Journal of Neuroscience Methods, 2001; 105: 65-75.
33.
Mandelbrot BB. The Fractal Geometry of Nature. W.H. Freeman and Company, 1982.
34. Higuchi T. Approach to an irregular time series on the basis of the fractal theory. Physics D, 1988;31: 277-283 35.
Gomez C, Mediavilla A, Hornero R, Abasolo D, Fernandez A. Use of the Higuchi’s fractal dimension for the analysis of MEG recordings from Alzheimer’s disease patients. Medical engineering and physics, 2009; 31: 306-313.
36. Kolmogorov A. On tables of random numbers, Sankhya: The Indian journal of statistics, Series A. 25, 369-376, 1963. 37.
Kaspar F, Schuster HG. Easily calculable measure for the complexity of spatiotemporal patterns. Phys. Rev. 36, 842, 1987.
38. Sprott JC. Chaos and Time-Series Analysis. Oxford University Press, 2003. 39. Rosenstein M, Colins JJ, De Luca CJ. A practical method for calculating largest Lyapunov exponent from small data sets. Physica D 1993; 65:117-134. 40. Duda, R.O., Peter E. H., and David G. S. “Pattern classification”. Wiley-interscience, 2012. 41.
Arif M, Malagore IA, Afsar FA. Detection and localization of myocardial infarction using Knearest neighbor classifier. © Springer Science + Business Media, LLC 2010, J Med Syst, 2012; 36: 279-289.
42. Banarjee S, Mitra M. Cross wavelet transform based analysis of electrocardiogram signals. International Journal of Electrical, Electronics and Computer Engineering, 2012; 1(2): 88-92. Special Edition for Best Papers of Michael Faraday IET India Summit-2012, MFIIS-12.
DOI: 10.1016/j.knosys.2016.01.040
24 43. Sun L, Lu Y, Yang K, Li S. ECG analysis using multiple instance learning for myocardial infarction detection. IEEE transaction on biomedical engineering, 2012; 59, no. 12. 44. Safdarian N, Dabanloo NJ, Attarodi G. A new pattern recognition method for detection and localization of myocardial infarction using t-wave integral and total integral as extracted features from one cycle of ECG signal. J. Biomedical Science and Engineering, 2014; 7: 818824. 45. Liu B, Liu J, Wang G, Huang K, Li F, Zheng Y, Luo Y, Zhou F. A novel electrocardiogram parameterization algorithm and its application in myocardial infarction detection. Computers in Biology and Medicine, 2014; 61: 178–184. 46. Desai U, Martis RJ, Nayak CG, Sarika K, Nayak SG, Shirva A, Nayak V, Mudassir S. Discrete cosine transform features in automated classification of cardiac arrhythmia beats. In: Emerging research in computing, information, communication and applications, 2015: 153162. 47.
Li X, Ouyang G, Richards DA. Predictability analysis of absence seizures with permutation entropy. Epilepsy Res. 2007; 77: 70
48. Zanin M, Zunino L, Rosso OA, Papo D. Permutation entropy and its main biomedical and econophysics application: A review. Entropy, 2012; 14: 1553-1577. 49. Lu H, Ong K, Chia P. An automated ECG classification system based on a neuro-fuzzy system. Computers in cardiology, 2000; 27: 387-390. 50. Lahiri T, Kumar U, Mishra H, Sarkar S, Roy AD. Analysis of ECG signal by chaos principle to help automatic diagnosis of myocardial infarction. Journal of Scientific and industrial research, 2009; 68: 866-870.
DOI: 10.1016/j.knosys.2016.01.040