Revista Brasileira de Cartografia (2013) N0 65/4: 785-803 Sociedade Brasileira de Cartografia, Geodésia, Fotogrametria e Sensoriamento Remoto ISSN: 1808-0936
AUTOMATED DETECTION, LOCALIZATION, AND IDENTIFICATION OF SIGNALIZED TARGETS AND THEIR IMPACT ON DIGITAL CAMERA CALIBRATION Ayman Habib; Zahra Lari; Eunju Kwak & Kaleel Al-Durgham University of Calgary Department of Geomatics Engineering 2500 University Drive NW, T2N 1N4 – Calgary – Alberta – Canada
[email protected] Recebido em 08 de Novembro, 2012/ Aceito em 23 de janeiro, 2013 Received on November 08, 2012/ Accepted on January 23, 2013
ABSTRACT The increased resolution and reduced cost of commercially-available digital cameras have led to their use in close range and low-altitude airborne photogrammetric operations. In addition, the widespread adoption of Mobile Mapping and Unmanned Aerial Vehicle systems in various applications increased the demand for 3D reconstruction using Medium-Format Digital Cameras (MFDCs). The interest of professionals who might lack photogrammetric expertise mandates the development of automated procedures, especially camera calibration, for the manipulation of digital imaging systems. This paper deals with an investigation of the type of signalized targets that can be economically prepared while lending themselves to reliable detection and precise localization in the captured imagery. More specifically, checkerboard and circular targets are evaluated. Efficient techniques are introduced for their automated detection and localization as well as semi-automated identification. The impact of the proposed approaches on the quality of derived IOPs is quantified using similarity measures, which evaluate the degree of similarity of the reconstructed bundles from these IOPs. The experimental results show that automated localization of checkerboard and circular targets yield consistent IOPs. However, the detection and localization of checkerboard targets are easier and more robust to the quality of the involved imagery. Therefore, checkerboard targets are recommended as the target of choice for digital camera calibration. Keywords: Digital camera, Calibration, Target Detection, Localization, Identification, Harris operator, Fӧrstner operator
1.INTRODUCTION With the improved performance of low-cost digital cameras, in terms of larger array size, the user community is interested in implementing these cameras for various applications in terrestrial and low-altitude airborne photogrammetry (D’Apuzzo, 2002; Habib et al., 2004; Lichti et al., 2009; Detchev et al., 2011). This interest is motivated by the wide range of applications where these cameras can provide the needed information. Relevant applications include mining industry, environmental monitoring, industrial quality control, architectural documentation, navigation, surveillance, pipeline inspection, infrastructure monitoring, landslide hazard analysis, and indoor localization. However, the variety of possible applications poses some challenges. For example, potential users of these cameras might not have the required level of technical expertise to conduct the necessary photogrammetric
Habib A. et al. operations for the intended application. Among these operations, camera calibration is a common task. The objective of the camera calibration is to derive an accurate estimate of the internal characteristics of the utilized camera. The internal characteristics, which are commonly known as the Interior Orientation Parameters (IOP), include the principal point coordinates – , principal distance – , and any distortions that take place during the data acquisition process (e.g., radial lens distortions, de-centering lens distortions, and affine deformations). Following the camera calibration, the IOP together with the refined image coordinate measurements (i.e., distortion-free image coordinates) define a bundle of light rays that is quite similar to the incident bundle onto the camera at the moment of exposure. Since low-cost digital cameras are not designed and built for mapping purposes, one cannot guarantee the structural integrity of the camera components. As a result, the estimated Interior Orientation Parameters (IOP) at a given time might not be stable. Therefore, the camera calibration should be frequently carried out either to confirm the camera stability or to evaluate the IOP prior to the data acquisition for a given task. Therefore, the photogrammetric community is interested in developing automated techniques for camera calibration with minimal preparation/ interaction by the interested user before/during the calibration process. Utilizing targets that can be easily prepared and adapted for indoor and outdoor calibration test fields would be advantageous to increase the practicality of the camera calibration process. This research is dealing with comparative performance analysis of different types of signalized targets and the impact of their detection, localization, and identification procedures on the quality and the practicality of the camera calibration process. More specifically, the research will be focusing on the following issues: • The impact of the target type on its automated detection, localization, and identification procedures, • The impact of the target type on the quality of the estimated IOP, • The comparative performance of manually-measured and automatically-derived image coordinates of the targets as it relates to the quality of the estimated IOP, 786
• Evaluating the similarities/differences among the estimated IOP sets from the different targets and their extraction procedure, and • Providing a recommendation for the type of targets to be used in the calibration process. To address these issues, this paper commences with a brief review of relevant literature. Afterwards, the proposed methodologies for the detection, localization, and identification ovf checkerboard and circular targets are outlined. Then, the suggested procedures for comparing the estimated interior orientation parameters, derived by camera calibration utilizing different targets, are explained. The performance of the proposed methodologies for target detection, localization, and identification is then evaluated by comparative analysis of the estimated interior orientation parameters from experiments using real data. Finally, the paper presents some conclusions and recommendations for future work. 2. BACKGROUND Traditionally, large format analog cameras have been used for various photogrammetric applications. In recent years, analog cameras have been substituted by digital cameras due to the reduced cost and increased resolution of the latter. The switch by some users from analog to digital cameras has been also inspired by ease of use, increased availability, and rapid development in digital image processing techniques. Available digital cameras can be divided into two groups: large-format digital cameras, which include multi-head frame cameras (e.g., DMC II 250 and RMK D from Z/I-Imaging, and UltraCamD from Microsoft Corporation) and Medium-Format Digital Cameras − MFDCs (e.g., DSS 500 from Applanix, Leica RCD30, Rolleiflex from AIC, DigiCAM from IGI, Phase One, and Hasselblad H3D). MFDCs cannot compete with the ground coverage and resolution capabilities of largeformat digital cameras. However, for close-range applications, low-altitude photogrammetric mapping, smaller flight blocks, UAV-based mapping, and/or in combination with LiDAR systems, MFDCs have become a more practical and cost efficient option. MFDCs can be further classified into two groups. The first group includes MFDCs that have been developed for mapping applications (e.g., DSS 500 from Applanix and Leica RCD30). The second group encompass Revista Brasileira de Cartografia, N0 65/4, p. 785-803, 2013
Automated Detection, Localization, and Identification of Signalized Targets and their Impact cameras that are intended for amateur users (i.e., these cameras are not designed and built with photogrammetric applications in mind). Before using MFDCs in these applications, the camera calibration must be carefully investigated. For large format analog and digital cameras as well as MFDCs intended for mapping applications, a well-defined laboratory calibration process is in place. Such a calibration is usually performed by dedicated organizations (such as NRCan, the USGS, and/or the camera manufacturer), where trained professionals ensure that high calibration quality is upheld. The calibration of MFDCs, which is intended for amateur users, is a more complex task. The complexity is attributed to the large variety of available camera designs, which mandates the development of different calibration approaches (Cramer, 2004). Therefore, it became quite apparent that it is more practical for the data providers to perform their own calibrations and stability analysis. Consequently, the burden of camera calibration has been shifted into the hands of data providers. Such a shift confirms the need for the development of procedures and standards for simple and effective digital camera calibration. The commonly employed technique for digital camera calibration is a bundle adjustment with self-calibration using control information, which is usually available in the form of specifically-marked ground targets – i.e., signalized targets – on a calibration test field. These targets are established and precisely surveyed prior to the calibration process (Fryer, 1996). The automation of the calibration procedure is contingent on automated detection, localization, and identification of these specific targets in the images (Fraser, 1997). Different types of signalized targets have been proposed for automated camera calibration such as crosses (Mikhail and Cantiller, 1985), black dots on a white background (Beyer, 1992), feature-encoded targets (Heuval, 1993), retroreflective targets (Brown, 1984), laser light projected targets (Clarke and Katsimbris, 1994), and color-coded targets (Cronk et al., 2006). For many applications, retro-reflective targets offer the best overall performance. The primary advantage of these targets is the high contrast they have relative to their background. However, the major disadvantages of these targets are Revista Brasileira de Cartografia, N0 65/4, p. 785-803, 2013
their cost, the constraints that they impose on the data acquisition procedure (i.e., using strobe flashlight), and the need for specific targets set-up in the calibration field (Clarke, 1994). The use of strobe flashlight might limit the possibility of the calibration when dealing with cameras with long focal length and/or wide angular field of view. For those cameras, indoor calibration might not be possible due to the large space requirements to ensure the quality of the collected images in terms of appropriate focus and/or extended coverage of the camera’s field of view. Color-coded targets can also be considered as optimal targets when off-the-shelf color cameras are being utilized. However, chromatic aberrations might affect the precision of the target localization. As another alternative to point-based camera calibration, a test field composed of linear features has been investigated by several research groups (Brown, 1971; Chen and Tsai, 1990; Guoqoing et al., 1998; Habib et al., 2002; Habib and Morgan, 2003; Habib and Morgan, 2005). The utilization of linear features for camera calibration offers several advantages such as: 1) ease of establishing the calibration test field, 2) possibility of automatically extracting the linear features from digital imagery, 3) capability of deriving the distortions associated with the utilized camera by observing deviations from straightness in the captured imagery of object space straight lines (Habib and Morgan, 2003). The main problem of utilizing linear features in camera calibration is ensuring their straightness in the object space. For large test fields, ensuring the straightness of the object space straight lines might be practically challenging. Setting up and maintenance of the calibration test field, as well as carrying out the calibration procedure, require professional surveying and photogrammetric expertise, which might limit the potential use of digital cameras in various applications. Therefore, establishing calibration test fields with targets that can be easily prepared, set up, and measured within the images will increase the practicality of the calibration procedure. Another issue when using digital cameras for photogrammetric applications is the stability of their internal characteristics over an extended period of time. Analog and digital metric cameras, which are solely designed for photogrammetric applications, maintain the 787
Habib A. et al. stability of their internal characteristics despite the fact that environmental conditions might affect the distortions, calibrated focal length, and the focus of these cameras (Meier, 1978). However, the majority of available MFDCs are not designed with photogrammetric applications in mind. Therefore, the stability of these cameras should be carefully examined prior to their use. The desired outcome of the stability analysis is to determine whether two IOP sets are equivalent to each other. For this purpose, Shortis et al. (2001) described a method for the evaluation of digital camera stability using the ratio between the mean precision of target coordinates and the largest dimension of the target array. The main disadvantage of this approach is that it does not provide a standard measure for quantitative analysis of the camera’s internal characteristics (IOP). Habib et al. (2006) introduced three methodologies for evaluating the stability of digital cameras. These methods are based on evaluating the degree of similarity between reconstructed bundles using two IOP sets, which are derived from two calibration sessions. These approaches provide quantitative measures which can be utilized by non-professional photogrammetric users of digital cameras to evaluate their stability. For cameras that deemed unstable, the calibration process has to be conducted prior to any data acquisition exercise. This repetitive calibration increases the complexity of using MFDCs. This in turn increases the demand for efficient and automated calibration procedure including the automated detection, localization, and identification of easily prepared and installed targets. 3. METHODOLOGY As it has been mentioned earlier, the development of an automated camera calibration procedure requires automatic detection, localization, and identification of the utilized targets within the collected images. This Automatic procedure is conducted in four steps: • Reduction of image data while avoiding any loss of geometric image quality, • Detection of approximate targets’ locations (interest areas) in the reduced images, • Precise localization of targets’ centers (interest features), and
788
• Identification of precisely localized targets. In the first step of this procedure, the Canny edge detection algorithm (Canny, 1986) is employed to abstract the huge amount of data in the images while preserving their geometric integrity. The main objective of this step is to ensure the computational efficiency of the automated target detection procedure. The second step deals with the detection of instances of the proposed targets within the images. In the third step, the image coordinates of the centers of the utilized targets are precisely derived. In the final step, the precisely localized targets are identified (i.e., the linkage between the object space targets and the automatically-extracted targets in the image space is established). In the following subsections, the detailed explanation of the proposed methodologies for the robust detection, localization, and identification of the utilized targets is presented. Afterwards, the suggested procedures for the assessment of the estimated interior orientation parameters − derived through a self-calibration procedure − are introduced. 3.1 Image Data Reduction The processing of the collected images for the detection and localization of instances of the designed targets starts by the reduction of the image contents. To ensure the computational efficiency of the automated target detection, the Canny edge detection algorithm is applied to extract the edges within the images while preserving the geometric location of the objects giving rise to these edges. This algorithm works in a multi-stage process. In the first step, the image is smoothed through a Gaussian convolution to reduce the noise impact. Then, a 2-D first derivative operator is applied to the smoothed image to determine the gradients of image pixels in the row and column directions. Afterwards, a non-maxima suppression procedure is performed to find the local maxima of the gradients’ magnitude. The pixels with local maximal magnitude are distinguished as strong edges and the edges arising from noise are filtered out using a double thresholding procedure. Final edges are determined by suppressing all edges that are not connected to a strong edge (Figure 1).
Revista Brasileira de Cartografia, N0 65/4, p. 785-803, 2013
Automated Detection, Localization, and Identification of Signalized Targets and their Impact
Fig. 1 - Canny edge detection result: (a) original image and (b) extracted edges. 3.2 Automated Target Detection The signalized targets have been established as distinctive features that can be utilized for automated image coordinate measurements. In order to optimize the automatic camera calibration procedure using automaticallyderived image coordinates for the utilized targets, these targets should be designed while considering the following criteria (Haralick and Shapiro, 1992): • Ability to detect these targets regardless of their location, scale, and orientation, • Precise center point determination capability, • Opportunity of robust recognition of multiple targets, • Opportunity of target detection in images with non-uniform contrast, • Minimal processing time, and • Low manufacturing cost.
these targets within the images and the localization of their centers. In order to approximately detect instances of these targets in the images, the detection of primitive image features (e.g., edges, corners, or regions) is advantageous. In this research, we use corner points as primitive image features, since they provide clues for the detection and/or precise localization of these targets. The corner points can be defined as the points where several dominant edges with different orientations exist in their local neighborhood (Fӧrstner and Gülch, 1987). Therefore, image processing algorithms, which are commonly known as interest operators, are required to extract the corner points in an image. To date, different algorithms have been developed and implemented for the detection and localization of corner points. However, no single algorithm has been generally accepted in the photogrammetric community as the optimal solution for all applications (Jazayeri and Fraser, 2010). This paper reviews two well-known corner detectors (interest operators), i.e., Harris and Fӧrstner, and investigates their suitability for efficient and precise corner detection and localization. • Harris Interest Operator
(a) (b) Fig. 2 - Designed targets: (a) checkerboard target and (b) circular target. Accordingly, two target shapes – checkerboard and circular targets – are evaluated in this research (Figure2). The automated procedure for the extraction of these targets is performed in two steps: the determination of instances of Revista Brasileira de Cartografia, N0 65/4, p. 785-803, 2013
The Harris interest operator, an improvement to the classical Moravec operator (Moravec, 1977), was developed by Harris and Stephens (1988). This operator considers the local changes in the gradients of the extracted edges in both row and column directions to find the corner points. The process starts by deriving the Local Structure Matrix (C) in a user-defined window size as shown in Equation 1. 789
Habib A. et al. • Fӧrstner Interest Operator (1) In Equation 1, Gx and Gy are the derived image gradients in the row and column directions at each edge pixel location by the Canny edge detection procedure. A corner detector measure (MC) for each pixel is then defined using the eigen values of the local structure matrix according to Equation 2 to determine whether a corner point exists in the locally defined window.
(2) Where λ1, λ2 are the eigen values of the local structure matrix (C), k is a constant to discriminate high contrast step edges, and Det(C) and Tr(C) are the determinant and trace of C, respectively. Since the computation of the eigen values of the C matrix is computationally expensive, the corner detector measure is usually computed using the determinant and trace of the local structure matrix. True corner points are finally detected by performing a local nonmaxima suppression of the estimated corner detector measures using a predefined threshold. The Harris interest operator is generally accepted as an efficient approach for corner detection due to its simplicity and computational efficiency compared to other interest operators. However, it suffers from its sensitivity to noise (since it relies on gradient information) and poor localization as illustrated in Figure 3 (El-Hakim, 2002; Remondino, 2006).
The Fӧrstner interest operator was proposed by Fӧrstner and Gülch (1987) with the aim of identifying interest points (corners), interest regions, and edges. This interest operator is based on the assumption that a corner point is the point that is statistically closest to all edge elements intersecting at that corner (Figure 4). It assumes that each locally-defined window with a pre-specified size contains a corner point (xC , yC ). Each edge element within the window defines a straight line passing through the spatial location (xi , yi ) with an orientation (θi ) – which is based on the defined gradient by the Canny edge detection procedure – and a normal distance (ρi ) from the origin. The corner point location (xC , yC ) is estimated through the target function in Equation 3, which aims at estimating the corner point location that minimizes the sum of the squared normal distances between the edge elements within the investigated window and the corner point. The gradient magnitude (pi ) at each edge element is used as a weight for the squared normal distance to control the contribution of this edge element according to its strength. To derive the corner point location, the target function is differentiated w.r.t. (xC , yC ) using approximate values for the corner location, which is usually the center of the investigated window, leading to the normal equations in Equation 4.
(3)
(4)
Fig. 3 - Poor localization of identified corner points by the Harris corner detector.
790
Where N and C are the normal equation matrix and vector, and δx c and δy c are the corrections to the approximate values for the corner point location. Before solving for the normal equations in Equation 4, the Fӧrstner interest operator investigates the variance-covariance matrix of the estimated corner location to check the precision of the derived coordinates. A good corner location is declared only when the variance-covariance matrix defines a small error ellipse that is almost circular. For this purpose, Revista Brasileira de Cartografia, N0 65/4, p. 785-803, 2013
Automated Detection, Localization, and Identification of Signalized Targets and their Impact
Fig. 5 - Accurate localization of identified corner points by the Fӧrstner interest operator. Fig. 4 - Definition of a corner point. the w and q parameters are defined to describe the shape and size of error ellipse, respectively (Equation 5). A larger w indicates a smaller error ellipse while a circular error ellipse will have a maximum q value of 1.
In Equation 5, λ1 and λ2 are the eigen values of the normal equation matrix N, and Det(N) and Tr(N) are the determinant and trace of the normal equation matrix N, respectively. In summary, the Fӧrstner corner detection starts by moving a window with a predefined size over the entire image. For each window location, the normal equation matrix is established and the w and q parameters are defined. Then a local maxima search is established to identify the locations where the w and q parameters define an acceptable precision for the corner location. Only for these locations, the solution to Equation 4 will be sought to estimate the corner point location. Figure 5 illustrates the high precision of the extracted corner locations from the Fӧrstner operator. Due to its precise localization of corner points, the Fӧrstner operator is widely used for different photogrammetric applications. However, it is computationally inefficient (Zhang, et al., 2001; Remondino, 2006). Evaluating the w and q parameters for a moving window throughout the whole image is the most time consuming process. • Proposed Corner Detection Approach The above discussion reveals that the Harris operator is quite efficient. However, it Revista Brasileira de Cartografia, N0 65/4, p. 785-803, 2013
suffers from poor localization of the extracted corner points. On the other hand, the Fӧrstner operator provides precise localization while being computationally inefficient. Therefore, in this research, a two-stage corner point detection procedure, which exploits the computational efficiency and simplicity of the Harris interest operator and the precise positioning capability of the Förstner interest operator, is proposed. In the first step, the Harris corner detector is applied to find the approximate corner locations in a given image. Then, the Förstner interest operator is employed to precisely localize the corner points. In this step, the windows for the estimation of the coordinates of the corner points will be centered at those corners defined by the Harris operator. Therefore, the approximate corner locations defined by the Harris operator will be refined by defining a window centered at those locations to derive the precise coordinates of the corner point that is statistically closest to the edge points in that window (Figure 6). Therefore, the proposed two-step procedure eliminates the Förstner operator component that establishes the w and q parameters for the whole image and the inspection of these values to define the local maxima. Once reliable corner points have been detected and precisely localized, they should be filtered to determine the points, which belong to the targets of interest. For the checkerboard targets, the precise localization of their centers is already established by the proposed corner localization procedure. However, we still need to identify which ones of the localized corners correspond to the center of a checkerboard target. Therefore, a template matching process is performed to identify instances of checkerboard
791
Habib A. et al.
(a)
Fig. 6 - Precise corner localization using the Förstner interest operator. targets among the derived corners. For the circular targets, on the other hand, a procedure will be established for the identification of a set of corner points constituting their rectangular backgrounds. Subsequently, an iterative ellipse fitting procedure is carried out to accurately estimate the centers of circular targets. In the following sub-sections, the proposed procedures for the detection and precise localization of the designed targets will be discussed in detail. 3.1.2 Checkerboard Target Detection As mentioned earlier, the localization of the centers of the checkerboard targets as well as many other features have been already established by the introduced corner localization procedure. Therefore, the remaining issue is the detection of instances of the checkerboard targets among the localized corner points. This detection is carried out by identifying the corner points which correspond to a predefined checkerboard template whose dimensions are less than the size of the checkerboard target (Figure 7.a). The template matching process is performed at each corner location. The correlation between a local window centered at each corner location and the checkerboard template is derived. A checkerboard target will be declared whenever the correlation value at a given corner exceeds a predefined threshold. Since the configuration of the checkerboard targets may be different within the images due to target set-up and/or potential κ-rotation during image acquisition (Figure 7.b), both positive and negative correlation measures will be considered for the detection of instances of these targets. Figure 8 demonstrates the intermediate and final results of the checkerboard target extraction and detection procedures. 792
(b) Fig. 7 - (a) The checkerboard template and (b) possible orientation variation of checkerboard targets as a result of κ-rotation during image acquisition. 3.2.2 Circular Target Detection and Localization In this subsection, the proposed procedure for the detection of circular targets and precise localization of their centers is described. As it has been illustrated in Figure 2.b, the utilized circular targets in this research have been superimposed on a black rectangular background. Therefore, the identification of instances of these bounding rectangles, through their corner points, can facilitate the detection of circular targets. In order to detect these rectangles, the extracted corner points are firstly organized in a two-dimensional kd-tree data structure. For each of the corner points, its three nearest neighboring corner points are determined. A simple shape checker algorithm is then applied to decide whether these corner points define a rectangular shape or not. Since the perspective view of rectangular targets in the object space might affect the rectangularity of its appearance in the image space (i.e., due to the relative tilt between the image plane and the plane enclosing the object space rectangle), the corner points in question will be considered as the corners of a rectangular shape if they define a parallelogram. To verify that these corner points correspond to the corners of a black rectangle on a white background, a correlation-based template matching is performed to identify the similarity between a local window centered at each corner and the four templates in Figure 9, which correspond to upper left, upper right, lower left, and lower right corners of a black rectangle on Revista Brasileira de Cartografia, N0 65/4, p. 785-803, 2013
Automated Detection, Localization, and Identification of Signalized Targets and their Impact a white background. If the correlation measure
(a)
among the image corners and decide whether it matches the topology of the corner points of a single black rectangle on a white background. For example, the upper left image corner should be matched with the template that corresponds to the upper left corner. Figure 10.a is an illustration of identified corner points with the correct topology while Figure 10.b is a depiction of a scenario where the four corner points belong to two black rectangles on a white background.
(a)
(b)
(c)
(d)
(b)
(c)
Fig. 9 - Utilized templates for the detection of the corners of a black rectangle on a white background: (a) upper left, (b) upper right, (c) lower left, and (d) lower right.
(a) (d) Fig. 8 - Checkerboard target localization and detection procedures: (a) original image, (b) detected corners by the Harris Operator (pink crosses), (c) modified Corners by the Förstner operator (red crosses), and (d) the localized and detected center of the checkerboard target after correlation filtering (cyan cross). between each of these templates and the local window centered at any of the corners’ locations is more than a predefined threshold, that corner is considered to be a corner of a black rectangle on a white background. To ensure that the four corners correspond to a single black rectangle on a white background, we check the topology Revista Brasileira de Cartografia, N0 65/4, p. 785-803, 2013
(b)
Fig. 10 - (a) Corner points whose topology defines a single black rectangle on a white background and (b) the topology of corner points that belong to two different black rectangles. Once the corners of the background rectangle have been identified, the center of that rectangle is used as an approximate location of the center of the circular target. Therefore, the next step is to derive the precise location of the center of the circular target, which is achieved through an iterative ellipse fitting through the dominant edge pixels within the bounding rectangle. The first step of the ellipse fitting procedure is identifying the edge pixels, within the background rectangle, whose magnitudes are more than a predefined threshold. These edge pixels are assumed to correspond to the 793
Habib A. et al. perimeter of the circular target due to the high contrast between the circular target and its black background. The parameters describing the best-fitting ellipse (El) – Equation 6 – through these edges are estimated using a least-squares adjustment procedure while satisfying the constraint in Equation 7 (Fitzgibbon et al., 96). After the estimation of the parameters of the best-fitting ellipse, the precise location of the circular target’s center (i.e., ellipse center), denoted by (xCT, yCT ), can be estimated according to Equation 8.
(6) (7)
(8)
Since some of the edge pixels within the bounding rectangle might not correspond to the perimeter of a circular target, an iterative ellipse fitting procedure is incorporated to filter out these edge pixels. To identify these edge pixels, the distance between the coordinates (xp, yp) of an edge pixel P and the best-fitting ellipse – dist(P,El) – is evaluated using Equation 9. If this distance is larger than a predefined threshold, which can be set to one or two pixels, the edge pixel is eliminated from the next ellipse fitting procedure. This iterative process is repeated until no further edge pixels could be eliminated. Figure 11 illustrates the progression of the filtered edge pixels, which are illustrated in red, within the iterative ellipse fitting procedure. The figure also shows the convergence of the estimated center as shown by the green cross towards the real center of the circular target, which is depicted by the yellow cross.
(9) After precise positioning of the detected circular target’s center, the corners of its bounding rectangle will be removed from the 794
Fig. 11 - The iterative ellipse fitting procedure (filtered edge pixels are shown in red, while the estimated and real centers are depicted as green and yellow crosses, respectively). established two-dimensional kd-tree structure and the next bounding rectangle enclosing a circular target is searched for using the above-mentioned procedure. This procedure continues until no more bounding rectangles can be identified within the images. Figure 12 shows the intermediate and final results of the proposed procedure for the detection and precise localization of a circular target. 3.3 Semi-automated Identification of the Detected and Localized Targets So far, we have discussed the proposed approaches for the detection and precise localization of the utilized targets. Next, we need to assign the proper ID to the automaticallyextracted targets. This identification process is carried out by assigning the IDs of a set of pre-surveyed ground control points within the calibration test field to the automaticallyextracted targets. In this section, we introduce a semi-automated procedure for the identification of these targets in the different images. The process starts by manual identification of three of the automatically-extracted targets as shown in Figure 13. Those targets, together with their corresponding object space targets, are used in a single photo resection procedure (SPR) to identify the geo-referencing parameters of the image in question. To ensure reliable estimation of the geo-referencing parameters, the three points should not be collinear and should be further apart from each other as much as possible. For the SPR, the nominal values for the interior orientation parameters are incorporated in the least-squares adjustment procedure for the estimation of the geo-referencing parameters (e.g., only the nominal value for the principal distance is used while assuming zero values for the principal point coordinates and the distortions parameters). The estimated geo-referencing Revista Brasileira de Cartografia, N0 65/4, p. 785-803, 2013
Automated Detection, Localization, and Identification of Signalized Targets and their Impact
(a)
(b)
targets, the nearest automatically-extracted target is derived. A projected surveyed target and its nearest extracted image target will be considered a match only if the distance between them is not more than half of the average distance between the neighboring extracted targets which have been identified by the proposed procedure. For a matched pair, the ID of the projected surveyed target will be assigned to its nearest automatically-extracted target. Figure 14 illustrates a projected surveyed target (red point) and its neighboring automatically-extracted target (yellow point). The above procedure is repeated for all the projected surveyed targets and all the images covering the calibration test field.
(c) Fig. 13 - Configuration of manually identified targets for the identification of extracted targets.
(d) Fig. 12 - Circular target detection and localization procedure: (a) original image, (b) detected corners by Harris Operator (pink crosses), (c) detected bounding rectangle (blue rectangle) and the edge pixels contributing towards the estimation of the parameters of the best-fitting ellipse (orange edge pixels), and (d) estimated center of the circular target (yellow cross). parameters together with the nominal values for the interior orientation parameters are then utilized to project the pre-surveyed targets to the image space. In order to identify the IDs of automatically-extracted targets, they are first organized in a two dimensional kd-tree data structure. For each of the projected surveyed Revista Brasileira de Cartografia, N0 65/4, p. 785-803, 2013
Fig. 14 - Projected surveyed target (red point) and its neighboring automatically-extracted target (yellow point). 3.4 Proposed Procedure for the Assessment of the Estimated Interior Orientation Parameters One of the main objectives of this research is to evaluate the impact of the automaticallyderived image coordinates for different targets on the quality of the estimated IOPs from the camera calibration procedure. Therefore, qualitative and quantitative evaluation methodologies need to 795
Habib A. et al. be established for the comparative analysis of the derived camera calibration results using different target types. Qualitative evaluation is conducted by simply evaluating the similarity of the numerical values of the derived IOPs using different types of measurement techniques and/ or different types of targets. The existence of significant difference between these estimated IOP sets indicates that there is a problem either in the target extraction process or the selfcalibration procedure. The quantitative evaluation of the estimated interior orientation parameters from different calibration procedures is performed using the proposed camera stability analysis approaches by Habib et al. (2006). The conceptual basis of these procedures is based on the ultimate objective of the camera calibration procedure, which aims at reconstructing a bundle of light rays that is as similar as possible to the incident bundle onto the camera at the moment of exposure. Therefore, the proposed IOP similarity analysis is based on evaluating the degree of similarity between the reconstructed bundles of light rays from two IOP sets. In this research, the derived IOPs from the calibration procedure using different types of measurement techniques and/ or different types of targets are compared and their equivalence is quantitatively assessed. The equivalency analysis starts by reconstructing two bundles from these IOP sets. To do that, a synthetic regular grid is initially defined in the image plane. The available IOP sets are then utilized to remove the distortions at the defined grid vertices (Figure 15.a). The two bundles of light rays are then reconstructed by connecting the perspective center – whose position relative to the image plane is defined by the principal distance and principal point coordinates – to the distortion-free coordinates of the grid vertices (Figure 15.b). These two bundles are finally compared to assess their similarity using one of two approaches, which are denoted by ZROT and ROT. The main difference between these approaches is the imposed constraints on the orientation of the two bundles prior to the evaluation of the similarity measures.
(a)
(b) Fig. 15 - (a) Top view of the original and distortion-free vertices of the defined grid along the image plane and (b) a side view of the defined bundles of light rays by the IOP sets before evaluating their similarity. The two bundles are forced to share the same perspective center and optical axis. The similarity between the bundles is evaluated by computing the spatial offset between conjugate light rays – i.e., light rays that correspond to the same original grid vertex – along the image plane. Since the two IOP sets might have different principal distances, the defined points by one of the IOP sets are projected onto the image plane defined by the second IOP set (Figure 16). The Root Mean Square Error of the discrepancies between the conjugate points following the projection from one image plane onto the other (RMSEoffset) is used as the quantitative measure for evaluating the degree of similarity between the two bundles. The two bundles (IOP sets) will be deemed similar if the RMSEoffset is within the expected noise in the image coordinate measurement accuracy, which is usually in the range of half a pixel.
Fig. 16 - The offset between distortion-free coordinates in the ZROT method.
• Zero Rotation Method (ZROT)
• Rotation Method (ROT)
In the Zero Rotation method, two constraints are imposed on the reconstructed bundles
In contrast to the ZROT bundle similarity approach, the ROT method allows for a
796
Revista Brasileira de Cartografia, N0 65/4, p. 785-803, 2013
Automated Detection, Localization, and Identification of Signalized Targets and their Impact differential rotation between the two bundles, while sharing the same perspective center, to enhance the similarity level (Figure 17). Therefore, the ROT approach starts by estimating the rotation angles (ω, φ, κ) that can be applied to one bundle to make it coincide with the other one as much as possible. A least-squares adjustment is utilized to determine these rotation angles. The square root of the estimated a-posteriori variance factor, which represents the spatial offset between the rotated bundles along one of the image planes, is used to quantitatively evaluate the similarity between the two bundles. The bundles are deemed similar if the square root of the a-posteriori variance factor, which will be also denoted by RMSEoffset, is within the range of the noise in the image coordinate measurements.
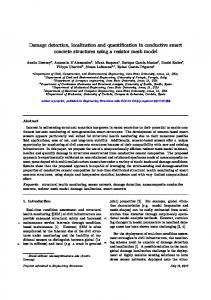
gle-lens reflex (SLR) camera (Figure 18). The camera has an array dimension of 103287760 pixels with 5.2μm pixel size and a 55mm nominal focal length. This camera has a 53.7mm40.4mm CCD sensor with a 3.2” LCD screen. A total of ten images of a 3D calibration test field were captured from different positions and orientations. A schematic illustration of the test field and the location/orientation of the acquired images are illustrated in Figure 19. The test field has 689 control points (339 checkerboard targets and 350 circular targets), which were precisely surveyed using a total station. Figure 20 illustrates one of the captured images of the test field.
Fig. 18 - Phase One IQ180 digital camera. Fig. 17 - The two bundles in the ROT method are rotated to reduce the angular offset between conjugate light rays. Comparing the above-mentioned measures, the ZROT approach will be more conservative than the ROT approach since it evaluates the similarity without any modification to the generated bundles to enhance their coincidence. The comparative performance and the impact of the different target types and their extraction on the derived IOP sets from the camera calibration will be presented in the experimental results section. 4. EXPERIMENTAL RESULTS In this section, experiments with real data are conducted to analyze the suitability and performance of the proposed target types and their automated extraction procedures as they relate to camera calibration. The performance of the automated extraction of the image coordinates will be also compared to manual measurements of the involved targets. 4.1 Dataset Description The utilized dataset in this research work was acquired by a Phase One IQ180 digital sinRevista Brasileira de Cartografia, N0 65/4, p. 785-803, 2013
Z
Fig. 19 - The calibration test field together with the position and orientation of the captured images. 4.2 The Impact of Target Types on Their Automated Extraction Rate
Y
The first objective of the comparative performance analysis is to evaluate the detection rate of the proposed automated image coordinate measurement approaches for checkerboard and circular targets. First, the image coordinates of checkerboard and circular targets in the calibration images are manually derived. The
797
X
Habib A. et al. compared to checkerboard targets. 4.3 The Impact of Target Types on Their Manual and Automated Image Coordinate Measurements
Fig. 20 - Sample image of the test field with checkerboard and circular targets. proposed procedures are then applied for the automated detection and localization of these targets. Table 1 lists the number of manuallymeasured and automatically-derived instances of each target type. The automated target extraction rate is derived as the percentage of manuallymeasured targets which are automatically extracted. Based on the reported results in Table 1, one can observe that a higher percentage of checkerboard targets are automatically extracted when compared to the circular targets (i.e., 86% of the checkerboard targets have been automatically extracted while only 55% of the circular targets have been automatically extracted). Therefore, it can be concluded that the automated extraction of circular targets is more sensitive to the imaging conditions when
The second objective of the comparative performance analysis is to evaluate the impact of the proposed target types on the compatibility of manually and automaticallyderived measurements. For this analysis, the mean, standard deviation, and root mean square error (RMSE) of the differences between the manually-measured and automatically-derived image coordinates for the checkerboard and circular targets are reported in Tables 2 and 3, respectively. The comparison of the estimated mean, standard deviation, and RMSE values for checkerboard and circular targets shows that manual and automated measurements of checkerboard targets exhibit differences in the range of half of a pixel (RMSE values in x and y directions are 0.0037mm and 0.0033mm, respectively). However, the manual and automated measurements of the circular targets exhibit differences in the range of one pixel (RMSE values in x and y directions are 0.0054mm and 0.0064 mm, respectively). Therefore, one can conclude that the checkerboard targets lend themselves to more consistent manual and automatic image coordinate measurements when compared to circular targets.
Table 1: Statistics of manually-measured and automatically-derived checkerboard and circular targets Target Type Number of manually-measured targets
Checkerboard Targets 1969
Circular Targets 2049
Number of automatically-derived targets
1691
1128
Table 2: The mean, standard deviation, and RMSE of the differences between manually-measured and automatically-derived image coordinates of the checkerboard targets X
Y
Mean (mm)
0.0016
-0.0006
Standard deviation (mm)
0.0034
0.0032
RMSE(mm)
0.0037
0.0033
Table 3: The mean, standard deviation, and RMSE of the differences between manuallymeasured and automatically-derived image coordinates of th e circular targets
798
X
y
Mean (mm)
0.0006
-0.0026
Standard deviation (mm)
0.0054
0.0058
RMSE(mm)
0.0054
0.0064t
Revista Brasileira de Cartografia, N0 65/4, p. 785-803, 2013
Automated Detection, Localization, and Identification of Signalized Targets and their Impact 4.4 Predicted Precision of the Target Localization by the Calibration Procedure The main objective at this stage is to evaluate the predicted precision of the different target localization techniques by the implemented camera calibration procedure. For this purpose, four different camera calibration procedures were performed using manually-measured and automatically-derived image coordinates of checkerboard and circular targets. Tables 4 and 5 list the estimated IOP sets (coordinates of principal point – xp, yp, principal distance – c, and radial lens distortion parameters – k1, k2) from each of the conducted camera calibration procedures. The tables also report the a-posteriori variance factor, which is a measure of the quality of fit between the image measurements and estimated IOPs as expressed by the mathematical model (i.e., the collinearity equations). For a well-modeled system, the square root of the a-posteriori variance factor corresponds to the predicted precision of the image coordinate measurements since it is directly derived from the estimated image coordinate residuals following the bundle adjustment procedure. The analysis of the estimated a-posteriori variance factors indicates that the checkerboard targets lend themselves to better (i.e., more
precise) manual measurements when compared to circular targets (0.0013mm vs. 0.0034mm). However, the automated extraction of the checkerboard and circular targets has similar precision for either type of target (0.0026mm vs. 0.0024mm). 4.5 IOP Similarity Tests The objective of the last stage of the experimental results is to evaluate the similarities/ differences among the estimated IOP sets from the coordinates of checkerboard and circular targets that have been manually measured or automatically derived. The IOP similarity tests are performed using the ZROT and ROT approaches, which have been described in section 3.4. For the IOP similarity tests, we used the following symbols to distinguish the different IOP sets. • IOP set derived from manually-measured image coordinates of checkerboard targets is denoted by A. • IOP set derived from manually-measured image coordinates of circular targets is denoted by B. • IOP set derived from automatically-derived image coordinates of checkerboard targets is denoted by C.
Table 4: Estimated IOPs using manually-measured image coordinates of checkerboard and circular targets Target Type Square root of the a-posteriori variance factor xp (mm) yp (mm) c (mm) k1 k2
Checkerboard Targets
Circular Targets
0.0013
0.0034
0.0083
0.0030
0.1683 54.9355
0.1580 54.9649
-0.0000241872 0.0000000117
-0.0000247038 0.0000000122
Table 5: Estimated IOPs using automatically-derived image coordinates of checkerboard and circular targets Target Type Square root of the a-posteriori variance factor xp (mm) yp (mm)
Checkerboard Targets
Circular Targets
0.0026
0.0024
0.0076 0.1645
0.0062 0.1637
c (mm) k1
54.9251 -0.0000242628
54.9407 -0.0000240788
k2
0.0000000118
0.0000000114
Revista Brasileira de Cartografia, N0 65/4, p. 785-803, 2013
799
Habib A. et al. • IOP set derived from automaticallyderived image coordinates of circular targets is denoted by D. To investigate the similarity between the estimated IOP sets from manual and automatic measurement of the image coordinates of the same target type, the ZROT and ROT similarity measures are listed in Table 6 for the checkerboard and circular targets. From the reported similarity measures in Table 6, one can conclude the following: i. The estimated IOPs from the manuallymeasured and automatically-derived image coordinates of checkerboard targets are quite similar (RMSEsOffset are 0.0037mm and 0.0026mm for the ZROT and ROT similarity evaluation, respectively). The IOP similarity is valid even for the ZROT evaluation, which is stricter than ROT. ii. For the manually-measured and automatically-derived image coordinates of circular targets, one can observe higher level of dissimilarity between the derived IOP sets (RMSEsOffset are 0.0068mm and 0.0043mm for the ZROT and ROT similarity evaluation, respectively). The ZROT is showing a dissimilarity level at the range of one pixel, which is quite similar to the observed incompatibility between the manually-measured and automatically-derived image coordinates of the circular targets (refer to Table 3). The next experiment aims at evaluating the similarity between IOP sets derived from manual or automated measurements of different target types. The ZROT and ROT similarity measures between the estimated IOP sets from
manually-measured and automatically-derived image coordinates for checkerboard and circular targets are reported in Table 7. From the reported numbers in Table 7, one can conclude the following: i. The derived IOP sets from the manuallymeasured image coordinates of checkerboard and circular targets exhibit some differences – especially when checking the ZROT similarity measure (RMSEs offset are 0.0098mm and 0.0052mm for the ZROT and ROT similarity evaluation, respectively). This dissimilarity occurs due to the lower precision of manuallymeasured image coordinates of circular targets (refer to Table 4). The derived IOP sets from the automaticallyderived image coordinates of the checkerboard and circular targets exhibit a similarity level at the half-pixel range (RMSEsoffset are 0.0037mm and 0.0035mm for the ZROT and ROT similarity evaluation, respectively). This high level of similarity between the derived IOP sets from either set of measurements is expected since the automatically-derived image coordinates of checkerboard and circular targets exhibit the same level of precision as estimated by the square root of a-posteriori variance factor (refer to Table 5). 5. CONCLUSIONS AND RECOMMENDATIONS FOR FUTURE RESEARCH WORK Recent developments in the digital imaging technology have increased the availability of digital cameras at a reasonable cost. These advances led to the interest in using these cameras for photogrammetric reconstruction to
Table 6: The similarity measures for the estimated IOPs from manually-measured and automaticallyderived coordinates of the same target type IOPI
IOPII
ZROT Test RMSEsOffset (mm)
ROT Test RMSEsOffset (mm)
A B
C D
0.0037 0.0068
0.0026 0.0043
Table 7: The similarity measures for the estimated IOP sets from checkerboard and circular targets that have been manually measured or automatically derived IOPI
800
IOPII
A
B
ZROT Test RMSEsOffset (mm) 0.0098
C
D
0.0037
ROT Test RMSEsOffset (mm) 0.0052 0.0035
Revista Brasileira de Cartografia, N0 65/4, p. 785-803, 2013
Automated Detection, Localization, and Identification of Signalized Targets and their Impact satisfy the needs of a wide range of applications. The diversity of the end users, who might lack photogrammetric expertise, and the variety in the camera designs mandate the development of automated calibration techniques that require minimal effort before and during the calibration process. An important issue in the camera calibration is the type of utilized targets. The target manufacturing cost and the ability to accurately derive its coordinates in the captured imagery are key components that should be analyzed in terms of their impact on the calibration process. This paper introduced approaches for the automated detection and precise localization of checkerboard and circular targets. A computationally-efficient and precise corner localization interest operator is introduced to take advantage of the complementary characteristics of the Harris and Förstner operators. Then, a semi-automated technique is introduced for the identification of precisely localized targets (i.e., assign the proper IDs for the extracted targets). In order to evaluate the impact of the different target types and their localization on the camera calibration, previously-developed camera stability measures have been used to assess the similarity among the different IOP sets. The experimental testing aimed at investigating the impact of using checkerboard and circular targets as well as the comparative performance of the manuallymeasured and automatically-derived coordinates on the derived IOPs. The conducted experiments led to the following conclusions: • The automated detection of circular targets is more sensitive to the quality of the captured imagery when compared to checkerboard targets. • Checkerboard targets lend themselves to better/more precise manual image coordinate measurements when compared to circular targets. • Automatically-derived image coordinates of checkerboard and circular targets exhibit similar precision. • Derived IOPs from manually-measured and automatically-derived image coordinates of checkerboard targets are quite similar. • Derived IOP from manually-measured and automatically-derived image coordinates of circular targets exhibit some dissimilarity. • The derived IOP sets from manuallyRevista Brasileira de Cartografia, N0 65/4, p. 785-803, 2013
measured image coordinates of checkerboard and circular targets exhibit some dissimilarity due to the lower precision of manually-measured image coordinates of circular targets. • There is a good level of similarity between the derived IOP sets from automatically-measured image coordinates of checkerboard and circular targets. Based on the above findings, the checkerboard targets are recommended as the target of choice since they lend themselves to more accurate and consistent calibration whether they have been either manually measured or automatically extracted. Moreover, the automated detection of checkerboard targets is more robust than that for circular targets. Future research work will focus on the use of RANSAC-based approach to completely automate the identification of the automatically-derived targets. The performance of the RANSAC-based approach will be compared to the use of some coded targets to fully automate the target identification procedure. REFERENCES Beyer, H. Geometric and Radiometric Analysis of a CCD Camera Based Photogrammetric Close-Range System, PhD thesis, publised by Institut für Geodäsie und Photogrammetrie, ETH-Hönggerberg, Zürich. 1992, 186 p. Brown, D. Close-range Camera Calibration, Journal of Photogrammetric Engineering and Remote Sensing, v. 37, n. 8, p. 855-866, 1971. Brown. D., 1984. Tools of the Trade, Close-range Photogrammetry and Surveying - State of the Art, The American Society of Photogrammetry, 1984, 941 p. Canny, J. A computational approach to edge detection, IEEE Trans. on Pattern Analysis and Machine Intelligence, v. PAMI-8, p. 679698, 1986. Chen S. and Tsai W. A Systematic Approach to Analytic Determination of Camera Parameters by Line Features, Pattern Recognition, v. 23, n. 8, p. 859-877, 1990. Clarke. T.A. and Katsimbris. A. The use of diode laser collimators for targeting 3-D objects, International Archives of Photogrammetry and Remote Sensing. v. 30, n. 5, p. 47-54, 1994.
801
Habib A. et al. Clarke, T.A. An analysis of the properties of targets used in digital close range photogrammetric measurement, Videometrics III. SPIE, v. 2350, p. 251- 262, 1994. Cramer, M. EUROSDR Network on Digital Camera Calibration, International Archives of Photogrammetry and Remote Sensing, XXth ISPRS Congress, Istanbul, Turkey, v. 35(B3), p. 210-215, 2004. Cronk, S., Fraser, C. S. and Hanley, H. S. Automatic Metric Calibration of Colour Digital Cameras, Journal of Photogrammetric Record, v. 21, n. 116, p. 355–372, 2006. D’Apuzzo, N. Modeling Human Faces with Multi-Image Photogrammetry, Three Dimensional Image Capture and Applications V , Proceedings of SPIE, San Jose, California, v. 4661, p.191-197, 2002. Detchev, I., Habib, A., Chang, Y.C. Image Matching and Surface Registration of a Scoliotic Torso, Geomatica, v. 65, n. 2, p. 175-187, 2011. El-Hakim, S. F. Semi-automatic 3D Reconstruction of Occluded and Unmarked Surfaces from Widely Separated Views, International Archives of the Photogrammetry, Remote Sensing and Spatial Information Sciences, v. 34(5), p. 143–148, 2002. Fitzgibbon, A., Pilu, M. and Fisher R. Direct Least-square Fitting of Ellipses, International Conference on Pattern Recognition, Vienna, 1996. Förstner, W. and Gülch, E., A Fast Operator for Detection and Precise Location of Distinct Points, Corners and Centres of Circular Features, Proceedings of ISPRS Intercommision Conference on Fast Processing of Photogrammetric Data, Interlaken, Switzerland, p. 281-305, 1987. Fraser, C. S. Innovations in Automation for Vision Metrology Systems, Journal of Photogrammetric Record, v. 15(90), P. 901-911, 1997. Fryer, J.G. Camera Calibration, Close Range Photogrammetry and Machine Vision, Whittles Publishing, Scotland, p.156-179, 1996. Guoqing, Z., Ethrog, U., Wenhao, F. and Bao802
zong, Y. CCD Camera Calibration Based on Natural Bandmarks, Pattern Recognition, v. 31, n. 11, p. 1715-1724, 1998. Habib, A., Morgan M. and Lee, Y. Bundle Adjustment with Self-Calibration using Straight Lines, Journal of Photogrammetric Record, v. 17, n. 100, p. 635-650, 2002. Habib, A. and Morgan, M. Automatic Calibration of Low Cost Digital Cameras, SPIE Journal of Optical Engineering, v. 42, n. 4, p. 948-955, 2003. Habib, A., Ghanma, M., Al-Ruzouq, R., and Kim, E. 3-D Modeling of Historical Sites Using Low-Cost Digital Cameras, XXth ISPRS Congress, Commission 5, SS4-CIPA-Low-Cost Systems in Recording and Managing the Cultural Heritage, Istanbul, Turkey, p. 570, 2004. Habib, A. and Morgan, M., 2005. Stability Analysis and Geometric Calibration of Off-the-Shelf Digital Cameras, Journal of Photogrammetric Engineering and Remote Sensing, v. 71, n. 6, p. 733-741, 2005. Habib, A., Pullivelli, A., Mitishita, E., Ghanma, M. and Kim E. Stability Analysis of Low-cost Digital Cameras for Aerial Mapping Using Different Geo-referencing Techniques, Journal of Photogrammetric Record, v. 21, i. 113, p. 29-43, 2006. Haralick, R. M. and Shapiro, L.G. Computer and Robot Vision, v. 1, Addison-Wesley publishing company, 1992. 630 p. Harris, C. and Stephens, M. A Combined Corner and Edge Detector, Proceedings of Fourth Alvey Vision Conference, Manchester, UK, p. 147-151, 1988. Jazayeri, I. and Fraser, C.S. Interest Operators for Feature-based Matching in Close Range Photogrammetry, Journal of Photogrammetric Record, v. 25, i. 129, p. 24-41, 2010. Lichti, D. D., Habib, A. and Detchev, I. An Object-space Simulation Method for Low-cost Digital Camera Stability Testing, Photogrametric Engineering and Remote Sensing, v. 75, n. 12, p.1407-1414, 2009. Meier, H. K. The Effects of Environmental Conditions on the Distortion, Calibrated Focal Revista Brasileira de Cartografia, N0 65/4, p. 785-803, 2013
Automated Detection, Localization, and Identification of Signalized Targets and their Impact Length and Focus of Aerial Survey Cameras, International Archives of Photogrammetry, v. 22, n. 1, 9 p., 1978. Mikhail. E.M, & Cantiller. D.B. Geometric effects of digital image processing operations, Technical papers, 51st Annual meeting of ASPRS, v. 52, p. 717-724, 1985. Moravec, H. P. Towards Automatic Visual Obstacle Avoidance, Proceedings of Fifth International Joint Conference on Artificial Intelligence, p. 584, 1977. Remondino, F. Detectors and Descriptors for Photogrammetric Applications, International Archives of Photogrammetry, Remote Sensing and Spatial Information Sciences, ISPRS Commission III Symposium, Bonn, Germany, v.
Revista Brasileira de Cartografia, N0 65/4, p. 785-803, 2013
XXXVI,, pp. 49-54, 2006. Shortis, M. R., Ogleby, C. L., Robson, S., Karalis, E. M. and Beyer, H. A., Calibration Modeling and Stability Testing for the Kodak DC200 Series Digital Still Camera, Videometrics and Optical Methods for 3D Shape Measurements. SPIE 4309, p. 148–153, 2001. van den Heuval, F.A. and Kroon, R.J.G.A. Digital close range photogrammetry using artificial targets, International Archives of Photogrammetry and Remote Sensing, v. 29, n. 5. pp. 222-229, 1993. Zhang, Y., Lin, Z., and Zhang, J. An Image Mosaicking Approach Based on Image Matching and Adjustment, Journal of Image and Graphics, v. 6(A), n. 4, p .338-342, 2001.
803