May 12, 2011 - [6] V. Kumar, Y. Gu, S. Basu, et al, âRadiomics: the process and the ... by noninvasive imaging using a quantitative radiomics approach,â.
Automated detection and quantification of residual brain tumor using an interactive computer-aided detection scheme Kevin P. Gaffney Faranak Aghaei James Battiste Bin Zheng
Downloaded From: https://www.spiedigitallibrary.org/conference-proceedings-of-spie on 8/21/2017 Terms of Use: https://spiedigitallibrary.spie.org/ss/TermsOfUse.aspx
Automated Detection and Quantification of Residual Brain Tumor Using an Interactive Computer-aided Detection Scheme Kevin P. Gaffney 1, Faranak Aghaei 2, James Battiste 3 , Bin Zheng 2 1
2
School of Computer Sciences, University of Oklahoma, Norman, OK 73019
School of Electrical and Computer Engineering, University of Oklahoma, Norman, OK 73019 3
Health Science Center of University of Oklahoma, Oklahoma City, OK 73104
ABSTRACT Detection of residual brain tumor is important to evaluate efficacy of brain cancer surgery, determine optimal strategy of further radiation therapy if needed, and assess ultimate prognosis of the patients. Brain MR is a commonly used imaging modality for this task. In order to distinguish between residual tumor and surgery induced scar tissues, two sets of MRI scans are conducted pre- and post-gadolinium contrast injection. The residual tumors are only enhanced in the post-contrast injection images. However, subjective reading and quantifying this type of brain MR images faces difficulty in detecting real residual tumor regions and measuring total volume of the residual tumor. In order to help solve this clinical difficulty, we developed and tested a new interactive computer-aided detection scheme, which consists of three consecutive image processing steps namely, 1) segmentation of the intracranial region, 2) image registration and subtraction, 3) tumor segmentation and refinement. The scheme also includes a specially designed and implemented graphical user interface (GUI) platform. When using this scheme, two sets of pre- and post-contrast injection images are first automatically processed to detect and quantify residual tumor volume. Then, a user can visually examine segmentation results and conveniently guide the scheme to correct any detection or segmentation errors if needed. The scheme has been repeatedly tested using five cases. Due to the observed high performance and robustness of the testing results, the scheme is currently ready for conducting clinical studies and helping clinicians investigate the association between this quantitative image marker and outcome of patients. Keywords: Interactive computer-aided detection (ICAD), Detection of residual brain tumor, Brain MRI, Quantitative MR image marker.
1.
PURPOSE
According to the American Cancer Society’s statistics for brain and spinal cord cancer for 2015, around 23,000 new cases of brain or spinal cord cancer will be diagnosed in adults [1]. Brain and spinal cord tumors are the second most common cancers in children, with around 4,000 new cases each year [2]. It is estimated that over 16,000 people will die from brain or spinal cord cancer this year. To treat brain cancer, a surgical procedure is first applied to remove the primary tumors. In order to limit impact on nervous system function, it is critical to minimize the removal of surrounding healthy or normal tissue. For this reason, some cancerous tissue may unintentionally be left behind during surgery. After surgery, patients are commonly given chemotherapy or radiation therapy to eliminate remaining cancer cells to prevent cancer recurrence. Thus, an accurate assessment of remaining tumor volume is necessary to determine success of surgery and aggressiveness of continuing treatment. For this purpose, magnetic resonance imaging (MRI) is currently used as the standard of care following the resection of a brain tumor in clinical practice. This includes imaging in both the immediate postoperative setting as well as long-term surveillance imaging following surgery. The primary goal of MR imaging in this clinical context is the assessment of posttreatment related changes, including post-operative hemorrhage, post-operative scar, radiation related changes and postoperative ischemia, as well as the presence of residual or recurrent tumor. In order to Medical Imaging 2017: Computer-Aided Diagnosis, edited by Samuel G. Armato III, Nicholas A. Petrick, Proc. of SPIE Vol. 10134, 101342I · © 2017 SPIE · CCC code: 1605-7422/17/$18 · doi: 10.1117/12.2254501
Proc. of SPIE Vol. 10134 101342I-1 Downloaded From: https://www.spiedigitallibrary.org/conference-proceedings-of-spie on 8/21/2017 Terms of Use: https://spiedigitallibrary.spie.org/ss/TermsOfUse.aspx
distinguish the residual tumor-associated tissues from other surgery or radiation induced scars, MRI scans are performed twice pre- and post-gadolinium contrast injection. The residual tumor-associated tissues only enhance on the postcontrast injection images, while the non-tumor scars may enhance on both pre- and post-contrast injection images. Visually identifying residual tumor from two sets of MR images and quantifying tumor volume is a difficult task for radiologists. It has also been shown that using the image marker based on three-dimensional volumetric assessment is more effective than using one- and two-dimensional methods (e.g., RECIST guidelines [3]) at predicting clinical outcome of brain cancer patients [4]. In addition, manual tracing of enhanced tissue boundary by the MR technologists is often inaccurate and prone to the inter-reader variability [5]. In recent years, computer-aided detection and/or diagnosis (CAD) has emerged as an effective technology for assisting radiologists in increasing the accuracy of disease diagnosis and/or assessment of treatment efficacy [6-9]. Although the potential clinical utility of CAD has been well-documented [10], few CAD systems have been accepted by clinicians in their decision-making process. For example, the “black box” approach of many CAD systems reduced confidence of radiologists in CAD-cued results [11, 12]. To overcome this challenge, investigators have been developing and testing interactive computer-aided detection (ICAD) systems to increase the transparency of the schemes and improve radiologists’ confidence in the results [12-14]. This study presents a new ICAD approach to develop and apply an automated scheme to identify, segment and then quantify post-surgical residual tumor volume. A specifically designed and implemented graphical user interface (GUI) displays the major steps of the scheme and allows the radiologist to interact with the computer’s assessment.
2. METHODS The automated or computer-aided detection (CAD) scheme consists of three consecutive image processing stages namely, 1) segmentation of the intracranial region, 2) image registration and subtraction, 3) tumor segmentation and refinement. The details of each stage are presented as following. 2.1 Intracranial segmentation Segmentation of the intracranial region was accomplished by using a fuzzy c-means (FCM) clustering algorithm on T2-weighted brain MRI images. A similar segmentation approach has been previously reported [15]. However, we developed a specific algorithm with following steps. We first converted each grayscale MR image to a binary (blackand-white) by assigning each pixel to one of three groups using FCM clustering. Pixels in the lowest cluster were set to one (“on”) while all other pixels were set to zero (“off”). Next, we performed a series of morphological closing operations on the binary images using an 18-pixel disk structural element and 25-pixel line structural elements at 20 and -20 degrees from the horizontal. We then removed regions smaller than 2,000 pixels in area. Complementing the image, we produced a rough intracranial mask. We refined the mask by performing another morphological closing operation with a 10-pixel disk structural element and filling “off” regions that were surrounded by “on” pixels. Last, we used this mask to segment the intracranial regions of the corresponding T1-weighted brain image. 2.2 Registration and subtraction After the intracranial region of each image was segmented for all images in two sets of MRI scans conducted pre- and post-contrast injection, the scheme performs the next step to register contrast-enhanced T1-weighted images with non-enhanced T1-weighted images using an automatically generated optimizer and metric. We generated a new set of subtraction images by subtracting the non-enhanced images from the enhanced images. 2.3 Tumor segmentation and refinement In order to finally detect and segment the residual tumor from the subtraction images, we converted the subtraction images to a binary (black-and-white) maps again using a simple threshold segmentation. We then removed regions less than 30 pixels from the image boundary. We also eliminated the long, vertical regions sometimes enhanced in the middle of the brain by turning off regions whose width was less than 10% of the height. Lastly, we performed a morphological closing operation and removed regions smaller than 20 pixels in area to isolate the tumor.
Proc. of SPIE Vol. 10134 101342I-2 Downloaded From: https://www.spiedigitallibrary.org/conference-proceedings-of-spie on 8/21/2017 Terms of Use: https://spiedigitallibrary.spie.org/ss/TermsOfUse.aspx
2.4. Implemeentation of user interface Sincce this is an intteractive CAD scheme, after completing thhe automated im maging segmenntation and proocessing, the user can visually v examiine tumor segm mentation resullts and make coorrections if faalse-positive orr false-negativee regions are detected. All manual co orrections, e.g.., the exclusionn of false-posittive regions froom the calculaation of tumor volume, can be easilyy performed ussing the speciaally designed and a implemennted graphical user u interface (GUI) platform m of the ICAD schem me. These regio ons can be remooved by clickinng inside the area. The user can c also adjust the threshold of o tumor segmentationn by manipulatting the sensittivity slider onn the GUI. Aftter the user is satisfied with the segmentaation, the scheme re-coomputes the su um of the areaas and multipliies by the slice thickness to yield tumor volume. v The coomputed residual tumoor volume is finally f displayeed in the compputation result window of thhe GUI and savved in the backkup data file.
3. RESULTS Currrently, we have applied this new n CAD scheeme to 5 retrosspectively collected cases wiith two sets of pre- and post-contrastt injection brain n MRI imagess attained post--surgery. We have h tested the performance and a robustnesss of both the automateed image proceessing part and the interactivee correction paart of the schem me. Specificallyy, we repeateddly tested the scheme by b using diffeerent interactivve operations (e.g., ( randomlyy placing segm mentation or correction c seedds in the targeted regioons). Figures 1-3 1 show and explain e exampples of how to operate the schheme and its inntermediate prrocessing results. From m the repeateed testing of our o scheme using u these 5 cases and ouur visual exam minations on the t final segmentationn and quantificcation results, we found thatt in each case, our scheme enabled to succcessfully segm ment the intracranial region, r registerr and subtract the enhanced and a non-enhannced image, annd determine, quantify q the voolume of residual tumoor remaining after a the surgerry. Enhanced areas a that were present beforee the administrration of contraast agent were automaatically excludeed from the callculation of tum mor volume. The T interactive functions are easy e to use andd robust. Regions deem med to be falsee-positive weree removed by clicking c inside each region. Threshold T of tuumor segmentaation was easily adjusteed using the GU UI slider.
Figurre 1 Fuzzy c-meeans clustering of o T2-weighted MRI M scan. Imagees are A) originaal T2-weighted im mage and B) thee clusteredd image. Pixels belonging b to the low, middle, andd high clusters are a displayed in black, b gray, and white, respectivvely.
Proc. of SPIE Vol. 10134 101342I-3 Downloaded From: https://www.spiedigitallibrary.org/conference-proceedings-of-spie on 8/21/2017 Terms of Use: https://spiedigitallibrary.spie.org/ss/TermsOfUse.aspx
Figure 2 Segmentation of o the intracraniaal region. Imagess are A) originall T2-weighted MRI M scan, B) binnary image generrated M clustering and d threshold segm mentation, C) aft fter morphologiccal operations, annd D) mask appplied to T1-weigghted after FCM image.
n of tumor after image i registratioon and subtractioon. Images are A) A grayscale imaage generated froom Figure 3 Segmentation registraation and subtracction of pre- andd post-contrast im mages, B) binaryy image generateed from thresholld segmentation of subttraction image, C) C after removall of regions closee to perimeter annd long, vertical regions in centeer, and D) final segmentationn after noise elim mination.
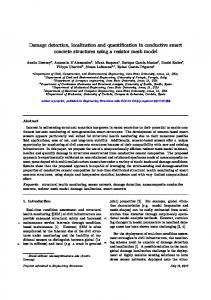
Figuure 4 illustratess a complete picture p of the GUI G platform of o our ICAD sccheme. After suuccessfully devveloping and testing this t new ICAD D-based imagee processing and a quantitative residual tum mor volume deetection schem me in our biomedical im maging processsing laboratorry, this CAD tool is ready too be used for clinical c studiess. Hence, baseed on the IRB-approveed study protoccol, we have been b recently collecting c moree clinical imagge data of brainn cancer patiennts. As a result, the new and more diiverse clinical testing t data will be generatedd and further annalyzed.
Proc. of SPIE Vol. 10134 101342I-4 Downloaded From: https://www.spiedigitallibrary.org/conference-proceedings-of-spie on 8/21/2017 Terms of Use: https://spiedigitallibrary.spie.org/ss/TermsOfUse.aspx
r,ol nay,i:
Study date 05/12/2011
oescncegn - MR BRAIN W WO INF
segreanvn
segua -
Il
I- I- .1
SensilMry
Tumor volume (cubic cm) 3 98
SS
I
Figure 4 Graphical user interface displaaying post-surgeery tumor volum me. Subtraction image i is shownn on right. Enhannced area outside the red bou undary is excludded from volumeetric calculationns. User has options for adjustinng the sensitivitty of tumor seggmentation and removing r false-ppositive regions.
4.
D DISCUSSION N
Quaantitative imagee analysis can play an importtant role in estaablishing preciision medicinee and optimallyy treating individual caancer patients [16]. For this purpose, a largge number of computer-aideed quantitative image processing and feature analyysis schemes have h recently been b developedd and tested. In I order to efffectively treat brain tumors, accurate assessment of o residual tum mor tissues afteer surgery is crritically importtant for prediccting patient ouutcome and opptimizing adjuvant therrapy [17]. How wever, lack of a reliable quanntitative assessm ment tool remaains a major huurdle in currentt clinical practice. To address this cllinical issue or challenge, in this t study we have h presentedd a new interacctive CAD schheme and method to detect d and quaantify post-surggery residual brain tumor volume. v By im mplementing image i registrattion and subtraction, our o scheme disstinguishes betw ween residual tumor t and otheer enhanced noon-tumor regions, which havee already enhanced priior to the admiinistration of contrast agent, and thus moree efficiently and accurately seegments and quuantifies residual tumoor volume. In summary, s in th his technologyy development study, we havve demonstratted the feasibillity of developping and applying an interactive CA AD scheme too detect and quantify q residuual tumor voluume followingg brain tumor surgery. Applying thiis CAD schem me enables the provision of an a objective meetric that can be b used to makke important decisions d about post-suurgery treatmen nt and/or proggnosis of the brrain cancer pattients. To furthher establish thhe clinical utility of the scheme, we will w apply our scheme to a laarger image datta set and furthher test its perfformance and robustness. r Ouur goal is to establish a high correlaation between the computed residual tumoor volumes byy our ICAD sccheme and thee clinical outcomes of patients.
5. ACKNOWLEDGM MENT This woork is supporteed in part by OCNS-OUBC O Seed Grant 20016 from Univversity of Oklaahoma Health Science Center, Oklahhoma City, and d University off Oklahoma, Norman, N Oklahooma, USA.
Proc. of SPIE Vol. 10134 101342I-5 Downloaded From: https://www.spiedigitallibrary.org/conference-proceedings-of-spie on 8/21/2017 Terms of Use: https://spiedigitallibrary.spie.org/ss/TermsOfUse.aspx
REFERENCES [1] American Cancer Society, “What are the key statistics about brain and spinal cord tumors?” [2] [3] [4] [5] [6] [7] [8] [9] [10] [11] [12] [13] [14] [15] [16] [17]
http://www.cancer.org/cancer/braincnstumorsinadults/detailedguide/brain-and-spinal-cord-tumors-in-adults-keystatistics, (2016). American Cancer Society, “What are the key statistics about brain and spinal cord tumors in children?” http://www.cancer.org/cancer/braincnstumorsinchildren/detailedguide/brain-and-spinal-cord-tumors-in-childrenkey-statistics, (2016). E. A. Eisenhauer, P. Therasse, J. Bogaerts, et al, “New response evaluation criteria in solid tumors: Revised RECIST guideline (version 1.1),” European Journal of Cancer 45, 228-247 (2009). M. F. Dempsey, B. R. Condon, and D. M. Hadley, “Measurement of tumor ‘size’ in recurrent malignant glioma: 1D, 2D, or 3D?” Am J Neuroradiol, 26, 770-776 (2005). B. N. Joe, M. B. Fukui, C. C. Meltzer et al., “Brain tumor volume measurement: comparison of manual and semiautomated methods,” Radiology, 212(3), 811-816 (1999). V. Kumar, Y. Gu, S. Basu, et al, “Radiomics: the process and the challenges,” Magnetic Resonance Imaging, 30, 1234-1248 (2012). H. Aerts, et al, “Decoding tumor phenotype by noninvasive imaging using a quantitative radiomics approach,” Nature Communication, 5, 4006 (2014). F. Aghaei, M. Tan, A.B. Hollingsworth, B. Zheng, “Applying a new quantitative global breast MRI feature analysis scheme to assess tumor response to chemotherapy,” Journal of Magnetic Resonance Imaging, 44, 10991106 (2016). Y. Wang, Y. Qiu, T. Thai, et al., “Applying a computer-aided scheme to detect a new radiographic image marker for prediction of chemotherapy outcome,” BMC Medical Imaging, 16, 52 (2016). D. Kunio, “Computer-aided diagnosis in medical imaging: historical review, current status and future potential” Comput Med Imaging Graph, 31, 198-211 (2007). L. A. Khoo, P. Taylor, and R. M. Given-Wilson, “Computer-aided detection in the United Kingdom National Breast Screening Programme: prospective study” Radiology, 237(2), 444-449 (2005). B. Zheng, G. Abrams, C.A. Britton, et al., "Evaluation of an interactive computer-aided diagnosis system for mammography: A pilot study," Proc. of SPIE, 6515, 65151M (2007). M. Samulski, R. Hupse, C. Boetes, et al., “Using computer-aided detection in mammography as a decision support,” European Radiology 20, 2323-2330 (2010). X. Wang, L. Li, W. Liu, et al., “An interactive system for computer-aided diagnosis of breast masses,” Journal of Digital Imaging 25, 570-579 (2012). A. Elazab, et al., “Robust kernelized local information fuzzy C-mean clustering for brain magnetic resonance image segmentation,” Journal of X-ray Science and Technology, 24, 489-507 (2016). F.S. Collins, H. Varmus, “A new initiative on precision medicine,” The New England Journal of Medicine, 372, 793-795 (2015). J. Li, X. Tang, B. Wang, et al., “Comparison between dual arc VMAT and 7F-IMRT in protection of hippocampus for patients during whole brain radiotherapy,” Journal of X-ray Science and Technology, 24, 457-466 (2016).
Proc. of SPIE Vol. 10134 101342I-6 Downloaded From: https://www.spiedigitallibrary.org/conference-proceedings-of-spie on 8/21/2017 Terms of Use: https://spiedigitallibrary.spie.org/ss/TermsOfUse.aspx