(COO), and scientific founders, Professors Carlos Cordon-. Cardo, Jose Costa, and Robert Singer, for their continuous support of this research. REFERENCES.
AUTOMATED LOCALIZATION AND QUANTIFICATION OF PROTEIN MULTIPLEXES VIA MULTISPECTRAL FLUORESCENCE IMAGING Mikhail Teverovskiy1, Yevgen Vengrenyuk1, Ali Tabesh1, Marina Sapir1, Stephen Fogarasi1, Ho-Yuen Pang1, Faisal M. Khan1, Stefan Hamann1, Paola Capodieci1, Mark Clayton1, Robert Kim1, Gerardo Fernandez1, Ricardo Mesa-Tejada1,2, and Michael J. Donovan1 1
2
Aureon Laboratories Inc., 28 Wells Ave, Yonkers, NY 10701 USA Pathology Dept., College of Physicians & Surgeons, Columbia University, New York, NY 10032 USA ABSTRACT
We present a new system for automated localization and quantification of the expression of protein biomarkers in immunofluorescence (IF) microscopic images. The system includes a novel method for discriminating the biomarker signal from background, where signal may be the expression of any of the many biomarkers or counterstains used in IF. The method is based on supervised learning and represents the biomarker intensity threshold as a function of image background characteristics. The utility of the proposed system is demonstrated in predicting prostate cancer recurrence in patients undergoing prostatectomy. Specifically, features representing androgen receptor (AR) expression are shown to be statistically significantly associated with poor outcome in univariate analysis. AR features are also shown to be valuable for multivariate recurrence prediction. Index Terms— Fluorescence microscopy, multispectral imaging, immunofluorescence, image thresholding, prostate cancer 1.
INTRODUCTION
Protein biomarkers are widely used in histopathology for cancer diagnosis, prognosis, and therapeutic response prediction. They provide information on the expression levels of proteins in the cells, allowing for the detection of particular cell activities associated with the disease state. One method for protein expression quantitation is IF, where a protein is localized by introducing an antibody labeled with a fluorescent dye into the tissue that binds to the target protein [1]. The stained slide is illuminated under a fluorescence microscope with a light source having a specific wavelength. This excitation light is absorbed by the fluorescent dye causing it to emit light of a longer wavelength. The intensity of the emitted light is a measure of the concentration of the target protein. In multiplexing,
978-1-4244-2003-2/08/$25.00 ©2008 IEEE
300
the tissue is labeled with several antibodies at the same time. The antibodies are labeled with fluorescent dyes having distinct spectral characteristics. Separation of multiple biomarkers is accomplished via multispectral imaging of the tissue followed by spectral unmixing to obtain images that represent the expression of individual antibodies. Conventionally, IF images are interpreted by pathologists based on their perceived intensity levels of the objects of interest (e.g., nuclei) in the tissue. This practice is labor-intensive and suffers from intra- and inter-observer variations. The development of automated systems enables a low-cost, objective alternative to visual scoring of IF images. Quantitation of a biomarker is achieved in two stages. First, a compartment relevant to the biomarker is detected. Then, the signal is separated from the background within the compartment. These tasks are often accomplished via intensity thresholding. Interactive thresholds [2]-[4] are often followed by computer measurements to quantify biomarker expression. Gordon et al. [3] identified proteins in single-cell images as sets of contiguous pixels above a threshold three standard deviations from the background. Mode of the image histogram together with interactive thresholding is used for identifying background pixels in the AQUA system [4]. Rao et al. [5] utilize manual epithelial nuclei delineation to mark the compartment of interest for quantitation. Limited reproducibility of interactive methods and poor performance of histogram thresholding on images with low signal-to-background ratios are the primary disadvantages of the existing techniques. We propose a system for biomarker localization and quantification addressing the above limitations. The system is fully automated and therefore reproducible. The system’s ability to quantify a biomarker signal within its relevant subcellular compartment makes the system robust against low signal-to background ratios. The system is based on a novel method for discrimination of the biomarker signal from background. Supervised learning is used to model the intensity threshold
ISBI 2008
for signal discrimination as a function of image background characteristics. The utility of the proposed system is demonstrated on prostate cancer prognosis. 2.
IF MULTIPLEX IMAGE ANALYSIS
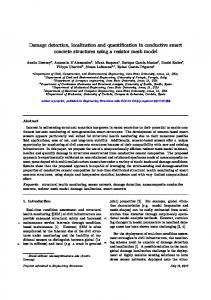
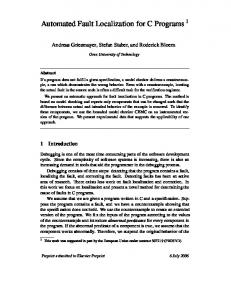
We describe our proposed system for a representative IF multiplex assay designed at Aureon Laboratories. This assay consists of the nuclear counterstain 4'-6-diamidino-2phenylindole (DAPI) [Fig. 1(a)] along with cytokeratin 18 (CK18) [Fig. 1(b)], Į-methylacyl-CoA-racemase (AMACR) [Fig. 1(c)] and androgen receptor (AR) [Fig. 1(d)]. 2.1. Image analysis platform The quantification system is designed using the Definiens Enterprise Image Intelligence Suite™ [6]. Image segmentation into valid biological objects (e.g., nuclei) is a multistage process based on object-oriented image segmentation. In this paradigm, objects rather than pixels are the smallest units on which image processing operations and feature calculations are performed. For example, when an intensity threshold is applied to an image, object intensities are subjected to the threshold. The intensity of an object is the average intensity of all pixels belonging to that object. Two algorithms are utilized to obtain the primitives [6]. The multiresolution segmentation method finds primitives based on color similarity between pixels and object shape regularity. The quadtree segmentation algorithm uses color similarity only. A scale parameter controls the size of the objects in both methods. 2.2. Biomarker localization and quantification In the developed approach, the first step is spatial colocalization of the biomarker within the corresponding subcellular compartment. For instance, epithelial nuclei and cytoplasm are subcellular compartments for AR and AMACR, respectively. The next step is to discriminate true biomarker signal from background in the corresponding compartment primitives. Background consists of autofluorescence and non-specific binding of the fluorescent dye to the tissue. Objects of the subcellular compartment are classified as positive with respect to the biomarker if they contain a certain amount of the true signal. Biomarker quantification is the final step of analysis where we measure properties (e.g., area) of the classified objects. 2.2.1. Biomarker threshold model The next stage of IF image analysis is the discrimination of the true biomarker signal from background using an intensity threshold. We consider the threshold T as a function of biomarker background characteristics. In order
301
to find this function the objects B are split into two nonoverlapping classes: colocalized in a compartment Bc and objects Bb outside of the compartment. The objects Bb are considered as the background which are described by the following features: mean P b , standard deviation V b , and D -th percentiles qb ,D of the object intensities, where D 5, 10,..., 95 . Assuming a linear relationship between the threshold T and the background characteristics, we have T
ȕT X ,
(1)
where ȕ [ E 0 , E 1 , � , E p ] are model parameters, and X [1, X 1 ,..., X p ]T are background features. Note that in (1), T is changes according to the properties of each image. Multivariate linear regression is used to determine ȕ . A set of images is selected for training the model. For each image: a) objects Bc and Bb are identified; b) background features are extracted; and c) expert intensity threshold Texp is determined by a pathologist. The training set is used to train the model to predict the expert thresholds. To avoid model overfitting, redundant and statistically insignificant features are excluded from training. One of two features is redundant if their pairwise correlation coefficient r satisfies r t 0.85 . The feature having the stronger univariate correlation with expert thresholds is used for multivariate regression. Confidence intervals for the regression coefficients are calculated and coefficients whose confidence intervals contain zero are considered statistically insignificant and are eliminated. Parameters ȕ are computed with the remaining features. T
2.2.2. Subcellular compartments for colocalization Basic subcellular tissue compartments contain true signal originating from the target AR and AMACR antigens. Epithelial nuclei and cytoplasm constitute the basic compartments mentioned above. These are segmented positive objects from the DAPI and CK18 images, respectively. The next step is to split the nuclei objects into epithelial and stroma cells by overlaying them with the cytoplasm. It is important in cancer recurrence prediction to distinguish epithelial nuclei located in the invasive cancer areas. The latter are recognized as cytoplasm areas containing AMACR expression. Those epithelial nuclei are called AMACR+, as contrary to AMACR- ones. The initial primitive objects are obtained through the color quadtree segmentation of the CK18 and AMACR images. These objects are re-segmented into coarser objects using multiresolution segmentation. Then threshold (2) (see Table 1) is applied to identify the initial cytoplasm or CK18+ objects. Note that the intensity standard deviation V b in (2) is computed over all initial CK18 objects. Once the initial CK18+ objects are identified, neighborhood analysis is used to refine the class labels. Small background objects whose border length with cytoplasm relative to their
total border length is 0.6 or more are reclassified as cytoplasm. Small isolated cytoplasm objects are labeled as background. The primitive objects are overlaid with the DAPI image. Threshold (3) is used to classify primitives in DAPI+ and background objects. This classification is further refined by a neighborhood analysis similar to that described above. The DAPI+ objects are small fragments of real nuclei depicted in the DAPI image. DAPI+ primitives are merged into nuclei using an iterative algorithm consisting of region growing and object classification. Finally, nuclei objects are classified into epithelial and stroma nuclei based on their colocalization with CK18+ objects. 2.2.3. Positive and negative biomarker expressions AMACR+ cytoplasm areas are found in two steps: a) overlaying the primitive objects on the AMACR image with the CK18+ areas; b) applying threshold (5) to the colocalized objects. Cytoplasm objects whose intensity exceeds (5) are classified as AMACR+. Epithelial nuclei are additionally labeled as AMACR+ and AMACR- depending on their association with positive and negative cytoplasm, respectively. Epithelial cells are the basic subcellular compartments for AR expression. Model (4) is applied to AR objects colocalized in the epithelial nuclei. An epithelial nucleus is classified as AR positive (AR+), if the area of its AR+ objects is more than 0.1% of its total area. Otherwise, it is classified as AR negative (AR-). 2.2.4. Biomarker quantification Once biomarkers are colocalized and classified, quantitative features representing object-based intensity and area characteristics are generated from the colocalized biomarkers. Representative intensity features include mean and total AR intensity within AMACR positive/negative epithelial cells recognized in an image. Representative area features include the area of AR+ epithelial cells relative to the area of all epithelial cells and fraction of the AMACR+ epithelial cells among all AR+ cells. Table 1. Threshold models for the multiplex biomarkers. Biomarker
Model
Eq.
CK18
T
0.55 V b � 220
(2)
DAPI
T
0.86 V b � 1.1 q b ,5 � 32.0
(3)
AR
T
5.1 q b ,5 � 0.39 q b,95 � 1100
(4)
AMACR
T
2.1 P b � 0.82 q b , 25 � 1800
(5)
3.
RESULTS
We demonstrate the utility of the proposed system for IF
302
image analysis in predicting prostate cancer recurrence for patients who had undergone prostatectomy at the Memorial Sloan-Kettering Cancer Center. Two types of adverse outcome were considered for prediction. One outcome was prostate-specific antigen (PSA) recurrence (PSAR) corresponding to a significant rise in the patient’s serum PSA levels. The other outcome was clinical failure (CF) corresponding to significant disease progression as measured by criteria such as distant metastasis. Tissue microarray cores with at least 80% of their tissue area covered with tumor were obtained for 682 and 758 patients in the PSAR and CF prediction tasks, respectively. The cores were labeled with the DAPI counterstain, and the CK18, AR, and AMACR biomarkers, and were imaged using the CRI Nuance™ multispectral imaging system [7]. For each core, a single 12-bit 1280u1024-pixel grayscale image was acquired at the emission peak wavelength of the DAPI counterstain. For each of the CK18, AR, and AMACR biomarkers, an image stack was acquired for a range of wavelengths encompassing the emission spectrum of the corresponding fluorescent dye. The resulting image stacks were unmixed using the Nuance™ system to obtain three images, each corresponding to one of the biomarkers. On a set of 60 multiplex images from the training set, expert thresholds for the DAPI counterstain, and the CK18, AR and AMACR biomarkers were selected by a certified pathologist and threshold models were trained as described in Section 2 (Table 1). The models were validated by visual examination of the images with the largest discrepancies between their expert and predicted thresholds. The AR and AMACR biomarkers were quantitated on the images and features representing the area of AR+ epithelial nuclei relative to the total area of epithelial nuclei as well as the intensity of AR+ epithelial nuclei were obtained. Similar features were also computed for AR+ AMACR+ and AR+ AMACR- epithelial nuclei. The available patients were grouped into training and validation sets of 342 and 340 patients for PSAR prediction and 373 and 385 patients for CF prediction. In PSAR prediction, the relative area of AR+ epithelial nuclei showed the highest (among all AR features) univariate concordance index (CI) of 0.37 (p-value < 0.001) on the training set. In CF prediction, the intensity of AR+ AMACR+ epithelial nuclei achieved the highest univariate CI of 0.30 (p-value < 0.001). We also trained multivariate models for the two prediction tasks in the context of the systems pathology paradigm. In this paradigm, disparate information from patient’s clinical (e.g., age), histological (via image features extracted from hematoxylin and eosin-stained tissue specimens [8]), and molecular (via features measuring the expression of protein biomarkers) profiles are combined in a supervised learning framework to predict cancer recurrence. The resulting PSAR model [9] achieved a training CI of
0.84 (sensitivity = 84%, specificity = 74%) and validation CI of 0.77 (sensitivity = 77%, specificity = 72%), where sensitivity was measured with respect to PSAR within five years of prostatectomy. The model included the relative area of AR+ epithelial nuclei. The CF model [10] achieved a training CI of 0.92 (sensitivity = 90%, specificity = 91%) and validation CI of 0.84 (sensitivity = 84%, specificity = 85%) and included the intensity of AR+ AMACR- epithelial nuclei. 4.
CONCLUSIONS
We described a system for the automated localization and quantification of any protein biomarker’s expression in IF multiplexed microscopic images. A major component of the system is a novel method for discriminating true biomarker signal from background. This is accomplished via approaching biomarker image thresholding as a supervised learning problem, modeling the threshold as a function of image background characteristics. In the present communication, we demonstrate the application of this system to the IF multiplex component of Aureon Laboratories’ prostate cancer prognostic assay. Features representing the area and intensity of AR expression were shown to have significant univariate correlation. In addition, the novel, reproducible and robust features were selected as informative in competition with other predictive factors in a multivariate environment, thereby validating the system’s utility in practical applications.
[5] J. Y. Rao, D. Seligson, and G. P. Hemstreet, “Protein expression analysis using quantitative fluorescence image analysis on tissue microarray slides,” BioTechniques, vol. 32, pp. 924-932, 2002. [6] Definiens Understanding Images, Developer Version 6, 2007. http://www.definiens.com. [7] http://www.cri-inc.com. [8] A. Tabesh, M. Teverovskiy, H.-Y Pang, V. P. Kumar, D. Verbel, A. Kotsianti, and O. Saidi, “Multifeature prostate cancer diagnosis and Gleason grading of histological images,” IEEE Trans. Medical Imag., vol. 26, pp. 1366-1378, 2007. [9] C. Cordon-Cardo, A. Kotsianti, D.A. Verbel, M. Teverovskiy, P. Capodieci, S. Hamann, Y. Jeffers, M. Clayton, F. Elkhettabi, F. M. Khan, M. Sapir, V. Bayer-Zubek, Y. Vengrenyuk, S. Fogarsi, O. Saidi, V. E. Reuter, H. I. Scher, M. W. Kattan, F. J. Bianco, Jr., T. M. Wheeler, G. E. Ayala, P. T. Scardino, and M. J. Donovan, “Improved prediction of prostate cancer recurrence through systems pathology,” J. Clinical Invest., vol. 117, pp. 1876-1883, 2007. [10] M. J. Donovan, S. Hamann, M. Clayton, F. Khan, M. Sapir, V. Bayer-Zubek, G. Fernandez, R. Mesa-Tejada, M. Teverovskiy, V. Reuter, P. Scardino, and C. Cordon-Cardo. “A systems pathology approach for the prediction of prostate cancer progression after radical prostatectomy,” accepted, Journal of Clinical Oncol., 2008.
ACKNOWLEDGMENT We would like to express our gratitude to Aureon Laboratories’ Dr. Vijay Aggarwal (CEO), Robert J. Shovlin (COO), and scientific founders, Professors Carlos CordonCardo, Jose Costa, and Robert Singer, for their continuous support of this research.
(a)
(b)
(c)
(d)
REFERENCES [1] C. Vonesch, F. Aquet, J.L. Vonesch and M. Unser, “The colored revolution of bioimaging,” IEEE Signal Proc. Mag., vol. 23, no. 3, pp. 20-31, May 2006. [2] A. Krtolica, C. O. de Solorzano, S. Lockett and J. Campisi, “Quantification of epithelial cells in coculture with fibroblast by fluorescence image analysis,” Cytometry, vol. 49, pp. 7382, 2002. [3] A. Gordon, A. Colman-Lerner, T. E. Chin, K. R. Benjamin, R. C. Yu, and R. Brent, “Single-cell quantification of molecules and rates using open-source microscope-based cytometry,” Nature Methods, vol. 4, pp. 175-181, 2007. [4] R. Camp, G. G. Chung, and D. L. Rimm, “Automated subcellular localization and quantification of protein expression in tissue microarrays,” Nature Medicine, vol. 8, pp. 1323-1327, 2002.
303
Fig. 1. IF multiplex pseudo-color image. (a) DAPI (blue) and CK18 (green) in pseudo-colors; (b) segmented epithelial (blue) and stroma (pink) nuclei, CK18+ (green); (c) CK18+ AMACR+ (red), CK18+ AMACR- (cyan) objects superimposed on the AMACR image; and (d) AR+ (red) and AR- (cyan) epithelial nuclei objects superimposed on the AR image.