static analysis, and it does not need profiles of the application with correct configuration. Based on the proposed techniques, we developed a tool called.
Automated Diagnosis of Software Misconfigurations Based on Static Analysis Zhen Dong, Mohammadreza Ghanavati, Artur Andrzejak Institute of Computer Science Heidelberg University, Germany {zhen.dong, mohammadreza.ghanavati, artur.andrzejak}@informatik.uni-heidelberg.de
Abstract—Software configuration settings are an effective way to customize applications. However, inconsistencies or mistakes in option values can result in a system crash and need huge time and effort to diagnose. We present a technique to identify the root causes of configuration errors. It uses static program analysis to link the misconfiguration of an application to a specific configuration option. Our technique has two prominent characteristics compared to existing approaches: it relies only on static analysis, and it does not need profiles of the application with correct configuration. Based on the proposed techniques, we developed a tool called ConfDebugger. We evaluated its effectiveness on 8 configuration errors in the Java program JChord. ConfDebugger successfully diagnosed 7 out of 8 errors. For 5 of them, root cause was exactly pinpointed without a false positive, and in total, the average number of false positives was only 0.5. This is better than two state-of-the-art methods, with average numbers of false positives of 1.7 and 5.7, respectively. Index Terms—Configuration debugging, static program analysis, thin slicing, failure-inducing chop
I. I NTRODUCTION Configuration settings provide a proven and effective way to customize applications for different user requirements. Growing functionality and size of today’s software leads to a larger number of configuration options, and more complex dependency patterns between them. This in turn increases the likelihood of introducing a misconfiguration which can lead to “hard” crashing errors or (possibly gradual) performance problems. Debugging of such errors is an expensive and tedious work, as they frequently manifest in a deployment scenario. For example, a misconfiguration in the user authentication system caused a breakdown of some essential Google services (e.g., Gmail and Drive) for two hours in April 2013, see [2]. A misconfiguration can assume many forms, including mistaken parameter values, inconsistencies between option values, and illegal parameters. According to Yin et al. [12], mistaken parameter values account for 70-85% of all misconfigurations (investigation on data on five significant applications), and 4050% of them result from invalid values. A significant portion of configuration errors can lead to a system crash. We focus in this work on this type of defects. Most execution environments save a stack trace once a crashing failure has occurred. Our basic idea is to analyze dependencies between each configuration option and the stack trace to diagnose misconfigurations. If one of the code locations referred by the stack trace has a direct data or control
dependency to a configuration option, the latter is quite likely to be the root cause of the failure. Our approach uses a static analysis technique to identify program statements affected by each configuration option. Let A be as set of such statements (for a specific configuration option). When a user encounters one configuration error, she first needs to extract statement locations from the stack trace. Our approach subsequently identifies statements affecting the stack trace, and records them in a set B. If there is an intersection between sets A and B, the corresponding configuration options are listed in a set of suspects. Since static analysis involves all possible execution paths, too many configuration options will be treated as suspicions. To address this problem, we adopt filtering technique to narrow down the range of the root causes of a configuration error. After this filtering, we report the set of suspicious configuration options to the user. Our approach has several advantages compared to the previous solutions to this problem [1], [5], [9], [11], [15]. Firstly, it only needs the configuration options, the stack trace of the failure, and the bytecode of Java program. User does not need to provide any additional information. This is more efficient compared to delta debugging [13], information flow analysis [1] and dynamic slicing [16]. Secondly, differently to the recent approaches [5] and [15] which combine static and dynamic analysis, our approach only uses static analysis. Finally, it does not require any profiles of the application executed with correct configuration like the method in [15]. In summary, this paper makes the following contributions. • Technique. We propose a new lightweight approach to locate the root causes of configuration errors.It is able to diagnose the misconfiguration using only static analysis of code (Section II). • Implementation. We implement the proposed technique and develop a tool called ConfDebugger (Section III). • Evaluation. We evaluate our approach on 8 configuration errors in Java program JChord [4]. The results in Section IV show that it features high precisionin detecting of the root cause of a misconfiguration (Section IV). The rest of the paper is organized as follows. The approach is described in Section II and its implementation in Section III. The results of the experiments are discussed in Section IV. Related work is presented in Section V and conclusions in Section VI.
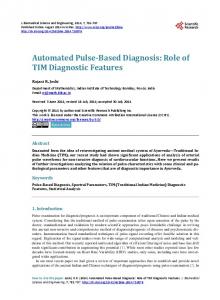
Program Configuration options
Forward Slices Propagation Analysis
Filtering Diagnosis Analysis
Intersection Failure manifestation site
Stack trace Analysis
Error report
Filtering Backward Slices
Figure 1.
Workflow of our diagnosis technique
II. D ESCRIPTION OF THE A PPROACH This section describes in detail the proposed approach for diagnosing configuration errors, starting with some definitions. A software configuration is comprised of a set of configuration options (also called configuration parameters). Each option is a read-only constant variable which modifies certain aspects of program behavior. A typical way to specify the option values is a key-value style configuration. Here the keys are strings, each naming the configuration parameter. The corresponding value (commonly, also a string) specifies the value of this parameter. For example, in the Chord/JChord framework for Java bytecode analysis (Section IV-A), a file named chord.properties holds all configuration settings (in a so-called Java Properties format). Each line in this file corresponds to one configuration option. For Chord, one of them specifies the main class of the program to be analysed as chord.main.class=foo.Main. Here chord.main.class is the key (option name) and foo.Main is its value. This key-value configuration schema is supported by the POSIX system environment, Java Properties and Windows Registry, and used in a range of open source projects. It is also assumed in many related works on configuration debugging, see e.g. [5]. A. Overview An overview of our technique is given in Algorithm 1 and additionally illustrated in Figure 1. It uses as input a source code and bytecode of a Java program, its particular set of configuration options and a failure stack trace. Firstly, the affected statements of the program are identified by each configuration option by performing a propagation analysis (Section II-B). We call these sets of statements the forward sets. Our technique conducts then failure stack trace analysis to identify the program statements which affect stack trace directly (Section II-C). We call such sets of statements the
Algorithm 1 Steps of the proposed approach Step 1: Compute Forward slices for each of n configuration options: F Slicei F Slice
= ForwardSlice (app, confi ), i ∈ {1, ..., n}, n X = F Slicei i=1
Step 2: Extract Error Set Eset from the stack trace Step 3: Compute backward slices for each element e of Eset : BSlicej BSlice
= BackwardSlice (app, e), j ∈ {1, ..., m} m X BSlicei = i=1
Step 4: Filter F Slice and BSlice using breadth-first search distance algorithm Step 5: Compute the intersection of forward and backward slices: IS
= F Slice ∩ BSlice
Step 6: Get list of suspects by analyzing the intersection IS
backward sets. After filtering the unnecessary statements from forward and backward sets (Section II-D), we compute the intersection of both sets (Section II-E). Finally, we identify the root cause of the misconfiguration based on the statements in the intersection and then report a list of suspicious configuration options to users (Section II-F). B. Configuration Propagation Analysis The basic technique for analyzing propagation of configuration option values is program slicing [10]. For a given statement s of a program (a seed statement), the forward slice of s is a subset of the program statements whose execution may be affected by statement s. Parts of source code whose execution is potentially affected by a configuration option can be identified by using the
forward slices. To this end we first need to identify the entry point of a configuration option value, i.e. a part of source code which reads in a particular option value during the execution. This entry point is used as a seed statement for computing a forward slice. To identify the entry point of a configuration option, a simple way is searching the statements which read the value of a configuration option by using a call graph of a program. The traditional full slicing [3] systematically identifies parts of the program which can affect or are affected by a specific statement. However, the slices created in this way are usually too large. To address this limitation, we use thin slicing [6]. This technique yields the subset of statements which are directly affected by a configuration option. Essentially, it excludes statements involving base pointers and control flow dependencies. This can significantly decrease the size of the slice. C. Stack Trace Analysis Java applications (as well as many operating systems) commonly produce a stack trace when a crash happens, not just a simple error message. In Java, the stack trace lists a hierarchy of nested methods called up to the point of failure (including the code location of each call). The top line of the stack trace is the point where an exception is raised. However, an option misconfiguration can affect any of the methods listed by the stack trace. Consequently, we analyze all lines of the stack trace to find statements relevant to the failure in the program. Failure stack trace analysis is comprised of the preprocessing of the stack trace and the stack trace analysis by backward slicing. 1) Preprocessing of the stacktrace: In Java programs, developers typically handle exceptions with a dedicated class. This leads to a phenomenon that stack traces from different failures have the same first line. This line corresponds to an exception and does not help to identify root cause of errors. In our approach, we check the first line of the stack trace. If this points to an exception-handling statement, we ignore this line. Similarly, we do not consider the bottom line of the stack trace which is the entry point to the main method of the program. In addition, some of the methods can be called more than once during the execution of an application (see Figure 2). Consequently, if multiple entries of the stack trace point to the same code location, only one of these entries is considered. Note that the preprocessing of the stack trace is not automated in our current prototype and needs to be completed manually. The problem is that it is very difficult to identify the exception-handling statements (among those pointed by the stack trace). Nevertheless, we will attempt to automatize this step as a part of the future work. After preprocessing, we map the remaining stack trace entries to code locations (indicated by pairs (className, lineNumber)). The set of these locations is called the Error Set.
Exception in thread "main" java.lang.NoClassDefFoundError: notexist ... ... at chord.project...runTask(ClassicProject.java:393) at chord.project...runTask(ClassicProject.java:390) at chord.project...runTask(ClassicProject.java:390) at chord.project...runTask(ClassicProject.java:414) at chord.analyses...run(DataraceAnalysis.java:90) at chord.project...runTask(ClassicProject.java:393) at chord.project...runTask(ClassicProject.java:414) ... ...
Figure 2.
A fragment of the stack trace for failure #1 from Table I
2) Stack trace analysis by backward slicing: In this step, we use each of the statements from the Error Set as the seed statement to compute the backward slice. The backward slice is a subset of statements that may affect the value of any variables at the seed statement [14]. Also in this case we use thin slicing [6] instead of traditional full slicing [3]. Contrary to forward slicing, backward slicing not only considers data dependencies but also control dependencies. Using also control dependencies has two advantages. Firstly, stack trace is a sequence of method calls, which itself is a reflection of control flow when a crash occurs. Considering control dependencies can significantly help to trace the root cause of the error. Secondly, statements which are indicated by stack trace are method calls. Many of them do not directly involve data dependencies. If the control dependencies are not considered, the backward slice would only contain the seed statement. D. Filtering Thin slicing dramatically reduces the slice size compared to the traditional full slicing. However, the size of slices in the configuration propagation and the failure stack trace analysis are still large, especially when the control dependencies are considered in the failure stack trace analysis. In face of this fact we further prune slices and remove statements which are less relevant to the seed statement. In thin slicing, statements “closer” to the seed statement are more likely to be relevant to seed’s behavior. Consequently, for a statement s we measure its breadth-first search distance from the seed statement in the dependence graph [6]. Our filtering works then as follows: if this distance exceeds a certain threshold, it is excluded from the slice. E. Failure-inducing Chop The basic idea used in our approach is that a configuration option is more likely to be the root cause of the misconfiguration if there exists an intersection between its forward slice (Section II-B) and the backward slice of the stack trace (Section II-C). We call this intersection as the failure-inducing Chop (FChop). In Step 5 of Algorithm 1 we compute the statements in the intersection FChop of the forward slice and the backward slice.
F. Configuration Diagnosis Analysis
G. Discussion
In this section, we analyze the statements in the FChop to identify the root cause of the error. Three cases are taken into account. Firstly, statements in the FChop only correspond to one configuration option. We call this case a single suspect. Secondly, statements in the FChop correspond to multiple configuration options, called multiple suspects. Lastly, FChop is empty. We call this case as no suspect. In the following we explain each of these three cases in detail. 1) Single Suspect: This situation is the optimal outcome for our technique. The configuration option in the FChop is reported to the user as the root cause of the misconfiguration. 2) Multiple Suspects: If the statements in the FChop link to more than one configuration option, we use filtering to narrow down the range of the suspicious configuration options by adopting the following strategy. In configuration propagation analysis, if the forward slice of a configuration option contains any statement in the Error Set, it means that there exist dependencies between the configuration option and the error. We say in this case that the configuration option can reach the error. On the other hand, if an entry statement of a configuration option is contained in the backward slice of the stack trace, it means that the error can reach the configuration option in the stack trace analysis. If a configuration option and the stack trace can reach each other, this configuration option has a higher probability to be the root cause of the error than other configuration options. We report these configuration options as the root causes of the misconfiguration. 3) No Suspect: For the situation that the FChop is empty, we remedy it by relaxing the conditions of making the failureinducing chop. Firstly, the threshold on breadth-first search distance (II-D) is increased until the FChop is not empty. If the FChop is still empty, we use an approximate failure-inducing chop (AFChop) as follows. During computing intersection of forward and backward slices, if the source line numbers of two statements in the same class file are close to each other, not just exactly equal, we consider the two statements as the same statement and put them into the AFChop. The mathematical description of the AFChop is as follows: Defining C as class name and L as source code line number, statement Sf (Cf , Lf ) is in the forward slice of configuration options and statement Sb (Cb , Lb ) is in the backward slice of the stack trace. Then Sf and Sb belong to the AFChop, if the following three conditions are satisfied:
Why are forward and backward slicing combined? The forward slice of an entry point of an erroneous configuration option should reach the failure stack trace. If this is the case, this configuration option can be assumed to be the root cause of this defect (this idea is used in paper [5]). Similarly, an entry point of an erroneous configuration option which is reached by the backward slice of the failure stack trace should be the root cause of the error. So why does it still make sense to combine both techniques? The answer is that by using both types of slicing we can increase the specificity of our approach. Static analysis involves all possible executable paths (instead of only executed paths as in dynamic analysis). Consequently, entry points of multiple configuration options can reach the failure stack trace in the forward slice analysis. On the other hand, the backward slice of the failure stack trace can also reach the entry points of multiple configuration options. Therefore, we combine both types of slices to narrow down the range of the suspicious configuration options. How can FChop be empty? Due to simplifying assumptions and implementation constraints, the static analysis tool used in this work does not give all the statements affected by a seed statement. Consequently, it can ignore statements which are logically related to the seed statement. This leads to an empty intersection between the forward slice of configuration options and backward slice of the failure stack trace. We will further discuss it in our evaluation (Section IV).
1) Cf = Cb , 2) Lb − Lf ≤ ε, where ε is a predefined threshold 3) Sf and Sb are in the same method. We increase ε until AFChop is not empty. Then, the corresponding configuration options in AFChop will be reported to the user.
III. I MPLEMENTATION We implemented a tool, called ConfDebugger, on top of the WALA [8]. WALA is a static analyzer tool developed by IBM. It analyzes Java bytecode and locates the entry statements based on the list of configuration options. Then it computes the subsets of the statements affected by each configuration option and the statements affecting the failure stack trace. After that, our prototype computes and assigns the breadthfirst search distance to the seed statement for every statement, filters statements, makes the FChop (AFChop), and performs the analysis on the FChop (AFChop). Our prototype does not analyze the standard JDK library and all libraries which subject program depends on. We believe it makes sense, since the configuration settings of an application almost never affect the behaviors of its dependent libraries. To achieve scalability, we do not consider data dependencies involving heap. Considering such dependencies would incur a very significant additional memory overhead by the WALA tool. Currently we cannot exactly say whether using data dependencies involving heap would improve the results or not. However, at least in case of the error #6 (Section II-F2) an improvement is likely. If we would be able to use heap-related dependencies, then he root cause of this error could be possibly determined more easily - using FChop instead of AFChop.
Table I T HE 8 CRASHING CONFIGURATION ERRORS USED IN THE EVALUATION Error ID 1 2 3 4 5 6 7 8
Crashing errors in JChord No main class is specified No main method in the specified class Running a nonexistent analysis Invalid context-sensitive analysis name Printing nonexistent relations Disassembling nonexistent classes Invalid reflection kind Wrong classpath
71 String[] printClasses = Utils.toArray(Config.printClasses); 72 if (printClasses.length > 0) { 73 for (String className : printClasses) 74 program.printClass(className); 75 }
Figure 3.
Table III E XECUTION TIME OF VARIOUS TASKS OF C ONF D EBUGGER ( SECONDS ) Error ID
IV. E VALUATION In this section, we evaluate the effectiveness of our technique by the following aspects: • the precision of the analysis results • the time effort of error diagnosis • comparison with previous configuration error diagnosis techniques. Besides, we evaluate the impact of the filtering (by breadthfirst search distance) on the precision of analysis. A. Experimental Environment and Configuration Errors We have selected JChord (version 2.1) [4] as our application for experimenting. JChord is a program analysis platform that enables users to design, implement, and evaluate static and dynamic program analysis for Java bytecode. JChord is used as a subject program in multiple papers on configuration errors diagnosis. By selecting this application we are able to easily compare analysis results against those stated in the related work. We considered 9 crashing configuration errors which were previously used to evaluate the ConfAnalyzer [5] and the ConfDiagnoser [15] tools. Before diagnosing, we attempted to reproduce all 9 of these crashing errors. However, one of them could not be reproduced because of different versions of JChord. We thus use the remaining 8 errors to evaluate our technique (see Table I). Our experiments were conducted on a dual core 2.00 GHz Intel PC with 4 GB physical memory, running Windows 7. B. Results 1) Precision of diagnosing configuration errors: As shown in Table II, ConfDebugger is highly effective in pinpointing the root cause of software configuration errors. It successfully diagnoses all configuration errors except one. The success ratio is 87.5%. For 5 of them, it exactly gives the root cause without any false positives. Here a false positive is a correct configuration option which is reported as a suspicious one. The remaining 2 errors have 1 false positive each. The average number of false positives was 0.5. For errors #3, #5, #7, there is only one statement in the FChop. It was the entry statement of the configuration option which is responsible for the error. For errors #1, #2, there are 25 statements which correspond to 13 configuration options in the FChop. After analysis (see Section II-F), two configuration options remain in the output list of suspicious configuration
Exception of the JCord related to error #6
1 2 3 4 5 6 7 8
Forward Slicing 21 21 21 21 21 21 21 21
Backward Slicing 35 35 18 21 14 12 13 35
Analysis 2 2