Automated DSS for Lighting Design of Nighttime Operations in Highway Construction Projects by
Khaled El-Rayes1 and Khalied Hyari2 1
Assistant Professor, Department of Civil and Environmental Engineering, University of Illinois at Urbana-Champaign, Urbana, IL 61801 Telephone: (217) 265 0557, Email:
[email protected], http://cee.ce.uiuc.edu/elrayes
2
Graduate Research Assistant, Department of Civil and Environmental Engineering, University of Illinois at Urbana-Champaign, Urbana, IL 61801 Telephone: (217) 265 5215, Email:
[email protected]
ABSTRACT: Nighttime construction lighting is reported to be a crucial factor affecting quality, safety, cost and productivity of nighttime construction projects. This paper presents an automated decision support system (DSS) for lighting design in highway nighttime construction projects. The DSS is designed to optimize four major objectives: (1) maximizing average illuminance; (2) maximizing lighting uniformity in the work zone; (3) minimizing glare produced by the lighting system; and (4) minimizing cost of the lighting system. Seven decision variables are optimized in this lighting design problem namely: (1) lighting equipment selection; (2) type of lamps; (3) lamp lumen output; (4) mounting height; (5) lighting towers positioning; (6) luminaires aiming angle; and (7) lighting towers rotation. A multi objective evolutionary algorithm (NSGA-II) is used to optimize this lighting design problem. The proposed DSS provides a practical tool for the design and optimization of lighting arrangements in nighttime construction operations. KEYWORDS: highway construction; lighting; nighttime construction; optimization.
1. INTRODUCTION An increasing number of highway construction and repair projects throughout the United States are being performed during the off-peak nighttime hours to alleviate construction-related traffic congestions. The use of nighttime operations in highways construction and repair projects is reported to provide many advantages including: (1) reduced impact on the traveling public through reducing congestions and motorist delay; (2) decreased project duration (Hancher and Taylor, 2001); (3) minimized adverse economic impacts of traffic congestion on local commerce particularly for shipping and delivery services; (4) decreased pollution from idling vehicles stopped at construction sites (McCall, 1999); (5) improved work-zone conditions as the smaller amount of traffic at night creates an opportunity to enlarge work zones allowing the concurrent performance of multiple functions; (6) longer working hours at night; (7) enhanced work conditions due to
lower temperatures (Shepard and Cottrell, 1985); (8) faster delivery of material to and from the work zone since traffic conditions are better at night, leading to less idle time for both labor and equipment (Price, 1986); and (9) reduced equipment costs (Hancher and Taylor, 2001). Despite the above advantages, nighttime construction suffers from a number of disadvantages including: (1) decreased visibility for both workers and motorist, causing decreased levels of safety and quality (Shepard and Cottrell, 1985; Hancher and Taylor, 2001); (2) problems in implementing quality control procedures, and decreased quality of workmanship; (3) increased number of drivers with insufficient sleep, vision problems and intoxication during nighttime leading to higher numbers of accidents at work zones; (4) adverse public reactions due to construction noise during nighttime; (5) difficulty in recruiting personnel in spite of the wage premiums that compensate for nighttime work; (6) difficulties in material delivery, utility services and urgent equipment repairs during nighttime hours (Shepard and 1
Cottrell, 1985); and (7) increase in cost for nighttime operations due to labor premiums and overtime, additional traffic control devices, additional artificial lighting arrangements, and higher engineering inspection costs (Hinze and Carlisle, 1990) To overcome many of the above disadvantages, proper and adequate lighting arrangements need to be provided on nighttime construction sites. Lighting was reported to be one of the most important factors affecting quality, safety, cost and productivity of nighttime construction projects (Kumar, 1994). The design of lighting arrangements needs to be performed in a systematic and optimal way to achieve the best use of available lighting equipment. The dynamic nature of nighttime highway construction and maintenance projects in terms of variability of work zone locations and layouts within the same project requires an automated decision support system (DSS) that copes with these dynamic design aspects. This paper presents an automated decision support system for the design of temporary lighting arrangements in nighttime highway construction operations. The system provides support for highway contractors and resident engineers in optimizing lighting design for nighttime construction. It is designed and developed to be (1) effective in providing near optimal solutions to the lighting arrangements; and (2) efficient in generating the required design in a reasonable time and effort due to the temporary nature of such lighting arrangements. 2. PROPOSED DECISION SUPPORT SYSTEM The development of the system is attained through three main stages: 1) determining the design variables and constraints pertinent to the nighttime construction lighting arrangements; 2) identifying the objectives of the lighting design in highway nighttime construction and formulating them in a robust optimization model; and 3) implementing the optimization model using a multiobjective evolutionary algorithm.
2.1 Decision Variables The following decision variables were identified for the lighting design in nighttime construction: •
Lighting equipment selection: The designer needs to choose from available alternatives of (a) ground mounted towers, (b) trailer mounted towers, and/or (c) equipment mounted luminaires.
•
Types of luminaires: The type of lamp needs to be selected from available alternatives of: (a) metal halide lamps; (b) high pressure sodium vapor lamps; (c) halogen lamps and (d) low pressure sodium vapor lamps.
•
Lamp lumen output: It represents the energy emitted from the lamp and influence visual comfort and illuminance (IESNA, 1998).
•
Mounting height: It represents the vertical distance between the center of the luminaires and the pavement surface. Portable lighting towers are typically manufactured with adjustable mounting heights that can reach up to 25m.
•
Lighting towers positioning: This variable represents the location of the lighting towers in the work zone. Lighting positioning affects the average illuminance and the uniformity of lighting in the work zone.
•
Aiming angle of luminaires: It is the angle between the center of the luminaires beam spread and the nadir. This variable determines the directional distribution of lighting and affects the coverage area as well as the glare produced by the luminaires.
•
Lighting tower rotations: This variable represents the rotation of the lighting tower luminaires around a vertical axis, which is needed, as a decision variable when the luminaires light distribution is not symmetrical. A proper rotation angle enables the designer to direct the lighting intensity towards the intended area and to minimize the lighting spillage to unnecessary directions, reducing light trespass that is a common source of complaints in nighttime construction in urban areas.
2
2.2 Lighting Design Objectives
2.3 System Implementation
The design of lighting arrangement in nighttime construction operations should satisfy the following objectives:
The proposed optimization model was implemented using NSGA-II, which is an improved version of NSGA, referred to as the fast elitist nondominated sorted genetic algorithm (Deb et. al., 2000). NSGA-II is a pareto-based approach that handles multiobjective optimization problems through the nondomination concept.
•
Illuminance: The lighting system needs to maximize the average illuminance level in the construction work zone. An objective function was formulated using the point-bypoint method to calculate the average horizontal illuminance in a grid of uniformly distributed points covering the work zone area. The horizontal illuminance at each point of the grid is calculated using the inverse square law (Pritchard, 1995) considering all light sources in the work zone.
•
Uniformity ratio: The uniformity ratio needs to be minimized in order to ensure that light evenly reaches all areas in the work zone. This value is computed by dividing the average horizontal illuminance value over the minimum illuminance computed at any grid point in the work zone.
Many engineering design problems involve multiple objectives. Typically, engineering design problems have at least two objectives: the cost of the designed system that should be minimized, and a certain quality characteristics or utility from the system which should be maximized. While the single objective design formulation finds the best possible design solution that corresponds to the minimum or maximum value of the objective function, there is no single best solution in the multiobjective design. Rather we have a set of trade-off solutions generally known as the pareto optimal solutions or nondominated solutions (Deb et. al., 2000).
•
Glare: Glare needs to be minimized in order to limit the visual impairments and/or discomfort experienced by the traveling public and workers. The veiling luminance ratio is used in road lighting as a control measure of glare (IESNA, 2000). The veiling luminance calculations in this model are formulated by adopting the same standard conditions for observer’s sight direction and angles that are used in roadway lighting design due to the similarity of both cases. The observer’s eye height is taken to be 1.45m, and the observation direction is the drivers’ sight direction, which is parallel to the centerline of the roadway (IESNA, 2000).
Genetic algorithms (GAs) are search and optimization tool inspired by the mechanics of natural selection and genetics. Those algorithms adopt the survival of the fittest, and the structured exchange of genetic materials among population members over successive generations as a basic mechanism for the search process (Goldberg, 1989). Since its development, GAs have been widely used in various disciplines including engineering, science, business, and medicine (Chambers, 2001). The success of GAs in these fields can be attributed to their broad applicability in terms of their ability to handle various types of functions and to find global near optimal solutions in a multimodal search space (Deb, 1999).
•
Lighting cost: The cost of a lighting system can be reduced by minimizing two major cost items: (a) ownership cost of the lighting equipment, which is either the cost to buy, rent, or lease the lighting equipment, and (b) operational cost of the lighting equipment, which is a function of the energy consumption of the lighting equipment.
Several approaches can be used to handle multiobjective optimization problems including: (1) weighted sum method; (2) goal programming approach; (3) constraint method; (4) lexicographic ordering method; (5) game theory approach; (6) gender-based GA; (7) multiple objective GA; and (8) non-dominated sorted GA
3
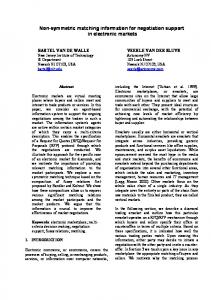
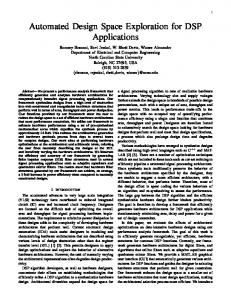
(NSGA, NSGA-II) (Coello, 1999; Deb et al., 2000). The proposed optimization model was implemented using NSGA-II due to its superiority over other multiobjective optimization tools in (1) providing the entire pareto optimal front of nondominated solutions in a single run; and (2) handling any number of objectives (Deb et al., 2000). NSGA-II works by sorting the population members at each generation into sets of nondominated pareto optimal fronts. All points in each of the pareto optimal fronts are given the same fitness value according to their rank and solutions with higher rank have higher probability of being selected for reproduction (Deb et al., 2000). The optimization model was coded using C++ language to enable the evaluation of the formulated objective functions for a given set of decision variables. As shown in Figure 1, four functions were developed to calculate illuminance, uniformity ratio, glare, and cost to enable their evaluation in the optimization model. The photometric characteristics of the lighting tower luminaires (light distribution and lamp lumen output, and the reflectance characteristics of the pavement surface are entered as data files that can be accessed by these functions. Other decision variables such as number and position of lighting equipment, luminaires aiming angle, rotation, and mounting height are randomly generated for the initial population. This initial population evolves over a number of specified generations in order to obtain a number of feasible solutions that are considered to be nondominated. The decision maker can select one solution for implementation from these sets to satisfy the particular design problem at hand. 3. APPLICATION EXAMPLE An application example of lighting design for a work zone with a length of 27 meters, and a width of 10 meters is analyzed to illustrate the use of the proposed system. The design criteria in this example are specified to be: (1) a minimum average illuminance level of 100 lux to provide acceptable visibility for the
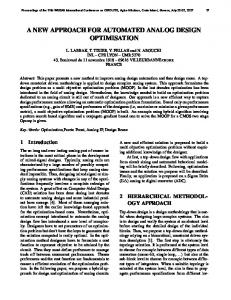
construction activities in the work zone; (2) a maximum average illuminance of 200 lux to avoid light trespass to adjacent properties; (3) a maximum allowed uniformity ratio of 6; and (4) a maximum allowed glare (veiling luminance ratio) of 0.4. Several runs were performed with different genetic algorithm parameters to study their effect on the convergence characteristics of the model. The output of the model in each run was a set of nondominated solutions that satisfy the earlier described four design objectives. The solution space is a four-dimensional one, which makes the pareto optimal front for all functions impossible to view simultaneously. Twodimensional slices from the pareto optimal front are therefore obtained to visualize the trade-offs between the different objectives. These slices present subsets of the nondominated solutions that represent the pareto optimal fronts considering two objective functions at a time. Six fronts are obtained for each run. For example, Figure 2 shows the trade-off between illuminance and glare/veiling luminance ratio objectives. It can be recognized from the nondominated fronts that both objectives are conflicting, and an increase in the fitness of one function will lead to a reduction in the fitness values of the other. The shape of the nondominated fronts in terms of slopes provides insight on the nature of the trade-offs between different objectives. The designer can select a solution that produces low glare while making only a small compromise in illuminance. Almost all fronts obtained from different runs have roughly the same shape, as shown in Figure 3. These fronts however have different properties in terms of their spread, and the values of the objective functions. It was also observed that the population size has a more important role in determining the quality of the obtained front than the number of generations as shown in Figure 3. The results obtained from the run that has a population size of 250 and 50 generations are better than the results obtained from the run that has a population size of 50 and 250 generations because the nondominated
4
fronts in the former case have a better spread over the entire front, and also have better fitness values. From the above analysis, one can see that it is possible to reduce the computational requirements of the lighting model, if the accompanying reduction in the fitness values of the objective functions is acceptable. It seems that the run with population size of 250 and 50 generations gave acceptable results with respect to the best run with a population size of 800 and 234 generations. The number of function evaluations in the former case with a reduced population size and reduced number of generations is less than 7% of the number of function evaluations in the run with a population size of 800 and 234 generations. 4. CONCLUSIONS The results presented in this paper illustrates the capability of the proposed decision support system in: (1) handling multiobjectives in lighting design process simultaneously; (2) providing feasible solutions by satisfying the design criteria; (3) achieving good quality in lighting design rather than accepting the minimum requirements; (4) quantifying glare which is a major source of complaints in highway nighttime construction; (5) incorporating cost as an important objective in the optimization of the lighting design process; and (6) providing an automated and practical tool for the nighttime construction operations personnel to deal with the dynamic lighting design process. 5. REFERENCES 1. Chambers, L. (Editor) (2001) “The Practical Handbook of Genetic Algorithms Applications”. 2001. Chapman and Hall/CRD. Florida. 2. Coello, C. (1999) “A Comprehensive Survey of Evolutionary-Based Multi objective Optimization Techniques”. Laboratorio Nacional de Informatica Avanzada. Veracruz, Mexico. http://www.lania.mx/~ccoello
3. Deb, Kalyanmoy et. al. (2000) “A Fast Elitist Non- dominated sorting genetic algorithm for multi-objective optimization: NSGA-II”. Proceedings of the Parallel Problem Solving from Nature VI Conference, 16-20 September, Paris. 4. Deb, Kalyanmoy. (1999) “Evolutionary Algorithms for Multi-Criterion Optimization in Engineering Design”. Proceedings of Evolutionary Algorithms in Engineering and Computer Science (EUROGEN-99). 5. Goldberg, D. (1989) Genetic Algorithms in Search, Optimization, and Machine Learning. Addison Wesley Longman, Inc. 6. Hancher, D., and Taylor, T. (2001) “NightTime Construction Issues” Paper presented at the Transportation Research Board 80th Annual Meeting, January 7-11. 7. Hinze, J., and Carlisle, D. (1990) “Variables Impacted by Nighttime Construction Projects”, Final Report TNW 90-07, Transportation Northwest, University of Washington, Seattle. 8. IESNA (2000) “IESNA Practice for Roadway Lighting”. American National Standard / Illuminating Engineering Society of North America ANSI/IESNA RP-8-00. 2000 USA. 9. IESNA (1998).”IESNA Guide for Choosing Light Sources for General Lighting”. Report DG-10-98. Illumination Engineering Society of North America 1998. New York. 10. Kumar, A. (1994) “Development of a Model for Determining Work Zone Illumination Requirements During Nighttime Highway Construction ” PH.D Dissertation University of Florida. 11. McCall, H. C. (1999). "Report on the Department of Transportation’s Administration of the Nighttime Construction Program”, Report 98-S-50, State of New York Office of the State Comptroller. 12. Pritchard, D.C (1995) Lighting, 5th Ed., Longman Scientific and Technical, Burnt Mill, Harlow, Essex.
5
13. Price, D. A. (1986) “ Nighttime Paving”, Implementation Report CDOH/DTP/R-86/6, Colorado Dept. of Highways, Denver, Federal Highway Administration, April. 1986.
N: Population size 0.3
Glare
14. Shepard, F.D. and Cottrel, B (1985) “Benefits And Safety Impact of Night Work-Zone Activities”, Report No. FHWA/RD-85/067, U.S. Department of Transportation, Federal Highway Administration, June 1985.
0.4
0.2
0.1 Start
0
Input No. of Generations (N), Population Size, Prob. Of Crossover, Prob. Of Mutation
Initialize Population
100 Luminaries Photometric Characteristics Data
First Generation n=1
Evaluate Fitness
Sort Population
Calculate Constraints Violation
Select Population
Perform Crossover and Mutation
Create Child Population
Evaluate Fitness of Child Population
Combine Child and Parents Population
N = 50
N = 400
6 Uniformity Ratio
Calculate Crowding
N = 800
200
Figure 2. Illuminance / glare trade-off
Function Evaluation Programs (Illuminance, Uniformity Ratio, Veiling Luminance, and Glare) Pavement Reflectance Characteristics Data
N = 100
150 Illuminance (lux) N = 200
5
N: Population size t: Number of generations
4 3 2 1 100
150
200
Illuminance (lux) Sort Combined Population
Select Parents Population for Next Generation
Next Generation n++
N = 100, t= 250 N = 250, t = 25 N = 250, t = 50
N = 50, t = 250 N = 800, t = 234
Figure 3. Illuminance / uniformity ratio trade-off
n=N
End
Figure 1. Lighting Design and Optimization Model
6