reactions leaving product species in excited states which then emit photons, and aurora, .... data containing clouds and other realistic imperfections. 3. ..... unoccluded regions collapse to single well-defined peaks in the. ACF and CCF.
Proceedings of the 2nd International Conference on Cybernetics and Information Technologies, Systems, and Applications, Vol. 1, pp. 36-41, July 2005
Automated Feature Recognition, Tracking, and Quality Control in Ground-Based Images of the Upper Atmosphere Todd R. Pedersen Space Vehicles Directorate, Air Force Research Laboratory Hanscom Air Force Base, Massachusetts, 01731, USA Charles Carrano and James Griffin Radex Inc. Lexington, Massachusetts, 02421, USA
ABSTRACT Optical imaging is a valuable means of observing upper atmospheric structures, but tropospheric cloud cover and lack of automated means of data analysis present significant barriers to operational use of data from ground-based optical instruments. We have developed several concepts for identification and tracking of equatorial plasma depletions in all-sky imager data under realistic conditions including significant cloud cover. The most successful algorithm relies on identification of depletions by their motion, and allows multiple frames of image data to be processed coherently along a preferred axis in a 3-D spatio-temporal data structure corresponding to the depletion motion. This greatly reduces cloud effects up to 50% cloud cover. When applied to the background star field, our correlation-based technique collapses a random star pattern into a single easily identifiable peak in a correlation distribution. The displacement of this star peak in a cross correlation provides a robust means to automatically distinguish between true stars and hot pixels or noise, and allows rapid automatic identification of image regions affected by clouds without the need to identify, locate, or track any specific stars.
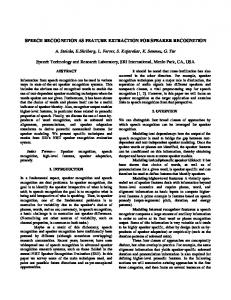
[3]. These bands represent regions of greatly reduced plasma density and are referred to as “depletions,” “bubbles,” or “plumes.” In accord with the lower density, the optical signature consists of N-S running dark regions in the background airglow, often with multiple branches forming when the depletions extend a significant distance from the magnetic equator. Ground-based all-sky imagers can provide high-quality images of depletion structures over fields of view in excess of 1000 km diameter from a single instrument. Neural network techniques have been applied with considerable success to allsky images, providing general information on weather conditions and even types of auroral forms [4]. For operational use of image data, however, a fully automated means of locating, recognizing, and tracking specific ionospheric structures or other space weather features from realistic images containing clouds, background light, thermal noise, hot pixels, and other common artifacts and clutter is required. Figure 1 shows an all-sky image of a depletion structure observed from Ascension Island in the South Atlantic Ocean near solar maximum in the region of greatest ionospheric density, representing a “best case” scenario in terms of sensitivity and signal-to-noise ratios for this type of observation.
Keywords: All-sky imaging, airglow, optical motion determination, star detection, auto-correlation, cross-correlation.
1. INTRODUCTION There are two main categories of optical emissions from the upper atmosphere: airglow, generally resulting from chemical reactions leaving product species in excited states which then emit photons, and aurora, or photon excitation generally resulting from particle impact on ambient atmospheric gasses [1]. In this work we focus on airglow from decay of the ionospheric F region plasma near the equator, although some characteristics, especially spectral composition, are in common with auroral emissions. Recombination of the F region plasma at ionospheric altitudes of several hundred km proceeds through several mechanisms, and results in detectable optical emissions from atomic oxygen at wavelengths of 630.0, 557.7, and 777.4 nm [2]. Typical airglow intensities are on the order of a few hundred Rayleighs (R=106 photons/s/cm2 integrated along a line of sight) [1] and are well below the detection threshold of the human eye. Typical exposure times range from 1-15 seconds for intensified systems, and 10-200 s for “bare” CCD imagers. Observations of the equatorial ionosphere are primarily motivated by radio wave scintillation caused by irregularities that form after sunset in large north-south elongated bands extending up to 10°-20° to either side of the magnetic equator
Figure 1. A 630.0 nm all-sky image from Ascension Island showing several well developed branched depletion structures as dark regions against the brighter background ionosphere. The original image was 335x325 pixels and integrated for 2 minutes, providing over 20,000 counts/pixel in the brighter regions.
Proceedings of the 2nd International Conference on Cybernetics and Information Technologies, Systems, and Applications, Vol. 1, pp. 36-41, July 2005 2. POTENTIAL CHARACTERISTICS USEFUL FOR OPTICAL IDENTIFICATION The defining characteristics of these optical structures, compared with clouds or other sky features are as follows. 1) Depletions and other airglow features appear in narrow spectral lines; clouds reflect or scatter a broad spectrum. Aurora are spectrally similar to airglow, but are typically orders of magnitude brighter and generally extend over a greater number of emissions and a wider altitude range [1]. 2) Emissions from ionospheric structures and aurora originate at altitudes of hundreds of km, whereas clouds are primarily at altitudes below 10 km. 3) Depletion structures typically move faster than they evolve, and are typically present over a large number of image frames. Clouds often evolve as rapidly as they move, and can have larger apparent motion, leaving individual features visible in only a few frames and smeared out during longer exposures. Auroral features can be extremely dynamic and change in brightness, shape, and location in a matter of seconds. 4) Ionospheric depletions typically move steadily from west to east at a rate that gradually declines throughout the night. Clouds can move in any direction, but at many equatorial sites they predominantly move east to west with the trade winds. 5) Depletions have a pronounced N-S axis of elongation; clouds usually have random shapes. Auroral features are often very narrow and preferentially aligned in the magnetic E-W direction, but during active conditions a wide variety of shapes and orientations can be present. 6) Airglow and aurora at typical wavelengths is optically thin and is transparent to stars; thick clouds are opaque to stars. These features provide for the following means of
Depletions
Clouds
Technique
Narrow line spectrum Altitude 100-500 km
Broad spectrum
Filter vs. unfiltered images Triangulation, multi-site imaging Multi-frame composite images
Altitude 0-10 km
Frame Rate > Motion > Evolution Steady E-W motion N-S elongation
Evolution > Motion > Frame Rate Motion in any direction Random shapes
Transparent to stars
Opaque to stars
Identify by velocity signature Correlation space signature Star detection to identify clouds
Table 1. Characteristics of airglow depletions and clouds useful for automated feature recognition. discriminating between clouds and target ionospheric features: 1) The line spectra of airglow and aurora allow clouds to be identified by comparison between images taken on an emission line and just off the line; features identical in both images are clouds or background light pollution, while features unique to the line emission image are of upper atmospheric origin. 2) The high altitude of airglow and aurora allows triangulation or comparison of images from multiple sites to be used to conclusively identify upper atmospheric features. The simplest example of this would be to collect data from imagers spaced a few km apart. Ionospheric features at several hundred km
altitude would appear almost identical over a baseline of a few km, due to the small parallax, while clouds, at altitudes of the order of the baseline separation, will appear at very different locations in the two images if at all. 3-4) The different motion of clouds and ionospheric features is the primary cue human observers use in discrimination, typically by viewing time-lapse movies of the data. The persistence of the ionospheric features is also a key feature, as it allows data acquired over many frames to be combined, after properly compensating for the motion, to create composite statistical images minimizing cloud effects. Techniques to do this are a primary focus of the present work. Aurora are typically much more variable in motion and this type of technique can perhaps best be applied by looking for the relatively much steadier motion of the clouds. 5) The common elongation of depletions can aid identification through its effects on the correlation space features of image data. 6). Stars showing through airglow or aurora but not clouds allow star detection to be employed for cloud identification and other quality control even in images filtered for airglow wavelengths. Table 1 summarizes the characteristics and potential techniques for automated detection of equatorial depletions from image data containing clouds and other realistic imperfections.
3. DETERMINATION OF FEATURE MOTION As mentioned above, motion of equatorial depletions is one of the most useful distinguishing characteristics. It is also a key element in short-range forecasting, as the relatively steady and predictable motion allows the positions of disturbed regions to be projected up to several hours into the future to estimate later effects on other downstream locations. This is the basis of AFRL’s SCINDA model [3], which detects the depletions using observed fluctuations on radio links and then projects other outage regions based on the assumed elongation of the features and the measured motion (determined in this case by spaced radio receivers sensitive to kilometer-scale irregularities in the depletions). We have examined a wide variety of motion detection algorithms for determining the motion of ionospheric structures from all-sky image data, including standard image processing techniques including optical flow and phase correlation. Optical flow algorithms [5, 6] require significant structure throughout the image, and tended to provide much more detailed flow fields than are realistic for our typical scenarios, where we expect mostly uniform eastward flow over the sky. Large discontinuities in brightness in the time series, resulting from occasional vehicle headlights, clouds, or other image artifacts, translate into disastrously incorrect velocity fields due to the use of changes in images as divergence constraints on the flow field. Phase correlation algorithms [7] were found to require sharper gradients for proper operation than are typically found in relatively fuzzy low-contrast ionospheric images; in our trials we consistently found this technique to key on the motion of stars or to be confused by sporadic hot pixels. Even after removing stars and hot pixels with a median filter, the phase correlation technique did not perform well. One technique we developed and had some success with on an ad hoc basis was contour matching. In this technique we contoured each image and then looked for the average displacement of sets of contours similar to those in previous images. A vital constraint for matching was to filter for contours with approximately equal areas. This technique works
Proceedings of the 2nd International Conference on Cybernetics and Information Technologies, Systems, and Applications, Vol. 1, pp. 36-41, July 2005 reasonably well with cloud-free images, but is undesirable because of the non-linear nature of the contouring process, where small changes in brightness can lead to large changes in contour outlines and areas, such as when an “island” contour merges with a neighboring contour to become a “peninsula” with similar outlines but a vastly different area enclosed. The most promising technique thus far has been a straight cross-correlation computed efficiently using fast Fourier transforms (FFT). Changes in absolute brightness have less effect with this technique, and the autocorrelation and cross correlation functions (ACF and CCF) also provide extremely useful information for discrimination of image features. In practice, the best results from the correlation technique have been obtained by utilizing difference images as the input to the correlation. This process eliminates the background offset, minimizes artifacts such as vignetting, light contamination, and filter imperfections, while accentuating steadily moving features including depletions and stars. We also found that use of a simple Kalman filter [8] greatly improved the results and allowed bad velocity points, which are inevitable in an automated analysis where data has not been preselected for lack of clouds, to be thrown out while keeping reliable measurements. The models successfully used to constrain the Kalman filter were a constant velocity model and one with a constant first derivative of the velocity, allowing for the typically observed decline in velocity magnitude over the course of the night.
Figure 2. East-west velocities derived from 630 nm optical images from Ascension Island for the evening of March 16, 2002 using the contour tracking technique and a simple Kalman filter. Gray points represent assimilated points, black rejected points, and the solid line the final filtered velocity.
4. TIME SERIES OF IMAGES CONSIDERED AS A 3-D VOLUME Accurate knowledge of the motion of an image feature, combined with the fact that the feature persists more-or-less unchanged over multiple frames, allows multiple images of the feature to be combined to produce a statistical composite view, as has been done previously with selected data sets [9, 10]. In the case of equatorial depletions, the most desirable aspect of this process is the potential to allow cloud-free composite images of ionospheric structure to be created from individual images each partially obscured by clouds. To visualize how this process works, we consider the time series of image data as a 3-D cube with two spatial dimensions and one temporal dimension. If one imagines looking straight down through the cube and integrating all the images, all the stationary features of the image, such as image edges or ground lights, line up, while moving features are smeared out by their motion. Difference imaging takes advantage of this effect to remove stationary features and emphasize moving ones.
Persistent but steadily moving features will also line up, but along different axes tilted relative to the “vertical” or zeromotion axis. As illustrated in Figure 3, if the stack of images is skewed to one direction we can arrange for all the stars to line up, while the unmoving background features become smeared. The same process can be applied to slower-moving clouds and ionospheric depletions. Along the ionospheric motion axis, the depletions add coherently in a composite average image, while clouds, stars, and background effects are incoherent and become blurred.
Figure 3. Creation of composite images emphasizing features with specific motion by integrating along different axes within a 3-D cube created by stacking multiple image frames. An example of this process applied to actual data is shown in Figure 4. The raw all-sky image is mapped to geographic coordinates assuming an unknown but realistic emission altitude, and the mapped images are then fed into the velocity determination algorithm. With a calculated velocity, ten frames of data spanning 20 minutes can be added after shifting each based on the velocity to generate a coherently integrated composite statistical image. Stars and clouds are not coherent along this axis and become smeared out in the averaging. As can be seen from the figure, significant obscuration from clouds in individual images can be overcome by this process to produce composites of useful quality. In applying this algorithm to many nights of data with varying degrees of cloud cover, we find it can produce useful results up to about 50% cloud cover, at which point the velocity determination usually breaks down. With an external source of velocity information, such as a co-located spaced-receiver scintillation system, or an automated means of excluding occluded regions from the velocity determination and composite image, this technique could conceivably work at even greater fractions of cloud cover.
Proceedings of the 2nd International Conference on Cybernetics and Information Technologies, Systems, and Applications, Vol. 1, pp. 36-41, July 2005 The maps shown in Fig. 4 utilize only a simple average over the 10 frames contributing to the composite, but more complicated processing, such as identification of depletions in a 3-D correlation space constructed from such a data cube, or histogram analysis along motion axes, could potentially be used to directly filter out all image features not matching the target description and could lead to extremely high-quality output. As an initial step in this direction we have attempted median filtering of the images along the time axis and successfully eliminated isolated clouds and sporadic light contamination from the data without perceptible impact on the visual quality of individual images. Provided a sufficient number of good data points along the ionosphere axis are available to discriminate between the depletion brightness and cloud or star contamination, and to allow accurate velocity determination, higher orders of spatio-temporal statistical processing taking advantage of velocity information have the potential to produce nearly flawless maps of depletion structures from ground-based optical data even with significant cloud cover present.
quickly when displaced in the direction perpendicular to their axis of elongation, whereas displacement parallel to the elongation must be much greater to significantly reduce the correlation. The inherent elongation of equatorial depletions, when transformed into correlation space, results in a N-S elongated peak in the correlation distribution, as can be seen in Figure 5. In a cross-correlation, the elongated correlation peak additionally becomes offset from the center of the distribution corresponding to the motion of the depletions, and the combined characteristics of elongation and offset provide a definitive signature identifying optical depletions.
Figure 4. Output of our velocity-based depletion tracking and forecast algorithm applied to data significantly obstructed by clouds. The raw data (upper left) is mapped to geographic coordinates (upper right), velocities determined and filtered, and then a 10-frame statistical composite is generated by averaging along the axis of the data cube corresponding to the depletion velocity (lower left). This greatly minimizes the impact of clouds obscuring portions of individual frames, while knowledge of the velocity allows short-term forecasts to be made by projecting the position of the features forward in time (lower right).
Figure 5. A difference image of a large depletion structure after mapping to geographic coordinates (top). The bottom panel shows a cross-correlation of this image, where the signature takes the form of a N-S elongated peak offset from the center by the motion of the structure.
5. CORRELATION SIGNATURE OF EQUATORIAL DEPLETIONS In addition to allowing motion determination, correlation analysis also provides a means for identifying image features based on general aspects of their shapes, without the need to locate or trace the outlines of any specific feature. Elongated structures such as equatorial depletions become decorrelated
6. MOTION-BASED STAR DETECTION AND QUALITY CONTROL Our initial studies of image auto and cross correlation features were motivated by the need to determine the motion and characterize the shapes of upper atmospheric features, but in this process it became clear that the same technique provides unmatched advantages for image quality control and cloud detection using the correlation and motion signatures of the background stars. The presence or absence of stars in an image is an obvious indicator of atmospheric transparency, but automated detection and measurement of stars in wide-angle image data has been problematic at best.
Proceedings of the 2nd International Conference on Cybernetics and Information Technologies, Systems, and Applications, Vol. 1, pp. 36-41, July 2005 by the number of pixels corresponding to their common motion during the time between frames, as shown in Figure 6. Hot pixels and noise either correlate only randomly between frames, in which case the contribution is spread across the space, or remain fixed relative to the detector and correlate at zero offset. For an image region dominated by true stars, the offset CCF peak and the central ACF peak will be nearly identical in magnitude, provided the region is large enough relative to the motion that no more than a few stars have moved out of the region. The ratio of the central ACF peak to the offset CCF peak is therefore an excellent means of flagging hot pixels and pixel noise, while the offset “star peak” in the CCF correctly indicates the intensity of the actual stars, even in fairly noisy data. Figure 7 shows a poorer quality all-sky image where noise and hot pixels make a significant contribution to the central ACF peak, and the true degree of stellar visibility can only be seen in the star peak of the CCF. To be unambiguous, both frames contributing to the CCF must contain stars; it is impossible to determine from the CCF alone which of the two frames, or possibly both, are obscured.
Data ACF CCF
The obvious approach to the use of stars as an indicator of sky clarity is to locate individual stars listed in an astronomical catalog and compare the measured intensity with the cataloged magnitude, but this is potentially resource-intensive and intolerant of many of the common limitations of low-light ground-based images, especially the low image resolution (typically a few pixels per degree) and narrow-band (~2 nm) filtering, which changes the apparent magnitudes of the stars depending on their spectral type and the wavelength observed. The biggest barrier, however, is accurate spatial identification of specific pixels in the data with known stars from a catalog [11]. Imager orientation is often approximate and only determined after the fact by manual analysis of the star field. Bumping of equipment or shifting of mounts can also change the image orientation even if a precise spatial calibration is made during installation. Wide-angle lenses induce significant distortion into the image, as can acrylic or glass domes, especially if the system is not positioned in the center of the dome, preventing simple angular relationships from being used to describe actual image coordinates. In manual orientation solutions using star fields from all-sky data we have only rarely achieved RMS deviations of less than 1 pixel over the field of view, even with a 2nd order non-linear model of the imager coordinate projection. At this level of accuracy it is apparent that a great number if not most stars would fail to appear in the data at the pixel location corresponding to their catalog coordinates. Our motion-based star recognition scheme, however, completely bypasses the need to identify any individual stars, whether by their coordinates or magnitude, and instead uses a characteristic that all stars, planets, and other celestial objects have in common—their steady apparent rotation about the celestial poles at a rate of 15° per hour. Stars are small point-like sources distributed more or less randomly across the sky. In the ACF, the star pattern matches itself only at zero offset, producing a high narrow peak at the center of the distribution. Individual bright stars will correlate with other bright stars at various offsets, but these secondary peaks from star pairs will be much smaller than the central peak incorporating all stars in the region. The magnitude of the central peak, relative to the image background, is a direct indication of the total intensity of the stars in a given region, and most importantly, can be computed with absolutely no information on any specific stars, their locations, or magnitudes. Figure 6 shows an example of an unfiltered all-sky image showing various sky conditions and the ACF and CCF representations of selected regions. As suggested by the data in Figure 6, A narrow central peak in an ACF would appear to be an ideal indicator of sky clarity, except for one additional difficulty: hot pixels and pixel noise. Like stars, hot pixels and pixel noise are also point-like sources, and show up in an ACF as a narrow peak at zero offset. Hot pixels in an image of an overcast sky can easily fool even human observers unless they observe over multiple frames of image data or view the data as a time-lapse movie. Hot pixels and noise can be easily distinguished from stars by comparing later frames. Stars rotate about the celestial poles while retaining the same pattern, whereas hot pixels and noise remain either at fixed locations or appear randomly from frame to frame. In correlation space, stars can be distinguished from hot pixels or noise by performing a cross correlation on images taken at different times. In the CCF, stars moving together will form a sharp peak, as in the ACF, but displaced from the center
Cloud Reduced Clear Seeing Sky
Cloud
Figure 6. An unfiltered 335x325 pixel all-sky image showing a variety of visibility conditions ranging from clear sky and reduced seeing to illuminated and unilluminated clouds. Expanded views of the raw data, autocorrelation, and 5-minute cross correlation for selected regions of the image are shown
Proceedings of the 2nd International Conference on Cybernetics and Information Technologies, Systems, and Applications, Vol. 1, pp. 36-41, July 2005 below. Observe how the random star patterns in the two unoccluded regions collapse to single well-defined peaks in the ACF and CCF. Note also the displacement of the star peak to the left in the CCFs due to the apparent motion of the stars. Instead of calculating the positions of thousands of stars every minute as they rotate, the motion-based technique requires the calculation of star displacements only once for each region of the sky, and can be done easily with only a few frames of clear sky data from the instrument itself. The motion-based star identification algorithm does break down as one approaches the celestial poles, where the angular motion eventually drops below 1 pixel of displacement, but for equatorial applications this is not a significant limitation.
Figure 7. A poorer quality filtered image taken at 777.4 nm just prior to the unfiltered image in Fig. 6 showing some stars along with significant noise and hot pixels. The selected region appears to have stars and shows a large narrow peak in the ACF, but the CCF reveals that the true star contribution is actually considerably smaller than the ACF peak, indicating that hot pixels and noise are significant in this region.
7. CONCLUSIONS We have discussed a variety of image processing schemes for use in automated detection and tracking of equatorial ionospheric depletions, and presented novel methods of using correlation space signatures to greatly simplify use of stars present in image data for quality control. We have demonstrated composite images computed in the reference frame of the moving ionospheric structures and shown that this
process can provide useful data and short-term forecasting even during periods of significant partial cloud cover. We summarize our findings by outlining a conceptual optical data acquisition and processing system optimized for operational detection, tracking, and mapping of equatorial depletions, although we limit the discussion to consideration of only single sites and not integrated imager networks. In an ideal scenario, simultaneous image frames both on and off the emission lines would be acquired with identical exposure times and other settings as the preferred indicator of cloud presence. Clouds, especially low-altitude clouds in the trade winds region, move significantly during any realistic exposure, so taking a background image at the same time and for the same length of time is essential. Unfortunately, most current systems perform sequential imaging using filter wheels, making this impossible. For a sequential imaging system, an unfiltered exposure or background filtered exposure should be taken at least once per cycle if possible. The system would then detect and flag images or image regions obscured by clouds, making use of data from the background or unfiltered images. We have outlined a novel motion-based star extraction technique utilizing the offset “star peak” in the cross-correlation to provide a straightforward and robust means of performing this type of quality control. Once regions of clear sky have been identified, the data would be run through a motion detection algorithm targeting depletion signatures. Depending on the technique used, velocity data may benefit significantly from filtering taking advantage of image quality and depletion identification metrics. Multiple data images can then be shifted and integrated coherently to produce a composite image. By not including cloudy or otherwise obscured regions of the individual images in the composite, a final map of the depletion structure can be obtained at significant cloud cover fractions with almost no visible effect on the output. The final maps can then be thresholded or otherwise processed to indicate regions of ionospheric disturbance, and these can be projected into the future to make short-range forecasts. None of the processing required is particularly resource-intensive, as the correlations can be done efficiently using FFT algorithms, so it is realistic to expect that during a 1 minute exposure or exposure cycle the entire quality control, motion detection, and composite construction can be updated, providing true real-time output. Acknowledgements. This work was supported by AFOSR task 2311AS. Work at Radex was conducted under contract F19628-00-C-0089. 8. REFERENCES [1] J. Chamberlain, Physics of the Aurora and Airglow, Academic Press, New York, 1961. [2] J. J. Makela, et al., Ionospheric topography maps using multiple-wavelength all-sky images, J. Geophys. Res., Vol. 106, A12, 29161, 2001. [3] K. Groves, et al., Equatorial scintillation and systems support, Radio Science, Vol. 32, 2047, 1998. [4] M.T. Syrjasuo and E.F. Donovan, Diurnal auroral occurrence statistics obtained via machine vision, Annales Geophysicae, 22: 1103-1113, S-Ref-ID: 14320576/ag/2004-22-1103, 2004. [5] Horn, B. K. P. and Schunck, B. G., Determining optical flow, Artificial Intelligence, 17, pp. 185-204, 1981.
Proceedings of the 2nd International Conference on Cybernetics and Information Technologies, Systems, and Applications, Vol. 1, pp. 36-41, July 2005 [6] Beauchemin, S.S. and Barron, J.L., The Computation of optical flow, ACM Computing Surveys 27, 433-467, 1996. [7] Thomas, G. A., Television motion measurement for DATV and other applications, Tech. Rpt. 1987/11, BBC Research Department, 1987. [8] E. Brookner, Tracking and Kalman filtering made easy, Wiley, New York, 1998. [9] B. A. Tinsley, et al., Images of transequatorial F region bubbles in 630- and 777-nm emissions compared with satellite measurements, J. Geophys. Res., 102(A2), 20572077, 1997. [10] J. J. Makela and M. C. Kelley, Field-aligned 777.4-nm composite airglow images of equatorial plasma depletions, Geophysical Research Letters, Vol. 30., 8, 1442, doi:10.1029/2003GL017106, 2003. [11] R. Seviour, M. Kosch, and F. Honary, Identification of clouds and aurorae in optical data images, New J. Phys. 5 PII: S1367-2630(03)54104-0, 2003.