minerals Article
Optimization and Quality Control of Automated Quantitative Mineralogy Analysis for Acid Rock Drainage Prediction Robert Pooler 1, * and Bernhard Dold 2 1 2
*
SGS Minerals Chile, Geometallurgy Area, Puerto Madero 130, Pudahuel, Santiago 9061073, Chile Division of Geosciences and Environmental Engineering, Luleå University of Technology, Luleå 97187, Sweden;
[email protected] Correspondence:
[email protected]; Tel.: +56-57-240-4070
Academic Editor: Javier Sánchez-España Received: 6 November 2016; Accepted: 13 January 2017; Published: 21 January 2017
Abstract: Low ore-grade waste samples from the Codelco Andina mine that were analyzed in an environmental and mineralogical test program for acid rock drainage prediction, revealed inconsistencies between the quantitative mineralogical data (QEMSCAN® ) and the results of geochemical characterizations by atomic absorption spectroscopy (AAS), LECO® furnace, and sequential extractions). For the QEMSCAN® results, biases were observed in the proportions of pyrite and calcium sulfate minerals detected. An analysis of the results indicated that the problems observed were likely associated with polished section preparation. Therefore, six different sample preparation protocols were tested and evaluated using three samples from the previous study. One of the methods, which involved particle size reduction and transverse section preparation, was identified as having the greatest potential for correcting the errors observed in the mineralogical analyses. Further, the biases in the quantities of calcium sulfate minerals detected were reduced through the use of ethylene glycol as a polishing lubricant. It is recommended that the sample preparation methodology described in this study be used in order to accurately quantify percentages of pyrite and calcium sulfate minerals in environmental mineralogical studies which use automated mineralogical analysis. Keywords: automated quantitative mineralogy; environmental mineralogy; polished section preparation; QEMSCAN® ; acid mine drainage prediction
1. Introduction Accurate mineral quantification is key in order to predict the behavior of a rock sample in different geochemical environments, due to potential dissolution or oxidation reactions, which may lead to the release of elements into the environment and/or generation of acidity, as for example during sulfide oxidation and the subsequent formation of acid rock drainage (ARD). There is a tendency, which is often due to reduced budgets for waste rock and tailings characterization testwork, to only perform a suite of relatively inexpensive geochemical “environmental” tests on these materials, which may include acid base accounting (ABA), paste pH, net acid generation (NAG), and typically in fewer cases, humidity cell tests [1]. However, although some general insights about the sample mineralogy can be derived from the results of these tests, extremely erroneous interpretations can also be made, notably with respect to one of the most important factors- the sulfide and sulfate mineralogy. It is most critical to accurately quantify these minerals in order to be able to predict the formation of ARD or the release of hazardous elements in solution. New powerful analytical techniques, like automated quantitative mineralogy (QEMSCAN® or MLA (Mineral Liberation Minerals 2017, 7, 12; doi:10.3390/min7010012
www.mdpi.com/journal/minerals
Minerals 2017, 7, 12
2 of 19
Analyzer), now provide the possibility to quantify the mineral content in a relatively fast and automated way. However, the examples presented here show that rigorous quality control and accurate mineralogical and geochemical studies are needed to produce high quality data within an acceptable error range. In the case of copper porphyry deposits, it has been shown that acid rock drainage and contamination of nearby water bodies produced by tailings and/or waste rock is primarily related to the oxidation of sulfide minerals such as pyrite, the most predominant sulfide mineral in these deposit types, and/or the dissolution of soluble sulfate minerals such as gypsum [2,3]. This characteristic, in conjunction with the presence of a gangue mineralogy that has a low acid neutralization potential, gives copper porphyry wastes a particularly high tendency for ARD formation [4]. Results from studies of mine waters generated from porphyry copper rocks have illustrated that they are typically acidic (pH 2–4) and relatively high in dissolved metal concentrations [5]. As mineralogical composition has been recognized as being one of the principal factors which influences pyrite oxidation [6], the accuracy and precision of the mineralogical characterization (especially that of pyrite and gypsum) is extremely important in order to properly evaluate the potential environmental impact for porphyry copper deposit waste materials. A summary of the steps involved in the oxidation of pyrite and generation of protons is presented in the following reactions (for more detailed reviews the reader is referred to Dold [2,7] and Dold and Weibel [8]). FeS2 + 7 /2 O2 + H2 O → Fe2+ + 2SO4 2− + 2H+ (1) Fe2+ + 1 /4 O2 + H+ ↔ Fe3+ + 1 /2 H2 O
(2)
Fe3+ + 3H2 O ↔ Fe(OH)3 + 3H+
(3)
FeS2 + 14Fe3+ + 8H2 O → 15Fe2+ + 2SO4 2− + 16H+
(4)
Reaction (1) describes the oxidation of pyrite as it would occur in the presence of atmospheric oxygen at pH conditions above 4. The Fe2+ ion liberated oxidizes rapidly to Fe3+ under these conditions (Reaction (2)). In the typically neutral to alkaline pH conditions of fresh waste rock and flotation tailings, the Fe3+ will precipitate as iron hydroxide species (Reaction (3)). However, as the pH shifts to a value less than approximately 4, the ferric ion may be stable in aqueous solution and will begin to oxidize pyrite to produce protons, as per Reaction (4) [9,10]. In the context of the interpretation of geochemical test results, it is also very important to have knowledge of the proportion of sulfur which occurs in sulfide, versus that which is hosted in sulfate minerals. During geochemical and humidity cell tests, the products liberated during the dissolution of calcium sulfates, for example, can only be differentiated with advanced stable isotope studies [3,11,12], which are normally not performed. However, with mineralogical information obtained beforehand, more meaningful interpretations with respect to the sources of dissolved sulfate can be made [13,14]. Therefore, care must also be taken to accurately detect and quantify common sulfate minerals such as gypsum and anhydrite in porphyry copper deposit samples. The phenomena of particle density segregation and soluble minerals dissolution are quite common in the preparation of polished sections for resin-encapsulated particles. These phenomena can have very serious impacts in the quantitative mineralogical results obtained from affected samples. Furthermore, commercial mineralogical laboratories typically repeat hundreds of mineralogical analyses annually as a result of this problem, resulting in time and profit loss. In order to demonstrate these problems and the need for advanced analytics and quality control, we present a study to track, evaluate, and solve analytical problems in the quantification of minerals through a case study of acid rock drainage prediction for the Rio Blanco porphyry copper deposit of the CODELCO Andina Division, Chile.
Minerals 2017, 7, 12
3 of 19
1.1. Background 1.1.1. Previous Study Although optical microscopy and X-ray Diffraction have been used traditionally, more recently, the use of automated mineralogical techniques for environmental mineralogy has demonstrated value and has gained popularity, particularly in the last decade [15–21]. The scope of a study executed between 2008 and 2012 for the Andina Division, CODELCO, Chile, included geochemical and mineralogical characterizations for 360 samples in order to evaluate their potential for acid rock drainage formation and liberation of toxic constituents. Extended detailed geochemical and mineralogical characterizations were performed [22,23]. The analytical approach included sequential extractions (Table 1) [24] and automated quantitative mineralogical characterization by QEMSCAN® (FEI Company, Eindhoven, The Netherlands) using the PMA (Particle Mineral Analysis) mapping mode. Table 1. Detail of sequential extraction procedure used in this study, modified after Dold [24]. Sequential Extraction Analysis Sequence
Preferentially Dissolved Minerals
(1)
Water soluble fraction: 1.0 g sample into 50 mL deionized H2 O with agitation for 1 h, at Room Temperature (RT)
secondary sulfates, e.g., bonattite, chalcanthite, pickeringite, magnesioauberite, gypsum
(2)
Exchangeable fraction: 1 M NH4 -acetate, pH 4.5 with agitation for 2 h, at RT
calcite, vermiculite-type mixed-layer, absorbed and exchangeable ions
(3)
Fe(III) oxyhydroxides: 0.2 M NH4 -oxalate pH 3.0 with agitation for 1 h in darkness, at RT
schwertmannite, two-line ferrihydrite, secondary jarosite, MnO2
(4)
Fe(III) oxides: 0.2 M pH 3 heat in water bath 80 ◦ C for 2 h
goethite, jarosite, Na-jarosite, hematite, magnetite, higher ordered ferrihydrites
(5)
Organic matter and secondary Cu-sulfides: 35% H2 O2 heat in water bath for 1 h at 80 ◦ C
organic matter, covellite, chalcocite-digenite
(6)
Primary sulfides: combination of KClO3 and HCl, followed by 4 M HNO3 boiling
pyrite, chalcopyrite, bornite, sphalerite, galena, molybdenite, Cu-As-Sb sulfosalts, cinnabar, orpiment, stibnite
(7)
Residual: HNO3 , HF, HClO4 , HCl digestion
silicates, other residual phases
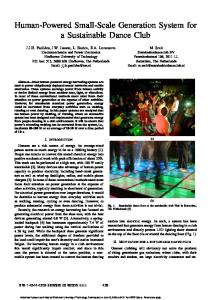
Through an extensive quality control review, significant differences were observed between results obtained by QEMSCAN® and results of elemental analyses for iron and sulfur done by atomic absorption spectroscopy (full digestion using HF, HClO4 , HNO3 and HCl) and the LECO combustion furnace with infrared spectroscopy, respectively. Particularly, biases were observed which suggested that QEMSCAN® could be overestimating the weight percentages of pyrite in the samples. Figure 1 presents conciliation scatter plots for Fe and S, respectively. In the plots, the chemical assays are compared to the percentages of elements determined from QEMSCAN® results, which are calculated using the percentages of the iron- and sulfur-bearing minerals in the samples. This is commonly used as the main validation and quality control mechanism for automated mineralogical analysis [25–28]. For this conciliation, standard “textbook” compositions were used for the main sulfide minerals in the QEMSCAN® database. However, for the main iron-bearing gangue minerals (biotite, chlorite, siderite, and, to a lesser degree, tourmaline), compositions were determined through a scanning electron microscopy (SEM-EDS) study on representative mineral grains in the samples.
Minerals 2017, 7, 12 Minerals 2017, 7, 12 Minerals 2017, 7, 12
4 of 19 4 of 19 4 of 19
(B) (B)
(A) (A)
Figure 1. Scatter plots comparing chemical assays for Fe (A) and S (B) versus percentages calculated Figure assays for for Fe Figure 1. 1. Scatter Scatter plots plots comparing comparing chemical chemical assays Fe (A) (A) and and SS (B) (B) versus versus percentages percentages calculated calculated using QEMSCAN QEMSCAN®®mineralogy. mineralogy.The The assays were done by atomic absorption spectroscopy and ® using assays were done by atomic absorption spectroscopy and LECO ® using ®QEMSCAN mineralogy. The assays were done by atomic absorption spectroscopy and LECO (LECO Corporation, Saint Joseph, MI, USA) for Fe and S, respectively. Dotted lines represent (LECO Saint Joseph, MI, USA) Fe and Dotted Dotted lines represent the 1:1 LECO® Corporation, (LECO Corporation, Saint Joseph, MI,for USA) for S, Ferespectively. and S, respectively. lines represent the 1:1 correlation line, whereas solid lines areregression linear regression fits. correlation line, whereas solid lines are linear fits. the 1:1 correlation line, whereas solid lines are linear regression fits.
The conciliations take into account all Fe- and S-bearing species detected in the samples. The conciliations conciliations take S-bearing species take into into account account all all Fe- and S-bearing species detected detected in in the samples. samples. However, as pyrite is among the most predominant sulfur- and iron-bearing minerals in the aspyrite pyriteis among is among predominant sulfurand iron-bearing minerals in the However, as the the mostmost predominant sulfurand iron-bearing minerals in the samples ® may be overestimating the content samples (Figure 2), the observed biases show that QEMSCAN of ® may ® may samples 2), (Figure 2), the observed QEMSCAN overestimatingthe thecontent content of (Figure the observed biases biases show show that that QEMSCAN be be overestimating this mineral. this mineral.
(a) (a) Figure 2. Cont.
Minerals 2017, 7, 12 Minerals 2017, 7, 12
5 of 19 5 of 19
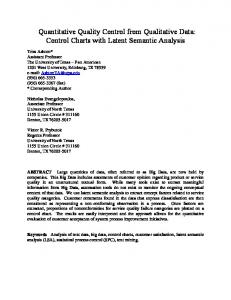
(b) ® Figure 2. (a) randomly chosen chosen Figure 2. (a) QEMSCAN QEMSCAN® Elemental Elemental deportment deportment charts charts for for Fe Fe and and (b) (b) SS for for 10 10 randomly samples. Sulfur percentage in particular is strongly associated with pyrite in the samples. samples. Sulfur percentage in particular is strongly associated with pyrite in the samples.
Additionally, a comparison of the mineralogical results with the sequential extraction and Additionally, a comparison of the mineralogical results with the sequential extraction and chemical chemical assay data suggested that the calcium sulfate minerals may not have been adequately assay data suggested that the calcium sulfate minerals may not have been adequately detected and detected and quantified by QEMSCAN®. In general, the sequential extraction results indicated ® quantified by QEMSCAN . In general, the sequential extraction results indicated greater amounts® greater amounts of these minerals in the samples than the quantities detected® in the QEMSCAN of these minerals in the samples than the quantities detected in the QEMSCAN analyses (Figure 3). analyses (Figure 3). The percentages of gypsum by sequential extraction are calculated using assays The percentages of gypsum by sequential extraction are calculated using assays performed on the leach performed on the leach solution of the first step on the analysis, which is a simple partial dissolution solution of the first step on the analysis, which is a simple partial dissolution of the pulverized sample of the pulverized sample in water at room temperature (Table 1). Therefore, the calcium assays in water at room temperature (Table 1). Therefore, the calcium assays obtained for the solution obtained for the solution can be used to calculate the equivalent percentages of calcium sulfate, can be used to calculate the equivalent percentages of calcium sulfate, assumed to be gypsum at assumed to be gypsum at the time of calculation. To evaluate the validity of this comparison, the the time of calculation. To evaluate the validity of this comparison, the sample with the highest sample with the highest percentage of calcium sulfate as determined by sequential extraction was percentage of calcium sulfate as determined by sequential extraction was analyzed by semi-quantitative analyzed by semi-quantitative X-Ray Diffraction (XRD) using the Rietveld method. The original X-Ray Diffraction (XRD) using the Rietveld method. The original QEMSCAN® analysis detected QEMSCAN® analysis detected 2.6% of calcium sulfate in the sample, whereas sequential extraction 2.6% of calcium sulfate in the sample, whereas sequential extraction indicated approximately 9.2%. indicated approximately 9.2%. In order to compare the XRD results with the other techniques, the In order to compare the XRD results with the other techniques, the calcium sulfate minerals must be calcium sulfate minerals must be mathematically summed and considered as a group, as they cannot mathematically summed and considered as a group, as they cannot be individually differentiated by be individually differentiated by QEMSCAN® or the sequential extraction technique used. When QEMSCAN® or the sequential extraction technique used. When summing the percentages of gypsum, summing the percentages of gypsum, anhydrite and bassanite, the XRD results indicate anhydrite and bassanite, the XRD results indicate approximately 14.6% of calcium sulfate minerals in approximately 14.6% of calcium sulfate minerals in the sample. This result, in conjunction with the the sample. This result, in conjunction with the relatively high Ca assay value for the sample (3.28%), relatively high Ca assay value for the sample (3.28%), supports the hypothesis that the sequential supports the hypothesis that the sequential extraction calcium sulfate percentage should be more extraction calcium sulfate percentage should be more accurate than the percentage detected by accurate than the percentage detected by QEMSCAN® for this sample. QEMSCAN® for this sample.
Minerals 2017, 2017, 7, 7, 12 12 Minerals
of 19 19 66 of
Figure 3. Scatter plot plot for for percentages percentages of of gypsum gypsum calculated calculated from from sequential sequential extraction extraction results results versus versus Figure 3. Scatter ® analyses for 2008 study. The dotted line represents the 1:1 correlation those detected by QEMSCAN ® those detected by QEMSCAN analyses for 2008 study. The dotted line represents the 1:1 correlation line, whereas whereas the line, the solid solid line line is is the the regression regression fit. fit.
1.1.2. Deposit Deposit Geology Geology and and Mineralogy Mineralogy 1.1.2. The CODELCO owns andand runsruns the mining operations at the Rio Blanco The CODELCOAndina AndinaDivision Division owns the mining operations at the Rio deposit. Blanco The deposit is located approximately 70 km NNE of the Chilean capital Santiago on the western deposit. The deposit is located approximately 70 km NNE of the Chilean capital Santiago onside the of the Andean Together with the adjacent Bronces mine, the district classified western side ofcordillera. the Andean cordillera. Together with Los the adjacent Los Bronces mine,isthe district as is a “behemothian” (sensu Clark(sensu [29]) porphyry copper system [30]. system [30]. classified as a “behemothian” Clark [29]) porphyry copper The deposit deposit is is hosted The hosted within within the the San San Francisco Francisco batholith, batholith, aa large, large, partially-exposed partially-exposed quartz quartz monzonite/quartzmonzodiorite monzodiorite intrusion. intrusion. The The batholith batholith is is believed believed to to be be of of early early or or middle middle Miocene Miocene monzonite/quartz age [31–33]. oval-shaped porphyry copper system has developed within the San Francisco age [31–33].AAroughly roughly oval-shaped porphyry copper system has developed within the San batholith, which displays the typical zonations in terms of alteration types that have been recognized Francisco batholith, which displays the typical zonations in terms of alteration types that have been by previousby researchers be associated porphyry copper deposits: a core region awith recognized previous to researchers to bewith associated with porphyry copper deposits: corepotassic region alteration surrounded by adjacent phyllic alteration and an extensive gradational outer halo of with potassic alteration surrounded by adjacent phyllic alteration and an extensive gradational outer propylitic alteration [34–36]. A series of younger hydrothermal tourmaline breccias were emplaced, halo of propylitic alteration [34–36]. A series of younger hydrothermal tourmaline breccias were which hostwhich a significant proportionproportion of the copper sulfide mineralization. Serrano et Serrano al. [37] estimated emplaced, host a significant of the copper sulfide mineralization. et al. [37] that approximately half of the copper mineralization in the Rio Blanco deposit occurs estimated that approximately half of the copper mineralization in the Rio Blanco deposit within occurs the tourmaline-rich hydrothermal breccias, with the other other types breccias within the tourmaline-rich hydrothermal breccias, with half the occurring other halfinoccurring in of other typesand of as stockworks disseminated textures in other rock in types. breccias and asand stockworks and disseminated textures other rock types. The common common gangue gangue and and ore ore minerals minerals found found in in the the Rio Rio Blanco are summarized in The Blanco deposit deposit are summarized in Table 22 below. copper Table below. The The main main copper copper sulfide sulfide minerals minerals are are chalcopyrite chalcopyrite and and bornite. bornite. Secondary Secondary copper sulfide minerals, (e.g., chalcocite/digenite and covellite) are only observed locally, but can contribute sulfide minerals, (e.g., chalcocite/digenite and covellite) are only observed locally, but can contribute substantially to to the the copper copper grades grades in in certain substantially certain zones zones of of the the deposit deposit [37]. [37]. Table 2. Common minerals minerals observed observed in Table 2. Common in the the Codelco Codelco Andina Andina mine. mine.
Ore Deposit Ore Deposit Deposit typetype Deposit
Codelco, Andina Division Codelco, Andina Division porphyry copper porphyry copper quartz, albite, K-feldspar, biotite, ankerite, siderite, calcite, quartz, albite, K-feldspar, biotite, ankerite, siderite, calcite, Gangue mineralogy Gangue mineralogy gypsum, sericite, chlorite, epidote, tourmaline gypsum, sericite, chlorite, epidote, tourmaline pyrite, chalcopyrite, bornite, molybdenite, sphalerite, galena, pyrite, chalcopyrite, bornite, molybdenite, sphalerite, galena, Hypogene ore mineralogy Hypogene ore mineralogy tennantite-tetrahedrite, magnetite, hematite, ilmenite tennantite-tetrahedrite, magnetite, hematite, ilmenite Supergene mineralogy Chalcocite-digenite, covellite Supergene mineralogy Chalcocite-digenite, covellite
Minerals 2017, 7, 12
7 of 19
2. Methods 2.1. Mineralogical Analyses by QEMSCAN® The QEMSCAN® instrument is an automated SEM-based mineralogical analyzer that was principally developed by the Commonwealth Scientific and Industrial Research Organisation of Australia (CSIRO) and was first presented as the “QEM SEM” at the International Mineral Processing Conference of 1982 by Miller et al. [38]. An excellent summary of the modes of mineralogical analysis available through QEMSCAN® technology can be found in Gottlieb et al. [39]. The QEMSCAN® Species Identification Protocol (SIP), which is used to identify measured energy dispersive spectra (EDS) against a “standard” mineral library for the deposit, had been previously developed by SGS Minerals Chile and validated by CODELCO Andina geologists by optical microscopy using polished thin sections. Several EDS spectra were collected for each of the minerals and SIP entries were created. A procedure similar to that described by Haberlah et al. [40] was used. The samples that were analyzed were provided to the laboratory with a relatively coarse particle distribution size. This presented a challenge, in that the standard 3 cm diameter polished sections prepared with these particles using the traditional methodology of Jackson et al. [41] contained very high sample areas to scan, making traditional Bulk Mineralogical and Particle Mineral Analyses (BMA and PMA, respectively) by QEMSCAN® extremely slow and uneconomical for a commercial laboratory. In light of this problem, a “coarse PMA” analysis was used. Typically, the spacing between points in a PMA analysis for finer particles is in the range of 2 to 5 µm, depending on the size fraction analyzed and scale of relevant textures to be characterized, however, in the case of the coarse PMA’s performed in the Andina samples, a 15 µm step size between analysis points was used in order to reduce analysis times. Through an internal study in which several variations in modes of analysis and parameters were tested, it was determined that the coarse PMA analysis with a 15 µm step size was the best compromise between analysis time and quality of data generated. In the current study, however, the only objective for the automated mineralogical analyses was the determination of bulk modal composition. Therefore, the particle sizes could be reduced and a more traditional approach to sample preparation and analysis could be evaluated. Given the aforementioned flexibility and the problems previously encountered with the large particle sizes, sample preparation tests which included mechanical particle size reduction were undertaken (Table 3) and the Bulk Mineralogical Analysis (BMA) QEMSCAN® mode was used. The following variations of polished section preparation methods used: i.
ii.
iii.
iv.
Tests 1 to 3: Evaluate effect of sieving the samples into several particle size fractions. More replicates are analyzed for the coarser fractions, because in these cases fewer particles are exposed at the surface of each 3 cm diameter polished section. The number of sections and size fractions are systematically reduced from Tests 1 to 3 in order to observe the effect on overall results. Test 4: The sample is not divided into size fractions, but a duplicate polished section is analyzed in order to evaluate the effect of increasing the number of particles with respect to the original analyses. Test 5: The use of transverse sections is investigated, where the original section is cut vertically and the two halves generated are turned 90◦ and mounted in a new resin-encapsulated polished section, exposing the vertical profile of the original section. It is hypothesized that this may reduce or eliminate the effect of particle segregation in the original section (e.g., Kwitko-Ribeiro [42]; Blaskovich [16]; Grant et al. [43]). Test 6A and 6B: The effect of particle size reduction through controlled mechanical pulverization is evaluated. The objective is to reduce the range of particle sizes and therefore the competition between particles as they settle towards the bottom of the sample mold during resin curing.
Minerals 2017, 7, 12
8 of 19
For the investigation of a sample preparation method which would preserve calcium sulfate minerals in the polished sections, ethylene glycol was used instead of water as a polishing lubricant during the lapping process. For the purpose of elemental conciliation and quality control, chemical assays for Cu, Fe and S were performed on the head samples using the same methods described previously in Section 1.1.1. Table 3. Sample preparation scheme for particle and mineral segregation study. Test No.
Test 1
Test 2
Test 3
Size ranges used (µm) No. polished sections/size fraction
≥850,