In Proc. IEEE WHISPERS 2009, Grenoble, FR, Aug 26-28, 2009
AUTOMATED LABELING OF SEGMENTED HYPERSPECTRAL IMAGERY VIA SPECTRAL MATCHING Brian D. Bue, Erzs´ebet Mer´enyi
Be´ata Csath´o
Electrical and Computer Engineering Rice University Houston TX, 77005, U.S.A. Email: {bbue, erzsebet}@rice.edu
University of Buffalo, SUNY Department of Geology Buffalo NY, 14260, U.S.A. Email:
[email protected]
ABSTRACT Despite recent advances in hyperspectral image processing, automated material identification from hyperspectral image data is still an unsolved problem. In this work, we develop a technique for labeling hyperspectral imagery, which leverages segmented image data and a library of spectral signatures of materials. We define a new spectral similarity measure that considers continuum removed spectra in addition to continuum intact reflectance spectra. We show that using both of these characteristics in similarity analysis yields improved results over recently proposed similarity measures. Analysis on an AVIRIS image of an urban scene is presented. Index Terms— spectral matching, spectral libraries, automatic labeling, AVIRIS, hyperspectral imagery 1. ADDRESSING THE SEMANTIC GAP IN REMOTE SENSING IMAGE INTERPRETATION Recent advances in imaging spectroscopy have generated substantial interest in material identification techniques using hyperspectral imagery. Sophisticated clustering algorithms have been developed to segment hyperspectral image data based on quantitative measures of spectral similarity, but external knowledge must be applied to derive the material interpretations for the resulting clusters. The “semantic gap” between such image clusters and their interpretations is typically addressed via manual inspection of the clusters by an expert, which can be time-consuming, tedious, and error prone. This process, unfortunately, does not allow for rapid data exploitation. Therefore, with increasingly widespread use of hyperspectral imaging in terrestrial and planetary missions, techniques to automatically assign semantically meaningful labels to image clusters could greatly improve science return from such data. We assume here that a sufficiently detailed and accurate segmentation is available for the image to be labeled. That is, we assume that spectrally different cover types in a scene are faithfully captured by the segmentation on the level of detail that is of interest to the application, and which allows discovery of unknown objects. Such segmentation itself is challenging for hyperspectral images, however, that challenge, addressed in former work, will not be repeated here. For our urban scene, described below, we produced a segmentation of 35 clusters in [1] with a self-organizing map, where all discovered clusters can be recognized as distinct cover types. We present preliminary work on an automatic spectral matching technique for hyperspectral imagery. It leverages two sources of prior knowledge, a segmented image and a library of known material spectra, to automatically determine material labels for image seg-
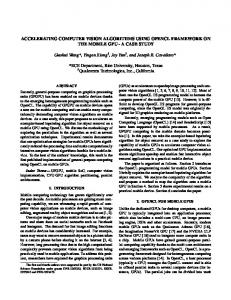
ments. We propose a new spectral similarity measure that yields improved performance in comparison to previously published results. 2. AUTOMATED SPECTRAL MATCHING 2.1. Methodology Given a segmented image, we compute the mean signature of each segment (we will use “mean signature” and “cluster signature” interchangeably). There are several benefits in using cluster signatures in spectral matching. One is that computation costs can be reduced since we only perform per-cluster (rather than per-pixel) comparisons to library spectra. Also, mean signatures are generally less noisy than single spectra. The flow diagram of spectral matching is shown in Fig. 1. After we convolve the spectral library to the appropriate instrument wavelengths, we select bands corresponding to those in the cluster signatures. In order to mitigate the effect of varied illumination conditions across image and library spectra, we scale all signatures by their Euclidean norm. This normalization brings vectors to unit length while preserving the spectral angles. Recognizing that geometric albedo is lost in this transformation, one may need to select from multiple same-spectrum matches based on albedo matches, in a post-processing step. This situation is, fortunately, rare. Finally, we rank the similarities of each cluster to the library signatures using a given similarity measure. Segmented Image
Compute Mean Cluster Signatures
Spectral Library
Convolve to Instrument Wavelengths
Scale by Euclidean Norm
Spectral Similarity Analysis
Select Corresponding Wavelengths
Library Matches
Scale by Euclidean Norm
Figure 1: Spectral matching procedure 2.2. Measuring Spectral Similarity The design of an accurate measure of similarity between spectral signatures is the heart of any spectral matching technique. For remotely sensed reflectance data, characterizing both the overall shape and the positions/widths of absorption bands is crucial for accurate matching. Some of the recently proposed spectral similarity measures include: the Euclidean distance (ED), Spectral Angle Mapper (SAM) [2], Spectral Correlation Measure (SCM) [3] and Spectral Information Divergence (SID) [4]. To emphasize absorption band
In Proc. IEEE WHISPERS 2009, Grenoble, FR, Aug 26-28, 2009 characteristics, continuum removal is often performed on the spectral signatures, and then one of the above measures is used to determine the similarity between the continuum removed (hereafter referred to as CR) spectra. Several techniques focus specifically on CR spectra, such as Spectral Feature Fitting [5] and Cross-Correlation Spectral Matching for Continuum Removed signatures (CCSM-CR) [6], but these methods are similarly applicable to continuum intact (hereafter referred to as CI) spectra. The Spectral Information Divergence (SID) was recently shown to outperform several traditional spectral similarity measures for CI spectra of certain materials [7] (hereafter referred to as CISID ). However, we found that for other spectral species CISID yields poor matches since absorption band properties are not adequately captured (see Fig. 2). One important common property of these measures is that they all singularly focus on measuring either CI reflectance signatures, or CR absorption band characteristics - but not both. If we solely utilize CI signatures, differences in absorption band characteristics are often poorly captured since they are only implicitly measured by pairwise differences of reflectance values. Alternatively, using CR spectra alone emphasizes differences in absorption bands (relative to the estimated continuum), but discards information related to the shape of the continuum. We introduce a spectral similarity measure, CICRd , with terms that account for differences in both CI signatures and their CR counterparts. We define CICRd as follows: CICRd (si , sj ) =
d(si , sj ) d(CR(si ), CR(sj )) +α vCI vCR
(1)
where si and sj are two spectral signatures, d(·, ·) is a spectral similarity measure, α is a weighting factor that determines the contribution of the CR term, vCI and vCR are scaling factors (described below), and CR(·) is a function that performs continuum removal for the given spectral signature. The output of CR(·) is a vector with components in the range [0, 1], where values of zero lie on the estimated continuum and nonzero values indicate the depth of the absorptions (relative to the estimated continuum) at given wavelengths. Continuum removal was initially performed using the software package ENVI [8], which approximates the continuum using a convex hull for the closed polygon defined by the given spectrum. In our experiments, we have found that for certain spectral types a convex hull is too coarse an approximation for the shape of the continuum. Thus, we have implemented an algorithm that approximates the continuum by first detecting a set of local maxima in the spectrum of interest, and then iteratively updating that set until local maxima on concave regions have been removed. Scaling factors vCI and vCR are the variances of all pairwise distances between library and cluster CI and CR spectra, respectively. We scale each term by its respective variance since the d(·, ·) and d(CR(·), CR(·)) are not (in general) in the same range. In this work, we use α = 1.0, for as straightforward comparison to earlier works as possible. 3. SPECTRAL MATCHING FOR CLUSTER SIGNATURES IN AN URBAN AVIRIS IMAGE 3.1. Data The hyperspectral image in this study was acquired by a low-altitude AVIRIS flight on Nov 5, 1998, over Ocean City, MD [9], with spatial resolution of 4m/pixel. Data preprocessing, segmentation, the resulting image clusters and their signatures are presented in [1]. The high spatial and spectral resolution and the sensitive segmentation technique allowed to discriminate 35 clusters with varied characteristics
including (very) small, and spectrally similar ones (a labeled subset of which appears in Table 1). As verified from field data these clusters represent distinct material types, and most of them are clearly (albeit non-uniquely) associated with objects such as a water tower, a tennis court, buildings, roads, boardwalks, parking lots, a coast guard lookout tower, and landscape units. However, for some clusters which can be recognized on the functional level (i.e., buildings, mini golf course), we do not have material identification (e.g., metal with blue paint). We use a library of about 1000 field spectra collected in the vicinity of Santa Barbara, CA [10]. The spectra were acquired in 1075 wavelengths in the 0.35 to 2.4 µm range and are mostly of man-made materials. Since our cluster map contains several vegetation clusters which are not represented in the above library, we added vegetation spectra from the USGS spectral library [11], and several AVIRIS [12] spectra from training regions described in [13]. 3.2. Spectral Matching of Ocean City Cluster Signatures We evaluate the quality of spectral matches for the Euclidean distance and the Spectral Information Divergence with CI, CR, and combined CICR terms. Prior to evaluating these similarity measures, both cluster and library signatures are divided by the sum of their components. This is necessary for probabilistic measures like the SID, and has no effect on the relative distances computed by the ED. For each cluster signature c, we calculate the mean Spectral Discriminatory Power (proposed in [4]) for the corresponding m best library matches Lc = {lc1 , . . . , lcm }. In this work, we use m = 3. The mean Spectral Discriminatory Power is defined as: ( ) m c d(lci , c) d(lj , c) 1 X d , PW (c) = 2 max (2) m i,j=1 d(lcj , c) d(lci , c) where d(·, ·) is the spectral similarity measure we wish to evaluate. This estimates the power, for a given similarity measure, of distinguishing the library signatures lci ∈ Lc from one another, with respect to a particular cluster signature, c. The Spectral Discriminatory Power takes values in the range [1, ∞), where a value of one indicates that lci = lcj . Intuitively, PWd values near one indicate that the m library signatures are “indistinguishable” for cluster signature c, so if similarity measure d0 outperforms d1 (such that each lc ∈ Lc is less distinguishable in d0 than in d1 for cluster c), then the value of PWd0 (c) is less than PWd1 (c). However, in our experiments, we have found that PWd is sensitive to spectrum representation (CI or CR), and occasionally does not capture visually strong matches (particularly in the case of CR spectra). To address this issue, we visually inspect the top m library matches for each cluster signature c for each similarity measure. We then assign a “visual score” (VS) to each lc ∈ Lc in the range of [0, 3], based on overall spectral shape and absorption band positions/widths, where 0 = poor quality for all m matches, 1 = fair quality, 2 = good quality, and 3 = strong correspondence between all matches to the cluster signature. Our analysis is summarized in Table 1. Ideally, these scores would be evaluated by multiple independent human observers, but for the proof of concept presented in this work, matches were evaluated separately by the authors. We see improved performance in spectral matching by including the CR term in the similarity measure (illustrated in Fig. 2). Interestingly, CICRED and CICRSID achieve equivalent average performance despite the fact that SID generally outperforms the ED on CI signatures alone, and has nearly equivalent performance on
In Proc. IEEE WHISPERS 2009, Grenoble, FR, Aug 26-28, 2009 Measure CIED CRED CICRED CISID CRSID CICRSID
A 2 0 2 2 0 1
C 1 2 2 1 2 2
Visual Scores of Selected Clusters D E G J K M V WY Z c d 1 0 1 1 2 1 1 2 2 2 0 0 2 0 0 0 2 2 2 1 1 1 0 1 2 0 1 1 1 2 1 2 2 1 1 1 2 0 2 1 2 1 1 2 2 2 0 0 1 0 0 0 2 2 2 1 1 1 0 1 2 1 1 1 2 2 2 1 1 1 1 1
g 0 1 1 0 1 1
h 1 0 0 1 0 0
l 1 1 2 1 1 2
VS (sel) 1.05714 1.00000 1.17142 1.11428 0.97142 1.17142
Average Performance VS (all) PWd (sel) 1.05555 1.00683 0.94444 1.00367 1.27777 1.00226 1.16666 1.02427 0.88888 1.01436 1.27777 1.01019
PWd (all) 1.00922 1.00334 1.00333 1.03200 1.01253 1.01230
Table 1: Performance assessment of spectral similarity measures by mean Spectral Discriminatory Power (PWd ∈ [1, ∞), 1 = best) and visual scores (VS ∈ [0, 3], 3 = best). Results are presented for clusters whose visual scores varied between the six similarity measures (sel), in addition to scores for all 35 clusters (all). The best average results are indicated in bold face. Notably, the CICRED and CICRSID are tied in terms of visual scores. For selected clusters, the following surface covers are represented: rooftops (D,E), roads/parking (J,W,Z,h), walkways (G), vegetation (K,M), wet sand (Y), a green tennis court (C), boardwalks (g), and a mini golf course (V). Clusters A, c, d and l require further inspection to determine what cover types they represent. the CR signatures, see Fig. 3. However, in terms of PWd , the ED outperforms the SID, especially with respect to improvements between the CId vs. CICRd measures. Furthermore, we observe that in cases where one of the CId or CRd measurements yields a better visual score than the other, the combined measure generally achieves the best of the CId and CRd scores. This occurs using CICRED with clusters A,C,D,G,J,M,W,Y,d,g, and using CICRSID with clusters D,J,M,V,d and g.
4. DISCUSSION AND FUTURE DIRECTIONS In this work, we have shown that considering both continuum intact (CI) and continuum removed (CR) spectra (CICR spectra) in evaluating spectral similarity of hyperspectral signatures yields improved performance with both the Euclidean distance and Spectral Information Divergence. Furthermore, we have demonstrated that while the Spectral Information Divergence outperforms the Euclidean distance on CI spectra alone, we achieve approximately the same performance with both measures using CICR signatures. Allowing the CI and CR terms to carry equal weight using the CICRd measure may be suboptimal. For instance, if we examine the visual scores of clusters Z and h in Table 1, we see that CICRd yields a worse score than CId because we combine a good match (CId ) with a poor match (CRd ). In this work, we set α to 1.0 for straightforward comparison to earlier works, but we expect to achieve improved spectral matching performance by allowing other α values. Determining the most effective α value is non-trivial since α is data dependent, and may need to be framed as an optimization problem. Even with perfect spectral matches, material labels may remain ambiguous (e.g., two library matches are very similar to a target spectrum but have different material labels, like in Fig. 2, bottom, or Fig. 3, top left). We also point out that, in this work, we address the problem of determining material labels for image spectra. Semantic labeling of objects can still remain ambiguous, which, in turn, will require additional context (e.g. spatial or temporal relationships). In this work, we validate match “quality” (in terms of spectrum shape and absorption band properties) by visual inspection of the most similar library spectra. This manual step is necessary since determining match quality is intrinsically related to spectral similarity - a “high quality” match is one that is very similar to the cluster signature, and vice-versa. One possible way to resolve this issue is to use multiple similarity measures to “cross-validate” the library matches. However we currently do not have the capability to employ this method in a robust, automated manner.
Figure 2: Comparison of the top three spectral matches using CId vs. CICRd measures. Top: CIED . Middle: CISID . Bottom: CICRED and CICRSID (both yield the same set of library matches). Cluster signature C (a green tennis court) is indicated with a thick, solid line, and corresponding library matches are indicated with dashed lines. While average shape characteristics are captured from CI spectra alone, adding CR signatures yields a stronger set of matches.
In Proc. IEEE WHISPERS 2009, Grenoble, FR, Aug 26-28, 2009
Figure 3: Top: Example where the the CICRED (left) yields a better overall set of matches than the CICRSID (right). Bottom: Example where CICRSID (right) outperforms CICRED (left) with a set of matches better aligned in absorption band positions. Cluster signatures are indicated with thick solid lines, and library signatures with dashed lines. Despite being less similar in shape, library match “Light Gray Comp. Shingle” for cluster K using measure CICRSID (bottom right), better aligns with the absorption band positions of the cluster signature.
Acknowledgements: We thank Dar Roberts for the use of their library of urban field spectra, and for his gracious assistance with it; and Bill Farrand for sharing his expertise on several technical and software-related details. B. Bue is supported by NASA GSRP Fellowship NNX0AR79H. E. Mer´enyi is partially supported by grant NNG05GA94G from the Applied Information Systems Research Program, NASA, Science Mission Directorate.
[6]
[7]
5. REFERENCES [1] E Mer´enyi, B Csath´o, and K Tasdemir, “Knowledge discovery in urban environments from fused multi-dimensional imagery,” Proc. 4th IEEE GRSS/ISPRS Joint Workshop on Rem. Sens. Data Fusion over Urban Areas (URBAN 2007), pp. 1–13, 2007. [2] RH Yuhas, AH Goetz, and JW Boardman, “Discrimination among semi-arid landscape endmembers using the spectral angle mapper (SAM) algorithm,” in Summaries of the 3rd Annual JPL Airborne Geoscience Workshop, 1992, vol. 1, pp. 147– 149. [3] F van der Meer and W Bakker, “CCSM: Cross correlogram spectral matching,” Rem. Sens., vol. 18, no. 5, pp. 1197–1201, 1997. [4] CI Chang, “An information-theoretic approach to spectral variability, similarity, and discrimination for hyperspectral image analysis,” IEEE Trans. Info. Theory, vol. 46, no. 5, pp. 1927– 1932, 2000. [5] RN. Clark, GA Swayze, KE Livo, RF Kokaly, SJ Sutley, JB Dalton, RR McDougal, and CA Gent, “Imaging spectroscopy: Earth and planetary remote sensing with the USGS
[8] [9]
[10]
[11]
[12]
[13]
tetracorder and expert systems,” J. Geophys. Res., vol. 108(E12), no. 5131, 2003. F van der Meer, “Spectral curve shape matching with a continuum removed CCSM algorithm,” Rem. Sens., vol. 21, no. 16, pp. 3179–3185, 2000. F van der Meer, “The effectiveness of spectral similarity measures for the analysis of hyperspectral imagery,” Applied Earth Observations and Geoinformation, vol. 8, no. 1, pp. 3–17, 2006. Research Systems Inc, ENVI 4.6 Users Guide, 2008. B Csath´o, W Krabill, J Lucas, and T Schenk, “A multisensor data set of an urban and coastal scene,” Photogrammetry and Remote Sensing, Jan 1998. M Herold, D Roberts, M Gardner, and P Dennison, “Spectrometry for urban area remote sensing—development and analysis of a spectral library from 350 to 2400 nm,” Rem. Sens. of Environ., Jan 2004. RN Clark, GA Swayze, R Wise, E Livo, T Hoefen, R Kokaly, and SJ Sutley, “USGS digital spectral library splib06a: U.S. geological survey, digital data series 231.,” 2007. RO Green, ML Eastwood, CM Sarture, TG Chrien, M Aronsson, BJ Chippendale, JA Faust, BE Pavri, CJ Chovit, and M Solis, “Imaging spectroscopy and the airborne visible/infrared imaging spectrometer (AVIRIS),” Remote Sensing of Environment, vol. 65, no. 3, pp. 227–248, 1998. E Mer´enyi, WH Farrand, LE Stevens, TS Melis, and K Chhibber, “Mapping colorado river ecosystem resources in Glen Canyon: Analysis of hyperspectral low-altitude AVIRIS imagery,” Proc. of ERIM, 14th Int’l Conf. and Workshops on Applied Geologic Rem. Sens., 2000.