AUTOMATED LOCALISATI. IN RETINAL. S. Sekhar. Department of. University of Liverpool, B. Email: ABSTRACT. The retinal fundus photograph is widely used ...
16th European Signal Processing Conference (EUSIPCO 2008), Lausanne, Switzerland, August 25-29, 2008, copyright by EURASIP
AUTOMATED LOCALISATION OF OPTIC DISK AND FOVEA IN RETINAL FUNDUS IMAGES S. Sekhar, W. Al-Nuaimy and A. K. Nandi Department of Electrical Engineering and Electronics University of Liverpool, Brownlow Hill, L69 3GJ, Liverpool, UK. Email: {ssbm, wax, aknandi} @liverpool.ac.uk
ABSTRACT
The retinal fundus photograph is widely used in the diagnosis and treatment of various eye diseases such as diabetic retinopathy and glaucoma. Medical image analysis and processing has great significance in the field of medicine, especially in non-invasive treatment and clinical study. Normally fundus images are manually graded by specially trained clinicians in a time-consuming and resource intensive process. A computer-aided fundus image analysis could provide an immediate detection and characterisation of retinal features prior to specialist inspection. This paper describes a novel method to automatically localise both the optic disk and the fovea. The optic disk is localised by means of using the morphological operations and by using the Hough transform. The fovea is localised by means of its spatial relationship with the optic disk, and from the spatial distribution of the macula lutea. Results from two clinical data sets have been promising.
analysis has been used by Li and Chutatape to differentiate the optic disk from other sources [1]. They produced a training set using the brightest pixels that were firstly clustered as candidate optic disk regions. Principal component analysis was then applied to project a new image to the ‘disk space’. Then, the location of the optic disk centre was found by calculating the minimum distance between the original retinal image and its projection.
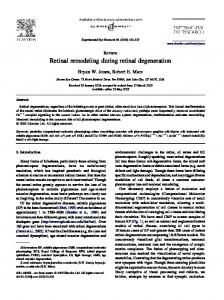
1. INTRODUCTION The fundus images are used for diagnosis by trained clinicians to check for any abnormalities or any change in the retina. They are captured by using special devices called ophthalmoscopes. A typical fundus image with its features marked is shown in the Figure 1. Each pixel in the fundus image consists of three values namely red, green and blue, each value being quantised to 8 bits.
The information about the optic disk can be used to examine the severity of some diseases such as glaucoma. Changes in the optic disk can indicate the current state and progression of a certain disease. The location of the optic disk is an important issue in retinal image analysis as it is a significant landmark feature, and its diameter is usually used as a reference length for measuring distances and sizes. It approximately determines the location of the fovea or the centre of vision, which is of great importance as lesions in the macular region affect vision dramatically. Localisation of the retinal optic disk has been attempted by several researchers recently. The optic disk is usually the brightest component on the fundus, and therefore a cluster of high intensity pixels will identify the optic disk location. This works well, unless there are other potential fundus features such as exudates. Principal component
Figure 1 - Colour retinal features.
fundus
image
showing
main
Sinthanayothin et al. correctly identified the location of the optic disk employing the variance of intensity between the optic disk and adjacent blood vessels in 111 of 112 colour fundal images, giving both a sensitivity and specificity of 99.1% [2]. However, this algorithm often fails for fundus images with a large number of white lesions, or strongly visible choroidal vessels. Akita and Kuga localised the optic disk by backtracking the vessels to their origin [3]. This is certainly one of the safest ways to localise the optic disk, but is heavily reliant on successful vessel detection. Mendels et al used the morphological filtering techniques and active contours to find the boundary of the optic disk [4]. Walter and Klein used an area threshold to localise the optic disk and the watershed transformation to find its contours [5]. Hoover and Goldbaum correctly identify the optic disk location in 89% of 81 images, 50 of which were diseased retinas using a ‘‘fuzzy convergence’’ algorithm [6]. Park et al [7] used the repeated thresholding technique to find the brightest particle, then used the
16th European Signal Processing Conference (EUSIPCO 2008), Lausanne, Switzerland, August 25-29, 2008, copyright by EURASIP
roundness of the object to detect optic disk features, and then localised the optic disk by using the Hough transform. The fovea is a small, slightly concave area without retinal capillaries and its detection is very important for ocular diagnosis systems. It appears as a dark area, in contrast to the rest of the retina where retinal vessels are enhanced by the fluorescent liquid. The fovea is so important because some specialised cells that provide central vision lie in it. Therefore, the severity of a lesion partially depends on its distance to the fovea. With regard to the fovea segmentation, Zana et al [8] used mathematical morphology and proposed an algorithm based on region merging. Ibanez and Simo [9] applied Bayesian methodology to detect the fovea contour. Sinthanayothin et al. [2] report a sensitivity and specificity for correct identification of the fovea as 80.4% and 99.1%, respectively, in 112 images, when compared with an experienced ophthalmologist. Li and Chutatape [1] attempt detection of the foveal region, using model-based methods. They estimate the position of the fovea by extracting the points on the main blood vessels by a modified active model, and fitting a parabola curve with the optic disk as the centre. The fovea is then located (or estimated) at 2 disk diameters (DDs) from the optic disk on the main axis of this parabola. Goldbaum et al. [10] fixed the position of the fovea relative to the optic disk.
The red, green and blue channels of the image are combined as illustrated in Figure 2(b) and it shows a good variation between the optic disk and the background. As in [2], the local intensity variation of the image is used to find the locus of the optic disk. As the optic disk is a bright pattern, and as the vessels appear dark, the gray level variation in this region is higher than in any other part of the image. Unfortunately, this is only true if there are no exudates on a dark background. Therefore, a shade correction operator is used in order to remove slow background variations. This has been calculated by subtracting the approximated background from the gray-tone image and has the effect of a low pass filter. Further morphological opening and closing has the effect of filtering out the blood vessels and small exudates.
(a)
(b)
This paper is structured as follows: Section 2 presents the methodology and outlines the main techniques used, while Section 3 presents the results. Conclusions are presented in Section 4. 2. METHODOLOGY 2.1 Detection of Optic Disk The optic disk appears in colour fundus images as a bright yellowish or white region. Its shape is more or less circular, interrupted by outgoing vessels, although sometimes due to the nature of the photographic projection it has the form of an ellipse. Mathematical morphology in image processing is particularly suitable for analysing shapes in images. The two main processes are those of dilation and erosion. These processes involve a special mechanism of combining two sets of pixels. Usually, one set consists of the image being processed and the other a smaller set of pixels known as a structuring element or kernel. Two very important transformations are opening and closing. Opening performs erosion followed by dilation whereas Closing performs dilation followed by erosion. Intuitively, dilation expands an image object and erosion shrinks it. Opening generally tends to smooth the contour in an image, breaking narrow isthmuses and eliminating thin protrusions. Closing tends to narrow smooth sections of contours, fusing narrow breaks and long thin gulfs, eliminating small holes, and filling gaps in contours.
(c) Figure 2 - Results of applying morphological processing to a healthy retinal image: (a) Original fundus image (b) Graytone image (c) After background removal and filtering of blood vessels. The binary image which contains the brightest and the biggest part from the shade corrected image shown in Figure 2(c) is computed by the area thresholding method. The initial boundary of the optic disk is traced from that binary image as in Figure 3(a). A circular region of interest (ROI), 3 times the equivalent diameter of the initially traced blob boundary as in Figure 3(b) is used to find the contours of the optic disk. The magnitude gradient of the image for the ROI is calculated with the use of morphological operations. Initially morphological closing is performed on the ROI to fill the vessels, and then to remove large peaks morphological opening is performed. Then the image is reconstructed using morphological reconstruction. Then the
16th European Signal Processing Conference (EUSIPCO 2008), Lausanne, Switzerland, August 25-29, 2008, copyright by EURASIP
gradient is calculated by subtracting the eroded ROI from the dilated one, as shown in Figure 3(c). The boundary of the optic disk and its centre are found by applying the Hough transform to the gradient image. The Hough transform is a method for finding shapes in an image, and in this case the shape of interest is a circular contour. The basic idea behind the Hough transform is to transform the image into a parameter space that is constructed specifically to describe the desired shape analytically. Maxima in this parameter space then correspond to the presence of the desired shape in image space. The circular Hough transform is similar to the linear Hough transform, but uses the parametric form for a circle: ����������������������������� � ��� � � � �� � � ������������������� � where (a, b) is the centre of the circle of radius r that passes through (x, y).
(a)
(c)
(b)
(d)
corresponding to the radius closest to the expected optic disk radius is adopted and plotted over the original fundus image as shown in Figure 3(d). The Hough transform is fairly robust and immune to the effects of spurious noise and discontinuities in the edge boundaries. This enables correct recognition of the optical disk even if only part of it is visible. As the morphological gradient is used to delineate the edges of the retinal features, there is less likelihood of error caused by non-edge pixels. This gradient image can also be skeletonised (thinned) to improve the detection accuracy; however the improvements delivered by this change were minimal. The Hough transform also benefits from a reduced search area due to the preceding region selection stage that narrowed down the candidate area to a circular region of diameter equivalent to three times the (expected) optical disk diameter. 2.2 Detection of the Fovea The macula lutea is a yellow spot near the center of the retina, with a diameter of about 1.5 mm and is often defined as having two or more layers of ganglion cells. On retinal fundus images, the macula appears as a dark region nearby the centre of the image. Near the centre of the macula is the fovea: a tiny area responsible for our central, sharpest vision. Unlike the peripheral retina, it has no blood vessels; instead, it has a very high concentration of cones, allowing for the appreciation of colour. It is the darkest part in most fundus images; in some images it is not obvious to human eyes due to bright lighting or being covered by lesions. Its geometrical relation to the optic disk is used in this section to localise the fovea. After locating the optic disk, the macula region can be determined by exploring the region in the vicinity of the image centre, as determined by the optic disk centre, as follows. The candidate macula ROI is defined as the portion of a sector subtended at the centre of the optic disk by an angle of 30o above and below the line between this centre and the centre of the retinal image disk. The angle 30o is chosen so as to circumscribe within the sector portion a circle of twice the diameter of the optic disk, as suggested by Chutatape [11]. The radius of the inner arc for this ROI is 1.5 times the optic disk diameter, as illustrated in Figure 4.
Figure 3 - (a) Initial traced boundary (b) ROI for optical disk search (c) Reconstructed gradient (d) Localised optic disk. The Hough space is three dimensional. The gradient image is transformed to a set of 3 parameters, representing the accumulator, its centre and its radius. For each feature point, votes are accumulated in an accumulator array for all parameter combinations. The accumulator will have set of edge points; each edge point contributes a circle of radius r in the accumulator. The accumulation space has peaks where these contributory circles overlap at the centres of any circles detected. If N circles are detected, the centre array is a 2×N matrix with each row containing the (x, y) positions of the circles detected in the image. The estimated radii of these circles are stored in a 1×N array with a one-to-one correspondence to the centre array. The circle
Figure 4 – Geometry of macula candidate ROI.
16th European Signal Processing Conference (EUSIPCO 2008), Lausanne, Switzerland, August 25-29, 2008, copyright by EURASIP
The macula is identified within this ROI by iteratively applying a threshold, and then applying morphological opening (erosion followed by dilation) on the resulting blob. The value of the threshold is selected such that the area of the smoothed macula region is no more than 80% of that of the detected optic disk (corresponding to a macula diameter of 90% of the optic disk diameter), as shown in Figure 5. Once the macula region is identified, the fovea is simply determined as the centroid of this blob, as the intensity variation between the fovea and the macula is often less than the variation caused by noise introduced during the photographic process or “clutter” within this ROI such as exudates.
(a)
of 100% (6 images have been excluded for not having visually-detectable fovea). Figure 6 shows the results of the localisation of both the optic disk and the fovea in the fundus retinal images. The proposed method has also been tested with the STARE dataset [13]. This consists of 20 fundus images of dimensions 605×700, captured by a TopCon TRV-50 fundus camera at 35o FOV. The proposed method is implemented on 17 images (3 images have been excluded for not having a visually-detectable optic disk). Our proposed method localised the optic disk correctly in 14 images with a success rate of 82.3% and localised fovea correctly in 10 images with a success rate of 100% (7 images have been excluded for not having visually-detectable fovea), bringing the overall success rate over both datasets for optic disk and foveal localisation as 88.3% and 100% respectively.
(b) Figure 6 – Retinal image with localised optic disk, macula and fovea Mendels et al [4] tested their method on a set of 9 images with a success rate of 100%. Walter and Klein [5] tested their algorithm on 30 images with a success rate of 90%. However, in some of the images, there were small parts missing or small false positives. Hoover and Goldbaum [6] evaluated their method on 81 images with a success rate of 89%. Park et al [7] evaluated their method on the DRIVE database with a success rate of 90.25%.
(c)
(d)
Figure 5 – (a) ROI for macula localisation (b) ROI after applying adaptive thresholded (c) Smoothed macula (d) Identified macula and fovea. 3. RESULTS The proposed technique was tested on the DRIVE database of retinal images [12]. This consists of 40 fundus images of dimensions 768×584, captured by a Canon CR5 non-mydriatic 3CCD camera with a 45o field of view (FOV). These images contain both normal (healthy) and abnormal retinas. In this study, 36 of these images were used (4 images have been excluded for not having visually-detectable optic disks). The performance of the optic disk localisation was evaluated based on the determined optic disk location with regard to an expert. Our proposed method is capable of localising the optic disk correctly for 34 of these images (success rate of 94.4%). Our method is able to detect the fovea in all of these 34 images with a success rate
4. CONCLUSIONS In this paper, we have presented novel methods to detect and localise the optic disk, macula and the fovea in retinal fundus images. This will help in detection and characterisation of abnormalities in the eye such as those related to diabetic retinopathy. Further geometrical shape and structures of these detected parameters can be utilised for automatic characterisation of normal and abnormal eyes. The optic disk localisation can be further improved by developing a more robust shade correction operator and improving the automatic thresholding. The identification can also be improved by proposing a model which identifies the optic disk shape properly by adjusting the Hough transform to identify both circular and elliptical shapes. The results obtained thus far are promising and demonstrate both applicability of the proposed system and its superior performance compared to existing techniques. Further tests
16th European Signal Processing Conference (EUSIPCO 2008), Lausanne, Switzerland, August 25-29, 2008, copyright by EURASIP
should be carried out on the proposed method when more suitable clinical data are available. Such tests could contribute to further improvements, resulting in more robust and accurate detection that eventually could be adapted for clinical purposes. 5. ACKNOWLEDGEMENTS The authors would like to thank Prof. Simon Harding, a consultant at the Clinical Eye Research Centre, St Paul's Eye Unit, Royal Liverpool University Hospital, for discussions. S. Sekhar would like to acknowledge the financial support of the University of Liverpool for this research. REFERENCES [1] H. Li and O. Chutatape, “Automated feature extraction in color retinal images by a model based approach”, IEEE Trans. Biomed. Eng, vol. 51, pp. 246–254, 2004. [2] C. Sinthanayothin, J. F. Boyce, H. L. Cook and T. H. Williamson, “Automatic localisation of the optic disk, fovea, and retinal blood vessels from digital colour fundus images”, Br. J. Ophthalmol., vol. 83, no. 8, pp. 902-910, 1999. [3] K. Akita and H. Kuga, “A computer method of understanding ocular fundus images”, Pattern Recogn, vol. 15, no. 6, pp. 431–443, 1982. [4] F. Mendels, C. Heneghan, and J.P. Thiran, “Identification of the optic disk boundary in retinal images using active contours”, in Proc. Irish Machine Vision Image Processing Conf, pp. 103–115, Sept. 1999. [5] T. Walter and J. C. Klein, “Segmentation of color fundus images of the human retina: Detection of the optic disk and the vascular tree using morphological techniques”, in Proc. 2nd Int. Symp. Medical Data Analysis, pp. 282–287, Oct. 2001. [6] A. Hoover and M. Goldbaum, “Locating the optic nerve in a retinal image using the fuzzy convergence of the blood vessels”, IEEE Trans Biomed. Eng, vol. 22, pp. 951–958, 2003.
[7] M. Park, J. S. Jin and S. Luo, “Locating the optic disk in retinal images”, in Proc. Intl. Conf. on Computer Graphics, Imaging and Visualisation, pp. 141-145, 2006. [8] F. Zana, I. Meunier and J. C. Klein, “A region merging algorithm using mathematical morphology: application to macula detection”, in Proc. Intl. Symp. on Mathematical Morphology, pp. 423-430, 1998. [9] M. Ibanez and A. Simo, “Bayesian detection of the fovea in eye fundus angiographies”, Pattern Recognition Letters, pp. 229-240, 1999. [10] M. Goldbaum, S. Moezzi, S. Taylor, S. Chatterjee, J. Boyd, E. Hunter, R. Jain, “Automated diagnosis and image understanding with object extraction, object classification, and inferencing in retinal images”, in Proc. IEEE Intl. Conf. on Image Processing, vol. 3, pp. 695–698, 1996. [11] O. Chutatape, “Fundus foveal localisation based on vessel model”, in Proc. IEEE Engineering in Medicine and Biology Society Intl. Conf, pp. 4440–4444, Sept. 2006. [12] J. J. Staal, M. D. Abramoff, M. Niemeijer, M. A. Viergever and B. V. Ginneken, "Ridge based vessel segmentation in color images of the retina", IEEE Trans. Med. Imag, vol. 23, pp. 501-509, 2004. [13] STARE project, Clemson University. http://www.ces.clemson.edu/~ahoover/stare [14] S. A. Salem, N. M. Salem and A. K. Nandi, “Segmentation of retinal blood vessels using a novel clustering algorithm (RACAL) with a partial supervision strategy”, Medical and Biomedical Engineering and Computing, vol. 45, no.3, pp. 261-273, 2007.