AbstractâColor retinal photography is an important tool to de- tect the evidence of various eye diseases. Novel methods to extract the main features in color ...
246
IEEE TRANSACTIONS ON BIOMEDICAL ENGINEERING, VOL. 51, NO. 2, FEBRUARY 2004
Automated Feature Extraction in Color Retinal Images by a Model Based Approach Huiqi Li*, Member, IEEE, and Opas Chutatape, Senior Member, IEEE
Abstract—Color retinal photography is an important tool to detect the evidence of various eye diseases. Novel methods to extract the main features in color retinal images have been developed in this paper. Principal component analysis is employed to locate optic disk; A modified active shape model is proposed in the shape detection of optic disk; A fundus coordinate system is established to provide a better description of the features in the retinal images; An approach to detect exudates by the combined region growing and edge detection is proposed. The success rates of disk localization, disk boundary detection, and fovea localization are 99%, 94%, and 100%, respectively. The sensitivity and specificity of exudate detection are 100% and 71%, correspondingly. The success of the proposed algorithms can be attributed to the utilization of the model-based methods. The detection and analysis could be applied to automatic mass screening and diagnosis of the retinal diseases. Index Terms—ASM, biomedical image processing, exudate, feature extraction, fovea, optic disk, PCA, retinal image.
I. INTRODUCTION
R
ETINAL photography is an essential mean to document and diagnose various eye diseases in clinics. Color retinal images are widely used to mass screen systemic diseases such as diabetic retinopathy. Early detection and treatment of these diseases are crucial to avoid preventable vision loss. In the traditional way of diagnosis, the ophthalmologists will examine retinal images, search the possible anomalies and give the diagnostic results. The automatic processing and analysis of retinal images could save workloads and may give objective detection to the ophthalmologists. Feature extraction, which is the fundamental step in an automated analyzing system, is investigated in this paper. Efforts have been made to extract the normal and abnormal structures in retinal images automatically and robustly. Applying computer image processing techniques to the analysis of color retinal image was reported as early as 1974 [1]. Developing automatic retinal image analyzing and diagnostic system has attracted the interests of many researchers since then. The difficulties are mainly due to the noises, uneven illumination, and variation between individuals. Bottom-up processing techniques were applied to locate optic disk by many research groups. The optic disk was located by the
Manuscript received December 21, 2002; revised June 1, 2003. This work was supported in part by the Nanyang Technological University research fund. Asterick indicates corresponding author. *H. Li is with the Department of Computer Science, School of Computing, National University of Singapore, 3 Science Drive 2, Singapore 117543. O. Chutatape is with the School of Electrical and Electronic Engineering, Nanyang Technological University, Singapore 639798. Digital Object Identifier 10.1109/TBME.2003.820400
largest region that consists of pixels with the highest gray levels in [2] and [3]. The area with the highest intensity variation of adjacent pixels was identified as optic disk in [4]. These methods could obtain satisfactory result in normal retinal images where optic disk is obvious and brightest. Only in [5], images with small lesions were considered. These methods will lead to the wrong disk localization when there are large areas of bright lesions similar to optic disk in an image. The geometrical relationship between optic disk and blood vessels was utilized in the identification of optic disk in [6] and [7], which are top-down methods. The main blood vessels were fitted to an ellipse and the end of the long axis of the ellipse was identified as optic disk in [6]. In [7], the optic disk was located by tracing the blood vessel trees back to their root. The idea of these two methods sounds reasonable. While the implementation becomes difficult as the vessel detection itself is a more complicated task. The contour of optic disk was estimated as a circle or an ellipse in [2], [3], and [5], because the shape of optic disk is round or vertically slightly oval. In one approach, Hough transform was employed to obtain the estimated circle of optic disk based on the result of edge detection [2], [3]. In another approach, optic disk contours were estimated by the Hausdorffbased matching between the detected edges and the template of circle with different sizes [5]. Estimation the shape of optic disk as a circle or an ellipse cannot provide enough information to the ophthalmologists. As the shape of optic disk is important to diagnose eye diseases, the exact boundary detection of optic disk has been investigated. “Snakes” was applied to detect the exact contour of optic disk in [8]–[10]. The major advantage of these algorithms is their ability to bridge discontinuities in the image feature being located. However, the algorithms were sensitive to the preprocessing and the methods proposed in the above papers were not fully automatic due to the requirement of manual initialization. The main difficulty to apply these methods to disk boundary detection is how to remove the influence of blood vessels. Exudates are one of the most common occurring lesions in diabetic retinopathy. Three strategies have been employed to the exudate detection: thresholding [3], [11], [12], edge detection [7], [13], and classification [14], [15]. Thresholding method is the most straightforward approach of exudate detection. The automatic selection of the threshold is difficult due to the uneven intensity of the exudates and the low contrast between exudates and retinal background. Methods based on the edge detection or classification can make the detection fully automatic. How to distinguish the edge of exudates from the edge of vessels and other lesions is the main concern of the methods based on edge detection. Statistical classification [15] and neural network [14]
0018-9294/04$20.00 © 2004 IEEE
LI AND CHUTATAPE: AUTOMATED FEATURE EXTRACTION IN COLOR RETINAL IMAGES BY A MODEL BASED APPROACH
were also attempted, which are cataloged into classification approach. There has been no report of the complete success in the clinical trial of the available techniques. Novel methods to localize optic disk and fovea, extract the shape of optic disk, set up fundus coordinate system, and detect exudates are proposed in this paper. The success of our approach can be attributed to the utilization of model-based methods, which make use of the a priori knowledge of the retinal images. Details of the proposed algorithms are presented in Section II; Experimental results are shown in Section III, and Section IV gives a brief conclusion of this paper. II. METHODOLOGY A. Localization of Optic Disk by PCA Optic disk is the entrance region of blood vessels and optic nerves to the retina. It is a significant anatomic landmark for the detection of other features and its dimensions are often studied for a clue of some diseases as well. The method of optic disk localization by finding the largest cluster of brightest pixels is simple, fast and works well in the normal retinal images, but it could not locate optic disk correctly in the images where the area of bright lesions is large or optic disk is obscured by blood vessels. Principal component analysis (PCA) [16], [17] is proposed to localize optic disk in this paper. PCA, which takes the advantage of the top-down strategy, can extract the common characteristics among the training images. These common characteristics are then used to detect the similar object in an input image. PCA will only be employed to the candidate regions to reduce the computation time. The localization procedure is performed on the intensity image. The pixels with the highest 1% gray levels in intensity image are selected. They are mainly from the areas in optic disk or bright lesions based on the test drawn from a large number of retinal images. These selected pixels are clustered by the single pass method [18] to determine the candidate regions. If the number of the pixels in a cluster is less than 0.04% of the total pixel number in the retinal image, the cluster is abandoned. Those abandoned clusters are most likely due to noises or small bright lesions, as 0.04% is a small portion compared to the area of optic disk. For all the remaining clusters, a candidate region is defined as a square with the cluster’s centroid as its center. The side of the square is chosen as 1.4 times of the average disk diameter. The proposed PCA approach includes three steps: obtaining disk space, projection on disk space, and calculating the distance from disk space. In order to obtain a training image, a square image around the optic disk is cropped manually from a retinal pixels to image. The cropped subimages are resized to perform scale normalization, where is the average disk diameter. Their intensities are rescaled to the same range of by a simple linear quantization, which is the intensity normalization. The training set consists of these normalized subimtraining image can also be treated as a vector ages. An -dimensional space. PCA transform is performed on in an the training vectors. In our application, ten subimages are employed as the training set and the first six eigenvectors corresponding to the largest six eigenvalues are selected to represent
247
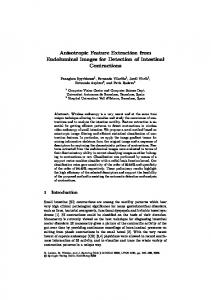
the training set. The first six eigenvectors can represent 90% of the total variance in the training set. The subspaces defined by these eigenvectors are referred to as disk space. For each pixel subimage with the pixel as in the candidate regions, an the center is obtained automatically. Intensity normalization of the subimage is carried out, similarly to that in the training images. The subimage is projected onto the disk space by the PCA transformation. The distance from disk space is simply defined as the Euclidian distance between the subimage and its reconstruction onto the disk space, which measures the likeliness of optic disk. Though optic disk usually measures about 1.5 mm in diameter, it may show some variation. Thus the performance of the localization drops when the size of the optic disk in a practical image is not close to that of the eigendisks. The multi-scale eigendisks are used here, in which an input subimage is compared with the eigendisks at a number of scales. The image will be near only to the disk space of the closest scaled eigendisks. ) is applied to PCA method with different scales ( each pixel in the candidate regions of a retinal image. The pixel ) with the minimum distance in all the candidate regions ( and among all the scales is located as the center of optic disk. The approximate size of the optic disk in a testing image can also be obtained. B. Boundary Detection of Optic Disk by a Modified ASM Change in the shape, color or depth of optic disk is an indicator of various ophthalmic pathologies especially for glaucoma. The accurate detection of the optic disk boundary can be used to assess the progress of eye disease and the treatment results. Some parts of the disk boundary are not well defined and some parts are partly obscured by the blood vessels in retinal images, which make the detection of disk shape complicated. A modified active shape model (ASM) is proposed to detect the disk boundary in retinal images. ASM [19] consists of building a point distribution model (PDM) from a training set and an iterative searching procedure to locate instance of such shapes in a new image. In the application of disk boundary detection, a shape instance is ) landmark points. A represented by the position of ( retinal image and its corresponding shape instance are shown , ) are selected in Fig. 1. Fourteen points (point on the main blood vessels inside optic disk to constrain the representation of the shape model. The other points ( and ) are chosen evenly on the disk boundary. Eight such shapes are employed to train the PDM in our application. The training shapes are aligned to a common coordinates by a transformation that includes translation, rotation and scaling. The parameters of the transformation are obtained by minimizing the Euclidian distance between the shapes using a routine least square approach. PCA is next performed on the aligned training shapes. A shape model can be represented by (1) is the mean shape of the aligned training set, is a vector of shape parameters, is the set of the eigenvectors corresponding to the largest eigenvalues of the covariance where
248
IEEE TRANSACTIONS ON BIOMEDICAL ENGINEERING, VOL. 51, NO. 2, FEBRUARY 2004
where , denotes the position of the th landmark point of the shape model in shape space, , represents the position of the is the pose pamodel center in the image space. rameter vector that determines the transformation. The strategy of ASM mainly composes of initialization, matching point detection, and pose and shape parameter update. The location of ) and the mean shape are utilized to initialize optic disk ( the shape model in image space according to (2), where , , , , . To each landmark point on the model in the image space, its matching point is searched along the normal profile of the model. The first derivative of the intensity distribution along the normal profile is employed to find the matching points. The presence of blood vessel is identified by a negative pulse followed by a positive pulse within the width range of vessels, while there is a single negative pulse where disk edge appears. The transformation between the shape model in the shape space and the new matching points set in the image space is similar to (2). Its pose parameter can be obtained by minimizing the following expression: (3) Thus pose parameter is updated. The inverse transformation is used to transform the matching points in the image space back to in the shape space. The shape parameter is updated by projecting the matching points onto the shape space (4)
Fig. 1.
A retinal image and its corresponding shape instance of optic disk.
matrix of the training shapes. The first four eigenvectors are used ( ), which represent 93.22% of the total variance of the training shapes. (1) is a statistical description of disk shape and its variations. The model thus obtained is called point distribution model (PDM). The space defined by the input image is referred to as image space and the space described by (1) is termed as shape space. The variables in the shape space are denoted by lowercases and those in the image space are represented by uppercases in this paper. Denoting the shape model in the shape space as and in the image space as , respectively, the transformation between the shape space and the image space is defined by (2)
The constriction of is applied to so that a new shape will be similar to those in the training set, where is the th largest eigenvalue. With the newly obtained shape parameter and pose parameter vector , the shape model in the shape space is updated according to (1) and the shape in the image space is updated as (2). The procedure model of matching point detection and parameter ( and ) update is iterated until the shape model is converged. Some matching points may be misplaced in the detection due to weak edges or noises, which make the shape obtained not properly fit the boundary in the image. Two aspects are proposed to improve the original ASM algorithm. One improvement includes adding self-adjusting weight in the update of pose parameter . Weight factor is added to (3) to get a better pose parameter
(5)
are the positions of the th matching point and where and is the the th model point in the image space, respectively, weight factor. In each iteration, the transform for alignment is and once performed twice: once with the initialized weight . is initialized according to how its corwith the adjusted is obtained in that iteration. If a responding matching point matching point cannot be detected directly, it is estimated by the
LI AND CHUTATAPE: AUTOMATED FEATURE EXTRACTION IN COLOR RETINAL IMAGES BY A MODEL BASED APPROACH
249
nearby matching points. It is updated as the landmark point if the nearby matching points are not available either is be detected is estimated by its nearby matching points is updated by (6) is set to zero to eliminate the effect of in the transformation when cannot be detected and the nearby matching points cannot be detected either. The shape model is updated by the is adtransformation with the obtained pose parameter . justed by (7) is the Euclidean distance between the matching point where and the updated landmark points in the image space. is adjusted to be piece-wise reciprocal ratio of , which is a negative feedback. The pose parameter is refined by minimizing (5) with the adjusted weight factor. The mismatched points also affect the shape parameter vector according to (4). The misplaced matching points are excluded to get better shape parameters, which is another modification. The idea is similar to the self-adjusting weight in the sense that it also includes the concept of feedback. In each iteration, the shape parameter is obtained in the same way as the original ASM first. A matching point is considered to be an outbetween the lying point or misplaced matching point when matching point and the updated landmark point is larger than a constant value. Those outlying points will not be used in the procedure of obtaining shape parameter (8) is the number of misplaced matching points, , , , . , , correspond to , and in (4), respectively. The final shape model is estimated from (1) by reconstructing the shape model in -D landmark space with the same parameter obtained from (8). These two modifications make the algorithm more favorable for the cases of weak edges. where
C. Foveal Coordinate System Establishment The locations of lesions are as important as their size and number to the ophthalmologists [20]. Therefore, not only the detection but also the means to describe the spatial locations of the objects need to be investigated. A polar fundus coordinate system is set up based on the location of fovea in this paper. In order to establish the foveal fundus coordinate system, the fovea is localized first. The fovea is a small depression on the fundus, which is indicated by a deep-red or red-brown color in color retinal images. It is temporal to and slightly below the optic disk. The fovea is the darkest part in most of the retinal images, while it is not obvious in some images due to high illumination or being covered by the lesions. Its geometrical relation to other structures is employed to locate the fovea robustly. The modified ASM introduced in Section II.B is applied to extract the main courses of blood vessels. The main courses of blood vessels are represented by 30 landmark points as shown
Fig. 2.
An example of landmark points on the main courses of vessel.
in Fig. 2. Eight landmark sets are utilized to derive the PDM. The eigenvectors with the largest four eigenvalues are chosen, which represent 94.27% of the variation in the training set. The mean shape and the location of optic disk are used to initialize the shape model in the image space in the similar way as the boundary detection of optic disk. The centerline midpoint of the blood vessel with the strongest edge along the normal profile is detected as the matching point. Observing the main courses of the blood vessels, its shape is roughly a parabolic curve. The extraction result is fitted to a parabola for the future localization of fovea. The generalized parabola can be described as (9) is the focal length, ( ) is the vertex, and is the where rotation of the directrix. Four parameters ( ) should be estimated to decide a parabola in an image. The methods of quadratic curve fitting can be divided into two broad techniques: clustering (such as Hough-based methods) and least square fitting. The idea of Hough transform is to map the data into the appropriately quantized parameter space, and then seek for the most likely values of the parameters. The maximum peak will not be much higher than the other peaks when the number of data is not large enough for the number of unknowns. As only 30 landmark points are available to describe the main courses of vessels, Hough transform alone is not suitable for fitting the landmark points to a parabola. While observing the (9), it is a nonlinear model with respect to the parameters because of the rotation of the directrix. The ideas of Hough transform and linear least square fitting are combined in our curve fitting. The rotation is quantized in the unit of 1 from 45 to 45 to eliminate the nonlinear relationship between parameters. The vertex can be approximated at half optic disk radius nasal to optic disk, thus, the parabolic fitting is simplified as estimating the only variable by the least square fitting. Two examples of parabola fitting are illustrated in Fig. 3, where the rotation angles are 1 and 7 in Fig. 3(a) and (b), respectively, if the direction of counter clock is defined as positive. The candidate region of fovea is defined as an area of circle. ) away from Its center is located at 2DD (
250
Fig. 3.
IEEE TRANSACTIONS ON BIOMEDICAL ENGINEERING, VOL. 51, NO. 2, FEBRUARY 2004
Examples of parabola fitting.
Fig. 5.
Polar fundus coordinates centered on fovea.
divided into ten subfields as presented in Fig. 5. The radii of the three fovea-centered circles from the innermost to the outDD, 1DD, and 2DD, respectively. ermost correspond to The ten subfields are defined as: 1) central subfield within the inner circle; 2) four inner subfields (superior, nasal, inferior, and temporal) between the inner and middle circles; 3) four outer subfields (superior, nasal, inferior, and temporal) between the middle and outer circles; 4) far temporal subfield, temporal to the outer circle and between 7:30 and 10:30 meridians for the right eyes or between 1:30 and 4:30 meridians for the left eyes. Fig. 4.
The scheme of foveal candidate region decision.
the disk center along the main axis of the fitted parabola and the radius is selected as 1DD. Because the fovea is situated about 2DD temporal to the optic disk in the retinal images [21], the candidate region is such defined in order to ensure that the fovea is within the region. The definition of the foveal candidate area is illustrated in Fig. 4. The threshold is selected at the value below which the number of the pixels in the candidate region is the same as the area of optic disk, because the fovea is about the same size as optic disk [21]. The pixels with intensity below the threshold in the candidate region are clustered by the single pass method [18]. The lowest mean intensity is compared with the second lowest mean intensity to avoid mistaking the peripheral area where the illumination is relatively dark as fovea, because the fovea is not obvious in some images. The centroid of the cluster with the lowest mean intensity is located as the center of fovea when the difference is obvious and the number of pixels in the cluster is greater than 1/6 disk area. The fovea is estimated at the center of candidate region when the difference is small. To computer engineers, the images have pixels in Cartesian coordinates. While ophthalmologists usually use polar coordinates centered on the optic disk or the fovea. A polar coordinate system centered on the fovea is selected in our work. The coordinate system is set up based on the Early Treatment Diabetic Retinopathy Study Report Number10 [20]. A retinal image is
D. Exudate Detection The detection and quantification of exudates will contribute to the mass screening and assessing of the diabetic retinopathy. Exudate detection without user interaction is not a simple task, because there is no a priori knowledge about its presence or its distribution. The shape, brightness and location of exudates vary a lot among different patients. The intensity of some exudates is much lower than that of other exudates in the same retinal image though those exudates are brighter than the immediate surroundings. RGB, Lab, Luv, and hvc color spaces are assessed and Luv is selected as the suitable color space for exudate detection [22]. As the illumination in the retinal image is not homogeneous, a retinal image is divided into 64 subimages. Exudate detection is performed in each subimage. The color difference image of an object can be defined as (10) where and are the color of pixel ( ) in the component and , respectively. and are the reference color of the object. The reference color is determined as the gravity center of the object, which is described in detail in [22] average average
object region (11)
LI AND CHUTATAPE: AUTOMATED FEATURE EXTRACTION IN COLOR RETINAL IMAGES BY A MODEL BASED APPROACH
where denotes the number of pixels at ( ) in the two-dimensional histogram. Mean squared Wiener filter in two dimensions [23], which is a pixel-wise adaptive filter, is performed to remove noises. Since the information of chroma and intensity is already included in the color difference image, the edge information is combined here to segment the exudates. A combined method of region growing and edge detection is employed here to detect the exudates. In the proposed algorithm, seeds in a subimage are selected first. The pixels adjacent to a seed are tested, and the region is allowed to grow from the seed until reaching an edge or large gradient. It is noted that some local minima are from the retinal background as the retinal background is uneven. Local minima below a certain threshold are chosen as the seeds. The edges in a subimage are detected by the Canny edge detector [24]. The thresholds of the Canny edge detector are determined automatically in each subimage. The high threshold is set to the value, below which the number of the pixels occupies seventy percent of the total pixel number in the subimage. The low threshold is set to 40% of the high threshold. As some weak edges still cannot be detected, other features are examined besides checking if the region has reached an edge. Three criteria are employed in the region growing: 1) The gradient of the pixel is lower than a threshold ; 2) The difference between the pixel value and the mean value of the region is lower than a threshold ; 3) The difference between the pixel value and the value of the seed is lower than a threshold . T1, T2, and T3 are set to 3, 4, and 4, respectively, in our program based on the test drawn on a large number of images. Undersegmentation and over-segmentation situation may occur if the thresholds are not set properly. The detection results of the exudates in different subimages are merged if the exudates are connected. The presence of the exudate is identified if any exudate is detected in the retinal image.
Fig. 6.
Comparison of the optic disk localization with another method.
Fig. 7.
Boundary detected by the modified ASM compared with ASM.
251
III. RESULTS AND DISCUSSION Eighty-nine color retinal images were tested by the proposed algorithm of disk localization. Thirty-five images were provided by the Singapore National Eye Center (SNEC), ten of which were used to get the training set. Thirty images are from another hospital. Another 18 images were captured by our Canon CR6–45NM retinal camera, and the other six images were downloaded from the Internet. All the images were saved in the format of 24-bit bitmap. As the testing images are from different sources, the sizes of the images are different. The sizes of the images were resized to 512 512 pixels if they are squares, otherwise the height of an image was resized to 512 pixels while its width was resized according to the same scale. Even though the ten training images are all obtained from the images provided by SNEC, satisfactory results could be achieved when the testing image are from other sources. The average minimal distance of all the testing images is 889, which is very near to the mean distance (924) of the testing images from SNEC. Compared with the localization of optic disk by the centroid of the largest cluster of the brightest pixels [2], [3], the proposed algorithm achieves more accurate
result. An example is shown in Fig. 6, where “ ” indicates the localization by PCA, “ ” represents the localization by the centroid of the largest cluster of the brightest pixels. The method in [2], [3] gives the wrong localization when processing the retinal images with large areas of light lesions, while PCA-based method can obtain the correct localization. The proposed algorithm failed only in one of the testing images, because there is a large area of lesions around the optic disk in that image and there is no such case in the training set. More constraints such as checking the convergence of blood vessel network could be added to validate the localization of optic disk. The success rate of optic disk locating process is, thus, 99% based on the eighty-nine images tested. The 35 images from SNEC were used as the testing images for the other proposed algorithms, as verification from ophthalmologists is only available for this batch of images. In the disk
252
IEEE TRANSACTIONS ON BIOMEDICAL ENGINEERING, VOL. 51, NO. 2, FEBRUARY 2004
TABLE I LOCATION OF EXUDATES IN FIG. 8(A)
Fig. 8. Results of exudate detection in two retinal images.
boundary detection, the accuracy of the obtained shape is evaluated by comparison with a reference shape labeled manually. Mean absolute distance (MAD) [25] is employed here to indicate the difference of the two shapes. An example of disk boundary detection can be shown in Fig. 7. The initialization position is suitable as presented in Fig. 7(a). The matching points detected by the original ASM are shown in Fig. 7(b) and the boundary obtained by ASM method is illustrated in Fig. 7(c). It can be noticed that the boundary at the upper part cannot be detected correctly by the original ASM. The edge at that part is weak and several matching points are located incorrectly such that they affect the final result. The detection result by the modified ASM method is demonstrated in Fig. 7(d), which shows that the proposed modified ASM algorithm could eliminate the bad influence of the misplaced matching points. MAD is 5.0193 pixels and 3.6984 pixels for the shape instances obtained by the original ASM and the modified ASM, respectively. The performance of the modified ASM and the original ASM was compared. The modified ASM detected the boundary of optic disk successfully in 33 images, while the original ASM failed in seven of them. In the 26 images where both methods succeeded, the modified ASM also achieved better or at least as good as the results of ASM. The modified ASM needs less iterations in all the images except two cases. Both of the modified ASM and the original ASM failed in two cases, where the disk edge cannot be identified even by human eyes due to a large area of lesion near the optic disk in one case and in another case the blood vessels obscure most part of the disk edge. The results by the modified ASM are nevertheless better than those of ASM in these two images even though the obtained results are not satisfactory. The comparison shows that the modified ASM can give more robust result than the original ASM especially when there are several misplaced matching points. Experiments show that the modified ASM also converges faster than the original ASM. The fovea is detected directly by the centroid of the darkest cluster in 21 of the images. It is estimated in the other 14 images, as the fovea is not obvious in those images. The localization of the fovea is within the region of fovea in all these 35 images. But the localization deviates slightly from the apparent center in three of the images when evaluated by the human eyes. The localization of fovea is estimated in all of these three images. The reason of the deviation between the localization and the foveal center is that the estimation of two disk diameters away from disk center may not be precise.
TABLE II LOCATION OF EXUDATES IN FIG. 8(B)
Two examples of exudate detection results are given in Fig. 8. The detected exudates are represented by the white color in the figure, where foveal fundus coordinates are overlaid. It can be seen from the figures that most of the exudates can be identified successfully in these two retinal images. The locations of the exudates in these two images are described in Tables I and II, respectively. The exudates within the inner circle will affect the vision of patients more than the exudates in the other locations. Though the total number and area of exudates in Fig. 8(a) are both larger than those in Fig. 8(b), the exudates in Fig. 8(b) have more harm to the vision than those in Fig. 8(a). Clinically, the ophthalmologists will treat the case in Fig. 8(b) by laser and watch the progress of the case in Fig. 8(a). It can be noted that the distribution of exudates need to be analyzed to indicate the severity of the retinal diseases. Thirty-five images from SNEC were tested by the exudate detection algorithm. In these 35 images, seven images were identified to have no exudates by ophthalmologists. While the presence of exudates were verified in the other 28 images. The presence of exudates is successfully detected in all the 28 images. However, exudates were detected by our algorithm in two images in which no exudate is present according to the verification from the doctor. The sensitivity and specificity is 100% and 71%, respectively. The whole processing result is illustrated in Fig. 9, where “ ” and “ ” indicate the localization of optic disk and fovea, respectively, the extracted optic disk boundary is represented by the white dots, the detected exudates are highlighted by white color, and the fundus coordinates are demonstrated by
LI AND CHUTATAPE: AUTOMATED FEATURE EXTRACTION IN COLOR RETINAL IMAGES BY A MODEL BASED APPROACH
253
TABLE III PERFORMANCE OF THE PROPOSED ALGORITHMS
ACKNOWLEDGMENT The authors would like to express their gratitude to Singapore National Eye Centre for the supply of image data. REFERENCES
Fig. 9.
Processing result of a retinal image.
black color in the image. The performance of the proposed algorithms is presented in Table III. The automatic feature detection in combination with the establishment of the fundus coordinate system could make the automatic analyzing system become more reliable.
IV. CONCLUSION The algorithms for the automatic and robust extraction of features in color retinal images were developed in this paper. PCA based model is proposed to localize optic disk in the candidate regions. The boundary of optic disk is extracted by a modified ASM method. A fundus coordinate system is established to provide a better description of the features in the retinal images. An approach to detect exudates by the combined region growing and edge detection based on the color difference is proposed. Substantial experiments have been performed, which show the relative simplicity and advantages of the proposed algorithms. The success of the proposed algorithms can be attributed to the utilization of the model-based methods. Further tests should be carried out on the proposed algorithms when more suitable data are available clinically. Such tests could contribute to further improvements on the algorithms, resulting in more robust and more accurate detection that eventually can be accepted for the clinical purposes.
[1] S. Yamamoto and H. Yokouchi, “Automatic diagnosis of color fundus photographs,” in Proc. Int. Conf. Pattern Recognition, 1974, pp. 268–269. [2] S. Tamura, Y. Okamoto, and K. Yanashima, “Zero-crossing interval correction in tracking eye-fundus blood vessels,” Pattern Recogn., vol. 21, no. 3, pp. 227–233, 1988. [3] Z. Liu, O. Chutatape, and S. M. Krishnan, “Automatic image analysis of fundus photograph,” Proc. 19th Annu. Int. Conf. IEEE Engineering in Medicine and Biology Society, vol. 2, pp. 524–525, 1997. [4] C. Sinthanayothin, J. F. Boyce, H. L. Cook, and T. H. Williamson, “Automated location of the optic disk, fovea, and retinal blood vessels from digital color fundus images,” Br. J. Ophthalmol., vol. 83, no. 8, pp. 902–910, 1999. [5] M. Lalonde, M. Beaulieu, and L. Gagnon, “Fast and robust optic disk detection using pyramidal decomposition and Hausdorff-based template matching,” IEEE Trans. Med. Imag., vol. 20, pp. 1193–1200, Nov. 2001. [6] G. Zahlmann, B. Kochner, I. Ugi, D. Schuhmann, B. Liesenfeld, A. Wegner, M. Obermaier, and M. Mertz, “Hybrid fuzzy image processing for situation assessment,” IEEE Eng. Med. Biol. Mag., pp. 76–83, 2000. [7] K. Akita and H. Kuga, “A computer method of understanding ocular fundus images,” Pattern Recogn., vol. 15, no. 6, pp. 431–443, 1982. [8] S. Lee and L. M. Brady, “Integrating stereo and photometric stereo to monitor the development of glaucoma,” in Proc. British Machine Vision Conf., 1990, pp. 193–198. [9] D. T. Morris and C. Donnison, “Identifying the neuroretinal rim boundary using dynamic contours,” Image Vis. Computing, vol. 17, pp. 169–174, 1999. [10] F. Mendels, C. Heneghan, and J. P. Thiran, “Identification of the optic disk boundary in retinal images using active contours,” in Proc. Irish Machine Vision and Image Processing Conf., 1999, pp. 103–115. [11] N. P. Ward, S. Tomlinson, and C. J. Taylor, “Image analysis of fundus photographs. The detection and measurement of exudates associated with diabetic retinopathy,” Ophthalmology, vol. 96, pp. 80–86, 1989. [12] R. Phillips, J. Forrester, and P. Sharp, “Automated detection and quantification of retinal exudates,” Graefe’s Arch. Clin. Exp. Ophthalmol., vol. 231, pp. 90–94, 1993. [13] H. Li and O. Chutatape, “Fundus image features extraction,” Proc. 22nd Annu. Int. Conf. IEEE Engineering in Medicine and Biology Society, vol. 4, pp. 3071–3073, 2000. [14] G. G. Gardner, D. Keating, T. H. Williamson, and A. T. Elliott, “Automatic detection of diabetic retinopathy using an artificial neural network: A screening tool,” Br. J. Ophthalmol., vol. 80, no. 11, pp. 940–944, 1996. [15] H. Wang, W. Hsu, K. G. Goh, and M. L. Lee, “An effective approach to detect lesions in color retinal images,” Proc. IEEE Computer Society Conf. Computer Vision and Pattern Recognition, pp. 181–187, 2000. [16] M. Turk and A. Pentland, “Eigenfaces for recognition,” J. Cogn. Neurosci., vol. 3, no. 1, pp. 70–86, 1991. [17] H. Li and O. Chutatape, “Automatic detection and boundary estimation of the optic disk in retinal images using a model-based approach,” J. Electron. Imag., vol. 12, no. 1, pp. 97–105, 2003. [18] D. R. Hill, “A vector clustering technique,” in Mechanized Information Storage, Retrieval and Dissemination, Samuelson, Ed. Amsterdam, The Netherlands: North-Holland, 1968.
254
IEEE TRANSACTIONS ON BIOMEDICAL ENGINEERING, VOL. 51, NO. 2, FEBRUARY 2004
[19] T. F. Cootes, C. J. Taylor, D. H. Cooper, and J. Graham, “Active shape models-Their training and application,” Comput. Vis. Image Understanding, vol. 61, no. 1, pp. 38–59, 1995. [20] “Grading diabetic retinopathy from stereoscopic color fundus photographs – An extension of the modified Airlie house classification,” Ophthalmology, vol. 98, pp. 786–806, 1991. [21] H. W. Larsen, The Ocular Fundus: A Color Atlas. Copenhagen, Denmark: Munksgaard, 1976, pp. 10–12. [22] G. Luo, O. Chutatape, H. Li, and S. M. Krishnan, “Abnormality detection in automated mass screening system of diabetic retinopathy,” Proc. 14th IEEE Symp. Computer-Based Medical Systems, pp. 132–137, 2001. [23] J. S. Lim, Two-Dimensional Signal and Image Processing. NJ: Prentice Hall, 1990, pp. 536–540. [24] J. Canny, “A computational approach to edge detection,” IEEE Trans. Pattern Anal. Machine Intell., vol. PAMI-8, pp. 679–698, June 1986. [25] V. Chalana, D. T. Linker, D. R. Haynor, and Y. Kim, “A multiple active contour model for cardiac boundary detection on echocardiographic sequences,” IEEE Trans. Med. Imag., vol. 15, pp. 290–298, June 1996.
Huiqi Li (S’03–M’04) received the B.E. and M. E. degrees from Harbin Institute of Technology, Harbin, China in 1993 and 1995, respectively, and the Ph.D. degree from Nanyang Technological University, Singapore in 2003, all in electrical and electronic engineering. She was an Electronic Engineer with the Beijing Institute of Control Devices, Beijing, China, from 1995 to 1999. Currently, she is a Research Fellow in the School of Computing, National University of Singapore, Singapore. Her research interests include medical image processing, pattern recognition, and computer vision.
Opas Chutatape (SM’95) received the B.E. degree from Chulalongkorn University, Bangkok, Bangkok, Thailand, in 1968, the M.Sc. degree from the University of Alberta, Edmonton, AB, Canada, in 1972, and the Ph.D. degree from Queen’s University, Kingston, ON, Canada, in 1977, all in electrical engineering. His primary area of study was in communication and signal processing. He started his career after graduation as a Practical Engineer in the Telephone Organization of Thailand, and later joined the academic line as a university Lecturer. Eventually, he was with the School of Electrical and Electronic Engineering (EEE) at Nanyang Technological University, Singapore, where he has been working since the end of 1982 and presently is an Associate Professor. His interests include multimedia communication, medical image segmentation and analysis, pattern recognition, and 3-D reconstruction. During his academic leave in 1994, he was with Imaging Technology, Inc., Bedford, MA, where he made a contribution to the implementation of blood sample detection algorithm on a dedicated DSP-based image processing system. For over 20 years of teaching and supervising research projects at various levels, he has a multitude of experience and publications both in practical and theoretical aspects in his areas of interest.