Journal of Diabetes Science and Technology
ORIGINAL ARTICLES
Volume 5, Issue 2, March 2011 © Diabetes Technology Society
Automated Near-Continuous Glucose Monitoring Measured in Plasma Using Mid-Infrared Spectroscopy Thomas Jax, M.D., Ph.D.,1,2 Tim Heise, M.D.1 Leszek Nosek, M.D.,1 Jennifer Gable,3 Gene Lim,3 and Christopher Calentine3
Abstract Objective:
There are increasing calls for a precise, automated system to enable tight glycemic control and to avoid hypoglycemia in an intensive care unit setting. OptiScan Biomedical has developed a glucose monitor based on mid-infrared spectroscopy that withdraws blood samples (120 µl) and measures plasma glucose. The goal of this study was to validate the performance of the OptiScan Model 5000 over a wide range of glycemic levels in patients.
Research Design and Methods:
Sixty people with type 1 (n = 18) or type 2 (n = 42) diabetes who were otherwise healthy were connected to OptiScanners. Their blood glucose concentrations were kept in a euglycemic, hypoglycemic (180 mg/dl) range by intravenous administrations of insulin and glucose. OptiScanner venous blood samples were automatically withdrawn every 15 minutes. Reference measurements were done using the YSI 2300 glucose analyzer.
Results:
The aggregate data points (1155 paired readings) were within International Organization for Standardization standards, with 98.6% of the glucose values within ±20% above 75 mg/dl and ±15 mg/dl below this value. A Clarke error grid analysis showed a total of 1139 points (98.6%) in zone A. Points outside of A exceeded the A zone boundary by an average of 4.3%. The r2 was 0.99. The total coefficient for variance was 6.4%.
Conclusions:
These results show that the OptiScanner is highly accurate in healthy patients with diabetes across a wide range of glucose values. Mid-infrared spectroscopy may become the method of choice for highly accurate, high frequency, automated glucose measurements and may thus enable better glycemic control in critically ill patients. J Diabetes Sci Technol 2011;5(2):345-352
Author Affiliations: 1Profil Institut für Stoffwechselforschung GmbH, Neuss, Germany; 2Department of Cardiology, University Witten/Herdecke, Wuppertal, Germany; and 3OptiScan Biomedical, Inc., Hayward, California Abbreviations: (CEG) Clarke error grid, (ICU) intensive care unit, (ISO) International Organization for Standardization, (IV) intravenous, (mid-IR) mid-infrared, (NICE-SUGAR) Normoglycaemia in Intensive Care Evaluation and Survival Using Alogrithm Regulation, (PVC) polyvinyl chloride, (SEE) standard error of the estimate, (TGC) tight glycemic control, (YSI) Yellow Springs Instrument Keywords: continous glucose monitoring, spectroscopy Corresponding Author: Thomas Jax, M.D., Ph.D., Profil Institut für Stoffwechselforschung GmbH, Hellersbergstrasse 9, 41460 Neuss, Germany; email address
[email protected] 345
Automated Near-Continuous Glucose Monitoring Measured in Plasma Using Mid-Infrared Spectroscopy
Jax
Introduction
S
everal studies have shown conflicting results regarding glycemic control in intensive care unit (ICU) patients. Most researchers have shown that tight glycemic control is an integral part of reducing hospital mortality and improving patient outcomes in a critical care environment.1–4 In contrast, the Normoglycaemia in Intensive Care Evaluation and Survival Using Algorithm Regulation (NICE-SUGAR) study5 was not able to reproduce these results but rather showed a higher morbidity and mortality in tightly controlled patients, probably mostly due to a higher rate of hypoglycemia. Another study (Systolic Blood Pressure Intervention Trial) succeeded in reducing mortality and reducing hypoglycemia at the same time.6,7 This study had one of the highest sampling frequencies, with 1–2 hourly, 15–16 per day, except for the Leuven 1 and the eMPC study.1,8 Of note is that rate and method of glucose measurements were different between these studies, which may, at least in part, explain the different outcomes,9 but generally higher measurement rates are coupled with better outcome.
patient samples. The system consists of a reagentless cuvette and onboard spectrometer and uses 25 spectral bands in the range of 7 to 10 µm. Storage of spectral data on interferents (e.g., hematocrit, acetaminophen, dopamine) allows for correction.22,23 The device is intended to connect to an existing blood access port of the ICU patient, requiring no additional cannula insertion. A small sample of venous patient blood is withdrawn, the plasma is separated using a custom centrifuge within the system, and a glucose reading is produced every 15 minutes. This allows for a consistent, accurate, and reliable glucose measurement without occupying valuable hospital staff resources. This study was designed to validate the accuracy of the OptiScan system on healthy diabetes patients across a wide range of blood glucose levels, from low hypoglycemia to high hyperglycemia. Thus, the goal was to compare the glucose prediction as derived from the OptiScanner against an acknowledged and widely used reference instrument and method.
Others have thus begun to use continuous glucose monitoring (CGM) in an ICU setting to reduce clinical burden and to receive an alarm in case of hypoglycemia, but its accuracy may be too low for clinical decisionmaking.10–14 Few methods exist for accurate, regular, point-of-care measurement of blood glucose in the ICU. The use of handheld meters has been shown to be prone to error15,16 and require hospital staff to operate, and thus may reduce sampling frequency due to time constraints. Infrequent or irregular sampling of blood glucose values has been shown to increase instances of hypoglycemia in ICUs.17 Tight glycemic control demands accurate, frequent sampling with precise, reliable, and immediately available results. Some authors have observed that in an ICU, changes of blood glucose occur in a time frame of 30 minutes or less but with high rates.18,19 Thus, a 15-minute sampling rate could prove to be realistic, if not ideal, to assess these expected glucose changes. Mid-infrared (mid-IR) spectral technology has shown a high degree of promise in detecting analytes in plasma.20 Several studies have shown the value of using mid-IR spectra to detect and quantify glucose.21 Spectroscopy provides a reagentless method of measurement. OptiScan Biomedical has developed a system that uses mid-IR spectroscopy to accurately measure glucose values from
J Diabetes Sci Technol Vol 5, Issue 2, March 2011
Research Design and Methods This study was conducted under the approval of the Freiburg Ethics Commission International, adhering to the standards of the Declaration of Helsinki and the rules of good clinical practice. Informed consent was obtained from each patient before the start of any study‑related activity.
Study Population
In November and December of 2009, the OptiScan Model 5000 system was evaluated in a total of 60 subjects. Patients were otherwise healthy patients with type 1 or type 2 diabetes who had to use insulin for at least 1 year prior to the study. The participants were 50 male and 10 female subjects, with an average body mass index of 29.7 (21.4–40.1) kg/m2, an average age of 49 (18–65) years with type 1 (n = 18) and type 2 (n = 42) diabetes. Exclusion criteria included recent episodes of hyper- or hypoglycemia that required hospitalization; higher than normal values of bilirubin, creatine, hematocrit, uric acid, or electrolytes; human immunodeficiency virus or Hepatitis B/C positive; or a history of angina pectoris or New York Heart Association Class III/IV heart failure.
Study Design
The goal of the study was to compare the glucose prediction as derived from the OptiScanners against the
346
www.journalofdst.org
Automated Near-Continuous Glucose Monitoring Measured in Plasma Using Mid-Infrared Spectroscopy
Jax
YSI 2300 STAT Plus (Yellow Springs Instruments, Yellow Springs, OH) as a reference instrument across a broad range of glucose values. In total, three glucose ranges were examined: hypoglycemia (180 mg/dl). The goal was a minimum of 250 data points in each region, spread across the patient population. Each subject, whenever possible, provided at least 4 data points from each region. The study was conducted at Profil Institut für Stoffwechselforschung located in Neuss, Germany. Glucose levels in each patient were established with intravenous (IV) infusions of glucose and insulin. At all times, patients’ safety was ensured by close monitoring of patient well-being and frequent measurements of vital signs, in particular during hypoglycemia. Each subject was connected to the OptiScanner system between 4 to 8 hours. The target was to get paired samples for every OptiScanner measurement (every 15 minutes).
Investigation and Reference Device Connectivity
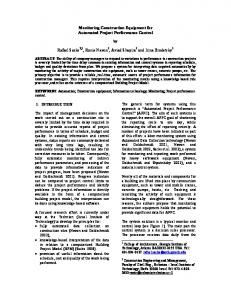
The OptiScanner was connected using an 18-gauge cannula [BD Angiocath Autoguard 1.3 × 48 mm (BD, Franklin Lakes, NJ)] to a peripheral vein in the lower forearm. In the same arm, upstream in a different vein, a second 18-gauge cannula was inserted to provide access for the YSI sample draw. The OptiScanner uses a 7’ (2.1 m) polyvinyl chloride (PVC) tubing and custom designed Luer lock tip to connect to the patient’s cannula. The OptiScanner withdrew approximately 3.0 ml of whole blood, of which 120 µl is fed into a cuvette for analysis and the remaining ~2.8 ml returned to the patient along with ~1.5 ml saline. See Figure 1 for an overview of OptiScanner blood sampling. OptiScanner measurements were taken during 15-minute intervals as per the specifications of the device. Blood was automatically withdrawn from the patient and centrifuged to separate the plasma, then a spectral measurement was taken.
Figure 1. Principle of blood sampling by the OptiScanner. The device was connected using an (A) 18-gauge cannula to a peripheral vein in the lower forearm. A (B) 7’ (2.1 m) PVC tubing and custom designed Luer lock tip was used to connect to the patient cannula. The OptiScanner withdraws approximately 3.0 ml of whole blood, of which 120 µl of (C) whole blood (1) is spun down into plasma (2) and is than fed into a cuvette for (D) spectral analysis and the remaining ~2.8 ml returned to the patient along with ~1.5 ml saline. The system is self-contained and sterile, including the miniaturized centrifuge and disposable depot for analyzed samples, thus excluding any infectious risks. The glucose value is displayed on the (E) OptiScanner device along with relevant trend information. J Diabetes Sci Technol Vol 5, Issue 2, March 2011
347
www.journalofdst.org
Automated Near-Continuous Glucose Monitoring Measured in Plasma Using Mid-Infrared Spectroscopy
Jax
The YSI sample was withdrawn within 1 minute after the OptiScan blood draw from the respective port using two 3-ml syringes. Careful attention was taken to minimizing saline dilution of the sample due to keep-vein-open saline drip and flushes that were performed prior to and after each YSI draw. Approximately 3 ml of whole blood was withdrawn from the patient and stored in a syringe. Following this, approximately 2.5 ml of whole blood was drawn into a separate syringe and discarded. A final 0.5-ml sample was drawn and centrifuged, and the plasma was used for YSI sample measurement. The initial 3 ml of blood were returned to the patient.
Analysis and Data Collection OptiScanner glucose predictions were made through an internal algorithm. YSI reference measurements were recorded alongside OptiScanner measurements. Vital signs and IV infusion rates were recorded and used for internal analysis of machine performance. Protocol-specified data analysis included correlation analysis, coefficient of variation, and analyses with the Clarke error grid (CEG) and International Organization for Standardization (ISO) specifications. The CEG, established in 1987, is the standard for quantifying the clinical accuracy of blood glucose against a reference.24 Zone A values are said to be clinically accurate with no risk. Zone B is considered generally accurate with slight risk. Finally, zone D is classified as potential failure to detect hypo- or hyperglycemia.
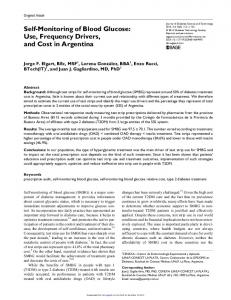
Results During the study, a total of 1155 paired glucose values were collected from 60 patients. Glucose values, according to the reference YSI, were distributed between 29 and 616 mg/dl. Of the 60 subjects, 57 provided readings from all three glucose ranges and 3 provided readings from only two ranges. In all 3 subjects, this was caused by failure to reach sufficient hyperglycemia after hypoglycemia within the predefined time limits. No adverse events related to the device were recorded and no patients were discharged prematurely. Clark error grid analysis of the data (Figure 2) shows 98.8% of values in zone A; 75% of patients had 100% of values within zone A. Of those patients with values outside zone A, 23% had only one value and 2% had two values outside zone A. Of a total of 1155 values, there were 16 that fell outside of zone A. Zone B contained 9 values, 7 of which were within 0.8–14.0 mg/dl of zone A. The remaining 2 were J Diabetes Sci Technol Vol 5, Issue 2, March 2011
348
Figure 2. Clarke error grid analysis of 1155 paired glucose samples (OptiScanner vs. YSI) from 60 subjects. The data shows 99% of values in zone A. Only 16 out of 1155 values fell outside of zone A, being randomly distributed throughout the patient population. Only 0.8% were in zone B and 0.6% in zone D: 75% of patients had 100% of values within zone A. Of those patients with values outside zone A, 23% had only one value and 2% had two values outside zone A.
24.8 and 31.4 mg/dl outside of zone A. This amounts to a percent error of 1.6–8.7% for 8 of the data points and 26.4% for the remaining 1. The 7 zone D values exceeded zone A by 0.2–6.0 mg/dl or 0.3–7.9%. No values outside zone A were consecutive and these values were distributed randomly throughout the patient population. The standard deviation of the residuals [standard error of the estimate (SEE)] was obtained by regressing the OptiScanner results on the YSI using unweighted least squares while treating the YSI value as the independent variable. This SEE was determined at 9.4. Coefficient of variance was defined as the standard deviation of the glucose estimation error divided by the mean YSI reading. This was determined to be 6.43%. For values less than 75 mg/dl, 96.7% were within 15 mg/dl of reference. For values above 75 mg/dl, 99.3% were within 20% (Figure 3 and Table 1). This exceeds the current ISO 15197 requirements for in vitro glucose monitoring, which demand that at least 95% of values be in the range described earlier. (This standard is currently under review by the Food and Drug Administration and others. At the time of this study, data exceeded ISO criteria of 95% in each region.) A potential small negative bias can be seen in the cumulative distribution function of the relative error (Figure 4). www.journalofdst.org
Automated Near-Continuous Glucose Monitoring Measured in Plasma Using Mid-Infrared Spectroscopy
Jax
Discussion This study showed that the OptiScanner system is capable of delivering highly accurate glucose measurements in a clinical environment with healthy diabetes patients. This high accuracy was kept across a wide range of glucose concentrations against a standard laboratory procedure (YSI). The CEG analysis of the paired readings showed that the device provided a clinically accurate response in 99% of all measurements. The few values that were outside of zone A were distributed randomly amongst the patient population. Values that fell into zone D exceeded zone A by a maximum of 6.0 mg/dl. These results strongly confirm and further validate data from previous preclinical studies using the OptiScanner device. One study had used plasma from ICU patients, showing a high accuracy in vitro despite a variety of potentially interfering comedications in these critically ill patients.25 An animal study in pigs confirmed safety and feasibility for use of up to 72 hours.26
Figure 3. The OptiScanner fulfills the ISO 15197 standard. To fulfill ISO standard, 95% of measurements need to be within the reference range. For the OptiScanner, 98.6% of values were in range.
Figure 4. Cumulative distribution function of the errors (relative glucose prediction error). In 849 measurements, the range containing 95% of errors was -15 to 10% for combined euglycemic and hyperglycemic values.
There were three subjects who consented to the study whose data were not included in analysis. There was difficulty for one subject in obtaining peripheral IV access, either for the OptiScanner or the YSI, and no data were gathered on this patient. The other two subjects were excluded at the decision of the principal investigator because of excessive clotting, in both the OptiScanner and the YSI lines. These two subjects had a total of 35 data points, with 83% in zone A, 14% in zone B, and 3% in zone D of the CEG.
J Diabetes Sci Technol Vol 5, Issue 2, March 2011
349
This study has some limitations. The OptiScanner is intended for use in an ICU setting in patients who suffer from a variety of comorbidities. In this proof-of-concept study, the device was studied in a relatively healthy population of patients with type 1 or type 2 diabetes. Still, we tried to come as close as possible to an ICU setting by establishing a wide range of blood glucose concentrations with a focus on both hypoglycemia and pronounced hyperglycemia with maximum blood glucose concentrations above 600 mg/dl. Glucose concentrations were kept relatively stable within the various glycemic ranges (euglycemia, hypoglycemia, hyperglycemia) to ensure that a sufficient number of paired samples could be obtained in each range. Nevertheless, glucose fluctuations will be faster and potentially larger in patients in ICUs. In fact, it has been shown that glucose variability might be an even stronger outcome predictor than are mean blood glucose concentrations.27 The accuracy beyond 8 hours is being tested in a study over a period of 72 hours, although no drop in accuracy is to be expected. Finally, in this study, the OptiScanner was connected to a peripheral vein whereas in ICU setting, a central venous line might be preferred. Thus, this study has to be regarded as a proof-of-concept, which is a necessary first step before testing OptiScanner performance in intensive care patients. Obviously, a study in an ICU setting is needed to verify the high accuracy we observed in this group of healthy diabetes patients.
www.journalofdst.org
Automated Near-Continuous Glucose Monitoring Measured in Plasma Using Mid-Infrared Spectroscopy
Jax
Table 1. The Optiscanner Fulfills ISO15197 Standard in Hypo- and Hyperglycemia. Distribution of Difference, Absolute, and Relative Absolute Difference within Each of Three Categories of Glucose Levels [Interquartile Range (IQR)]. ISO Accuracy Was Met in 96.7% for Hypoglycemia (180 mg/dl), Respectively
Difference (mg/dl)
Hypoglycemic (75–>180 mg/dl glucose) n = 480
Absolute difference (mg/dl)
Relative absolute difference (%)
Difference (mg/dl)
Hyperglycemic (>180 mg/dl glucose) n = 369
Absolute difference (mg/dl)
Relative absolute difference (%)
J Diabetes Sci Technol Vol 5, Issue 2, March 2011
350
Median
-7
Mean
-5.4
Interquartile range
[-10 , -3]
Range
[-16, 46]
Median
8
Mean
7.7
IQR
[4, 10]
Range
[0 46]
Median
12.5
Mean
13.2
IQR
[7.6, 17.5]
Range
[0.00, 63.01]
Median
-7
Mean
-5.4
IQR
[-10, -2]
Range
[-25, 44]
Median
7
Mean
7.8
IQR
[4, 11]
Range
[0, 44]
Median
6.31
Mean
6.8
IQR
[3.30, 9.40]
Range
[0, 31.40]
Median
-6
Mean
-6
IQR
[-11, -2]
Range
[-119, 51]
Median
8
Mean
9.4
IQR
[4, 11]
Range
[0, 119]
Median
3.14
Mean
3.6
IQR
[1.63, 4.88]
Range
[0, 25.27]
www.journalofdst.org
Automated Near-Continuous Glucose Monitoring Measured in Plasma Using Mid-Infrared Spectroscopy
Jax
Only under real ICU conditions will it be feasible to exclude interferences by changes in hematocrit and drugs such as acetaminophen and dopamine. Furthermore, it will allow connection of the device to a central venous line, which will be important to exclude potential interferences of parenteral nutrition (i.e., glucose infusion) with the plasma glucose measurements. While it should be feasible to avoid these interferences by connecting the device to the proximal port of a central venous line, real-life data are needed for confirmation. This proof-of-concept study was intended to demonstrate the safety of the device. Indeed, there were no device‑ related adverse events in any of the 60 patients. All patients were connected to the device for between 4 to 8 hours with no side effects. There were no clinically relevant changes in the patients’ laboratory chemical panels during the study. These are promising results that were needed before progressing to ICU patients.
and precise measurements every 15 minutes, might allow for the first time the establishment of TGC in ICU patients while avoiding hypoglycemia.
Conclusion The OptiScanner system is a highly accurate device as demonstrated with healthy diabetes patients across a wide range of glucose values. Both hyperglycemia and hypoglycemia can be detected precisely on a continuous measurement cycle using peripheral access. Safety and efficacy of the OptiScanner have been shown with no device-related adverse events. This device might provide a reliable method that effectively measures point-ofcare glucose automatically with high precision and high frequency. Future studies are needed to show the effect of these high accuracy and high frequency glucose measurements on subsequent glycemic control and patient outcome.
If the OptiScanner shows a similarly high accuracy under ICU conditions as in this study, this might be a major step to improve outcome of patients in intensive care. A growing number of studies suggest that tight glycemic control (TGC), especially in the early stages of hospital admission, reduces hospital mortality. Studies conducted at Stamford Hospital,3 R. Adams Cowley Shock Trauma Center,28 St. Vincent Medical Center,29 and Brooke Army Medical Center30 have shown favorable outcomes with TGC. The NICE-SUGAR5 trial demonstrated the international attention given to TGC and the limitations involved in using handheld glucose meters in ICU populations.31 Indeed, it will be difficult to obtain TGC with the high imprecision that has been demonstrated for glucose meters in an ICU setting.2,5,32 Additional information such as the rate of change might prove to be very valuable for clinical decisions. As this device measures blood glucose and thus differs from subcutaneous CGM systems in terms of lag and the difficulty to detect rapid changes, the Optiscanner measures real-time data. At the current stage, the Optiscanner displays blood glucose measurements over time graphically. An in-depth analysis of this parameter was not the aim of this study. Furthermore, it will be important to automate glucose measurements as much as possible. While the time spent for glucose measurements using handheld meters does not seem to be relevant (less than 5 minutes per measurement33), this adds up to nearly 2 hours per day just for glycemic management if glucose is measured only once per hour. Thus, the OptiScanner system, with automatic
J Diabetes Sci Technol Vol 5, Issue 2, March 2011
351
Acknowledgments: The data in this article were accepted for presentation at the 2010 American Diabetes Association in Orlando, Florida. Disclosure: Gene Lim, Jennifer Gable, and Christopher Calentine are employees of OptiScan Biomedical.
www.journalofdst.org
Automated Near-Continuous Glucose Monitoring Measured in Plasma Using Mid-Infrared Spectroscopy
Jax
References: 1. Van den Berghe G, Wouters P, Weekers F, Verwaest C, Bruyninckx F, Schetz M, Vlasselaers D, Ferdinande P, Lauwers P, Bouillon R. Intensive insulin therapy in the critically ill patients. N Engl J Med. 2001;345(19):1359-67. 2. Van den Berghe G, Wilmer A, Hermans G, Meersseman W, Wouters PJ, Milants I, Van Wijngaerden E, Bobbaers H, Bouillon R. Intensive insulin therapy in the medical ICU. N Engl J Med. 2006;354(5):449-61. 3. Krinsley JS. Effect of an intensive glucose management protocol on the mortality of critically ill adult patients. Mayo Clin Proc 2004;79(8):992-1000. 4. Bochicchio GV, Joshi M, Bochicchio KM, Pyle A, Johnson, Meyer W, Lumpkins K, Scalea TM . Early hyperglycemic control is important in critically injured trauma patients. J Trauma. 2007; 63(6):1353-8. 5. NICE-SUGAR Study Investigators, Finfer S, Chittock DR, Su SY, Blair D, Foster D, Dhingra V, Bellomo R, Cook D, Dodek P, Henderson WR, Hébert PC, Heritier S, Heyland DK, McArthur C, McDonald E, Mitchell I, Myburgh JA, Norton R, Potter J, Robinson BG, Ronco JJ. Intensive versus conventional glucose control in critically ill patients. N Engl J Med. 2009;360(13):1283-97. 6. Chase JG, Shaw G, Le Compte A, Lonergan T, Willacy M, Wong XW, Lin J, Lotz T, Lee D, Hann C. Implementation and evaluation of the SPRINT protocol for tight glycaemic control in critically ill patients: a clinical practice change. Crit Care. 2008;12(2):R49. 7. Preiser JC. Year in review 2008: Critical Care—metabolism. Crit Care. 2009;13(5):228. 8. Plank J, Blaha J, Cordingley J, Wilinska ME, Chassin LJ, Morgan C, Squire S, Haluzik M, Kremen J, Svacina S, Toller W, Plasnik A, Ellmerer M, Hovorka R, Pieber TR. Multicentric, randomized, controlled trial to evaluate blood glucose control by the model predictive control algorithm versus routine glucose management protocols in intensive care unit patients: response to Ligtenberg et al. Diabetes Care. 2006;29(8):1987-8. 9. Vlasselaers D, Milants I, Desmet L, Wouters PJ, Vanhorebeek I, van den Heuvel I, Mesotten D, Casaer MP, Meyfroidt G, Ingels C, Muller J, Van Cromphaut S, Schetz M, Van den Berghe G. Intensive insulin therapy for patients in paediatric intensive care: a prospective, randomised controlled study. Lancet. 2009;373(9663):547-56. 10. Chee F, Fernando T, van Heerden PV. Closed-loop glucose control in critically ill patients using continuous glucose monitoring system (CGMS) in real time. IEEE Trans Inf Technol Biomed. 2003;7(1):43-53. 11. Holzinger U, Warszawska J, Kitzberger R, Wewalka M, Miehsler W, Herkner H, Madl C. Real-time continuous glucose monitoring in critically ill patients: a prospective randomized trial. Diabetes Care. 2010;33(3):467-72. 12. Jacobs B, Phan K, Bertheau L, Dogbey G, Schwartz F, Shubrook J. Continuous glucose monitoring system in a rural intensive care unit: a pilot study evaluating accuracy and acceptance. J Diabetes Sci Technol. 2010;4(3):36-44.
16. Kanji S, Buffie J, Hutton B, Bunting PS, Singh A, McDonald K, Fergusson D, McIntyre LA, Hebert PC. Reliability of point-of-care testing for glucose measurement in critically ill adults. Crit Care Med. 2005;33(12):2778-85. 17. Juneja R, Roudebush CP, Nasraway SA, Golas AA, Jacobi J, Carroll J, Nelson D, Adab VJ, Flanders SJ. Computerized intensive insulin dosing can mitigate hypoglycemia and achieve tight glycemic control when glucose measurement is performed frequently and on time. Crit Care Med. 2009;13(5):R163. 18. Wong XW, Singh-Levett I, Hollingsworth LJ, Shaw GM, Hann CE, Lotz T, Lin J, Wong OS, Chase JG. A novel, model-based insulin and nutrition delivery controller for glycemic regulation in critically ill patients. Diabetes Technol Ther. 2006;8(2):174-90. 19. Kovatchev BP, Clarke WL, Breton M, Brayman K, McCall A. Quantifying temporal glucose variability in diabetes via continuous glucose monitoring: mathematical methods and clinical application. Diabetes Technol Ther. 2005;7(6):849-62. 20. Heise HM, Marbach R, Koschinsky T, Gries, FA. Multicomponent assay for blood substrates in human plasma by mid-infrared spectroscopy. Appl Spectrosc. 1994;48(1):85-95. 21. Kruse-Jarres JD, Janatsch G, Gless U, Marbach R, Heise HM. Glucose and other constituents of blood determined by ATR-FTIRspectroscopy. Clin Chem. 1990;36(2):401-2. 22. Karon BS, Griesmann L, Scott R, Bryant SC, Dubois JA, Shirey TL, Presti S, Santrach PJ. Evaluation of the impact of hematocrit and other interference on the accuracy of hospital-based glucose meters. Diabetes Technol Ther. 2008;10(2):111-20. 23. Tang Z, Du X, Louie RF, Kost GJ. Effects of drugs on glucose measurements with handheld glucose meters and a portable glucose analyzer. Am J Clin Pathol. 2000;113(1):75-86. 24. Clarke WL, Cox D, Gonder-Frederick LA, Carter W, Pohl SL. Evaluating clinical accuracy of systems for self-monitoring of blood glucose. Diabetes Care. 1987;10(5):622-8. 25. Krinsley J, Zheng P, Hall D, Magarian P. ICU validation of the OptiScanner, a continuous glucose monitoring device. Crit Care Med. 2006;34(12):A67. 26. Magarian P, Carrara J, Whitehair KJ, Whitehair JG, Sterling B. Plasma generating glucose monitor accuracy performance demonstrated in the animal model. J Diabetes Sci Technol. 2009;3(6):1411-8. 27. Hermanides J, Vriesendorp TM, Bosman RJ, Zandstra DF, Hoekstra JB, Devries JH. Glucose variability is associated with intensive care unit mortality. Crit Care Med. 2010;38(3):838-42. 28. Scalea TM, Bochicchio GV, Bochicchio KM, Johnson SB, Joshi M, Pyle A. Tight glycemic control in critically injured trauma patients. Ann Surg. 2007;246(4):605-10. 29. Furnary AP, Gao G, Grunkemeier GL, Wu Y, Zerr KJ, Bookin SO, Floten HS, Starr A. Continuous insulin infusion reduces mortality in patients with diabetes undergoing coronary artery bypass grafting. J Thorac Cardiovasc Surg. 2003;125(5):1007-21. 30. Mann E, Pidcoke HF, Salinas J, Holcomb JB, Wolf SE, Wade CE. The impact of intensive insulin protocols and restrictive blood transfusion strategies on glucose measurement in American Burn Association (ABA) verified burn centers. J Burn Care Res. 2008;29(5):718-23.
13. Goldberg PA, Siegel MD, Russell RR, Sherwin RS, Halickman JI, Cooper DA, Dziura JD, Inzucchi SE. Experience with the continuous glucose monitoring system in a medical intensive care unit. Diabetes Technol Ther. 2004;6(3):339-47.
31. Inzucchi S, Siegel M. Glucose control in the ICU–how tight is too tight? N Engl J Med. 2009;360(13):1346-9.
14. De Block C, Manuel-Y-Keenoy B, Van Gaal L, Rogiers P. Intensive insulin therapy in the intensive care unit: assessment by continuous glucose monitoring. Diabetes Care. 2006;29(8):1750-6.
32. Finkielman JD, Oyen LJ, Afessa B. Agreement between bedside blood and plasma glucose measurement in the ICU setting. Chest. 2005;127(5):1749-51.
15. Boyd JC, Bruns DE. Quality specifications for glucose meters: assessment by simulation modeling of errors in insulin dose. Clin Chem. 2001;47(2):209-14.
33. Aragon D. Evaluation of nursing work effort and perceptions about blood glucose testing in tight glycemic control. Am J Crit Care. 2006;15(4):370-7.
J Diabetes Sci Technol Vol 5, Issue 2, March 2011
352
www.journalofdst.org